Caffeine: Poor hit rate with sliding window of accessed values
I'm trying to test such scenario - users access their data, some users leave and some users come. So I emulate accessing 100 objects and than 100 objects with 1 old object gone and 1 new object added and so on. I do this with the following code and count for queries that do not hit the cache:
    public static class ValueSupplier implements Function<Integer, Object> {
        private final LongAdder counter = new LongAdder();

        @Override
        public Object apply(Integer integer) {
            counter.increment();
            return new Object();
        }
    }

    private static void makeTest() {
        ValueSupplier supplier = new ValueSupplier();
        LoadingCache<Integer, Object> cacheSource = Caffeine.newBuilder()
                .maximumSize(150)
                .build(supplier::apply);
        for (int i = 0; i < 10_000; i++) {
            for (int j = 1; j < 101; j++) {
                cacheSource.get(i + j);
            }
        }
        System.out.println(supplier.counter.sum());
    }

    public static void main(String[] args) {
        for (int i = 0; i < 10; i++) {
            makeTest();
        }
    }
The output of this code is:
36906
32527
17557
27113
27427
29579
26430
22559
32920
It seems that this test reveals two problems:
- I thought that this case is simple enough to have optimal 10099 queries to real system (using guava cache gives that)
- variance of results seems to be too large (notice min 17557 and max 36906)
 isopov
All 10 comments
The cache starts in an LFU-biased state and can reconfigure itself to LRU over time, based on sampling the hit rate and hill climbing. It sounds like the workload is LRU-biased if Guava did better here.
In my backlog is to optimize this adaption algorithm for small caches (less than 250 items). I think when too small, the adaption doesn't work because the history and step sizes are too small. It should be an easy fix if true, but I haven't had time to investigate that theory. The workloads I implemented against were modest to large, so I left this as an edge case to revisit when I had the time.
 ben-manes
on 25 Jun 2019
ben-manes
on 25 Jun 2019
Thanks for the hint! Increasing sliding window and cache sizes accordingly gives near-optimal hit-rate. 19999 - 20005 values from the code below.
    private static void makeTest() {
        ValueSupplier supplier = new ValueSupplier();
        LoadingCache<Integer, Object> cacheSource = Caffeine.newBuilder()
                .maximumSize(15_000)
                .build(supplier::apply);
        for (int i = 1; i < 10_001; i++) {
            for (int j = 0; j < 10_000; j++) {
                cacheSource.get(i + j);
            }
        }
        System.out.println(supplier.counter.sum());
    }
My real use case is surely closer to thousands than hundreds of elements in cache, so I will use thousands.
isopov
on 25 Jun 2019
Sorry, understood, that that was not what I wanted to test (20k total objects with 15k cache capacity). The following test:
        System.out.println("Caffeine");
        ValueSupplier supplier = new ValueSupplier();
        LoadingCache<Integer, Object> caffeine = Caffeine.newBuilder()
                .maximumSize(10_500)
                .build(supplier::apply);
        for (int i = 1; i < 10_001; i++) {
            for (int j = 0; j < 10_000; j++) {
                caffeine.get(i * 100 + j);
            }
        }
        System.out.println(supplier.counter.sum());

        System.out.println("Guava");
        ValueSupplier supplier2 = new ValueSupplier();
        com.google.common.cache.LoadingCache<Integer, Object> guava = CacheBuilder.newBuilder()
                .maximumSize(10_500)

                .build(new CacheLoader<>() {
                    @Override
                    public Object load(Integer in) {
                        return supplier2.apply(in);
                    }
                });
        for (int i = 1; i < 10_001; i++) {
            for (int j = 0; j < 10_000; j++) {
                guava.get(i * 100 + j);
            }
        }
        System.out.println(supplier2.counter.sum());
gives
8165732
Guava
1009900
I don't have the time atm to fully grok your case, so, for now, I'll just describe how it works and hopefully, you can tie things together. Otherwise, I'll try to take a look tonight (PST).
The cache starts in an LFU setting by filtering new arrivals aggressively. In this manner, 1% is dedicated to new arrivals and 99% for those that pass an LFU filter. A newer item passes this filter if its historic frequency is greater than the victim's. Both regions use LRU.
This can be too aggressive in recency-biased traces, like blockchain mining. However, being aggressive is beneficial in db/search/analytical workloads which are scan heavy. We, therefore, need to dynamically adjust the region sizes to best fit the given workload.
This is done by sampling the hit rate at (10 x maximumSize) and making an adjustment. If the hit rate increased, then we adjust in the same direction (increase space for new arrivals). If it decreases, we flip direction (decrease space for new arrivals). This is performed continuously using an initial step size of (6.25% x maximumSize). After each iteration, we decrease the step size by a rate of 0.98x to decay it, thereby allowing the policy to converge at an optimal setting. If the workload's hit rate changes by 5% or more, we restart to find the new configuration.
This means that we might start at a bad configuration, so the hit rate is poor. If the adaption works, then over time we arrive at an optimal setting and the hit rate is high. However, if the size is too small then we converge too quickly at a poor setting and we don't get the desired result. This is why I think small caches should have a minimum history, e.g. 512, to improve adaptation.
In a stress case of lru=>mfu=>lru the adaption works very well. I think the idea is sound, but needs minor fine-tuning.
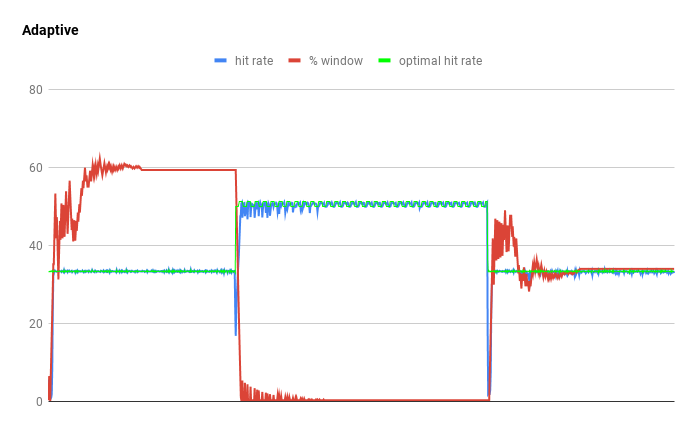
I think this is the issue you are seeing, but that's only a guess at the moment.
ben-manes
on 25 Jun 2019
I adjusted your code slightly to be fair, by adding executor(Runnable::run) to Caffeine to disable async eviction.
// 10_500
Caffeine: 0.988% hit-rate
1151983
CacheStats{hitCount=98848017, missCount=1151983, loadSuccessCount=1151983, loadFailureCount=0, totalLoadTime=58270156, evictionCount=1141483, evictionWeight=1141483}
Guava: 0.989% hit-rate
1009900
CacheStats{hitCount=98990100, missCount=1009900, loadSuccessCount=1009900, loadExceptionCount=0, totalLoadTime=85832710, evictionCount=999400}
So from the metric that the cache is optimizing for (hit rates), it is competitive at that size.
If I switch back to your original loop, it is also competitive.
// 150
Caffeine: 0.989901
10099
CacheStats{hitCount=989901, missCount=10099, loadSuccessCount=10099, loadFailureCount=0, totalLoadTime=2086226, evictionCount=9949, evictionWeight=9949}
Guava: 0.989901
10099
CacheStats{hitCount=989901, missCount=10099, loadSuccessCount=10099, loadExceptionCount=0, totalLoadTime=6573388, evictionCount=9949}
If I allow async eviction at 150, then I get the lower count of 35391 and a hit rate of 96.5%. Similarly at 10.5k, it drops the hit rate to 93%. So it seems that the async eviction is causing some skew due to an implicit thread (ForkJoinPool), whereas your test is designed for single-threaded testing. If you disable it (at least for analysis) then the results are good.
ben-manes
on 25 Jun 2019
Setting executor(Runnable::run) solved all my problems in other tests too.
AFAIU this does not mean that cache grows above maximumSize, so I'm not risking with OOM disabling this async eviction.
Should it be turned on by default? Or maybe it should not be so aggressive?
isopov
on 25 Jun 2019
That's great :)
The async eviction is optional to take advantage of free resources and not penalize the caller. It is a small penalty, but small and predictable user-facing latencies are important at scale. It isn't critical, as in Guava we didn't have a JVM-wide pool to default to, so disabling it behaves similarly by amortizing the penalty across calling threads.
When writes outpace eviction the cache can temporarily exceed the maximumSize. Otherwise, we would have to serialize all writers on a single lock (Guava partitions it, but similar problem). That reduces the write rate, which increases latencies. However, it shouldn't cause a memory leak because we use backpressure when the evictor cannot keep up. A writer adds a task to a bounded ring buffer to replay under the policy's lock and immediately schedules that work on the executor. If the buffer is full, it degrades by taking the lock directly. This deschedules the thread, allowing the evictor to be prioritized, and increases overall throughput in this stress test. The policy work is batched making it pretty efficient.
The async behavior is a nice optimization in real world behavior, but for testing its mostly annoying so turning it off as you did is simpler. Regardless, it should be fast enough so some turn it off in production without an issue.
ben-manes
on 26 Jun 2019
Closing, but happy to continue chatting / reopen.
ben-manes
on 26 Jun 2019
oh, in regards to your https://github.com/isopov/cache-testing, where "Infinispan is currently the best", they use Caffeine with async eviction disabled. It is using 2.6.2, the release before the adaptive eviction improvements. When running with async eviction disabled in Caffeine 2.7.0, the difference between Caffeine and Infinispan appears to be the small jitter caused by the adaption algorithm searching (and settling on the initial configuration). Hope that explains things a bit better.
ben-manes
on 26 Jun 2019
And the reason why async is worse is because it is capturing less access history. A read is recorded into a ring buffer and replayed against the policy under its lock. When the ring buffer is full, the replay is scheduled and new events are dropped (rather than block readers appending). When async occurs, your test thread is dropping events until the maintenance work happens, so the cache fails to capture the history and the eviction policy makes worse decisions due to lower quality information.
This again leads back to making tradeoffs for real-world, e.g. where we want high concurrency and there is other system work occurring. A cache typically follows the 80/20 rule, where 20% is popular (hot) items. So being a little lossy is okay, as we capture the important events in our sample, and don't incur a latency/throughput penalty by being too strict.
That setting makes sense in practice, but not in a simulation. In my simulator, I too disable async behavior since we care about analyzing the hit rates and none of the other factors. I believe this gives an accurate picture and its just quirks since we have to balance many tradeoffs to best satisfy everyone's needs.
ben-manes
on 26 Jun 2019
Related issues
 guidomedina
·
10Comments
guidomedina
·
10Comments
 lburgazzoli
·
6Comments
lburgazzoli
·
6Comments
 DiegoEliasCosta
·
4Comments
DiegoEliasCosta
·
4Comments
 small-P-monkey
·
3Comments
small-P-monkey
·
3Comments
 jiming
·
7Comments
jiming
·
7Comments