I'm running the latest cadvisor version and when launched it immediately takes 100% of my CPU (16 cores). I've started the container with --cpu-shares=8 (really small) and it still takes 30% of my CPU's.
 teon
teon
All 47 comments
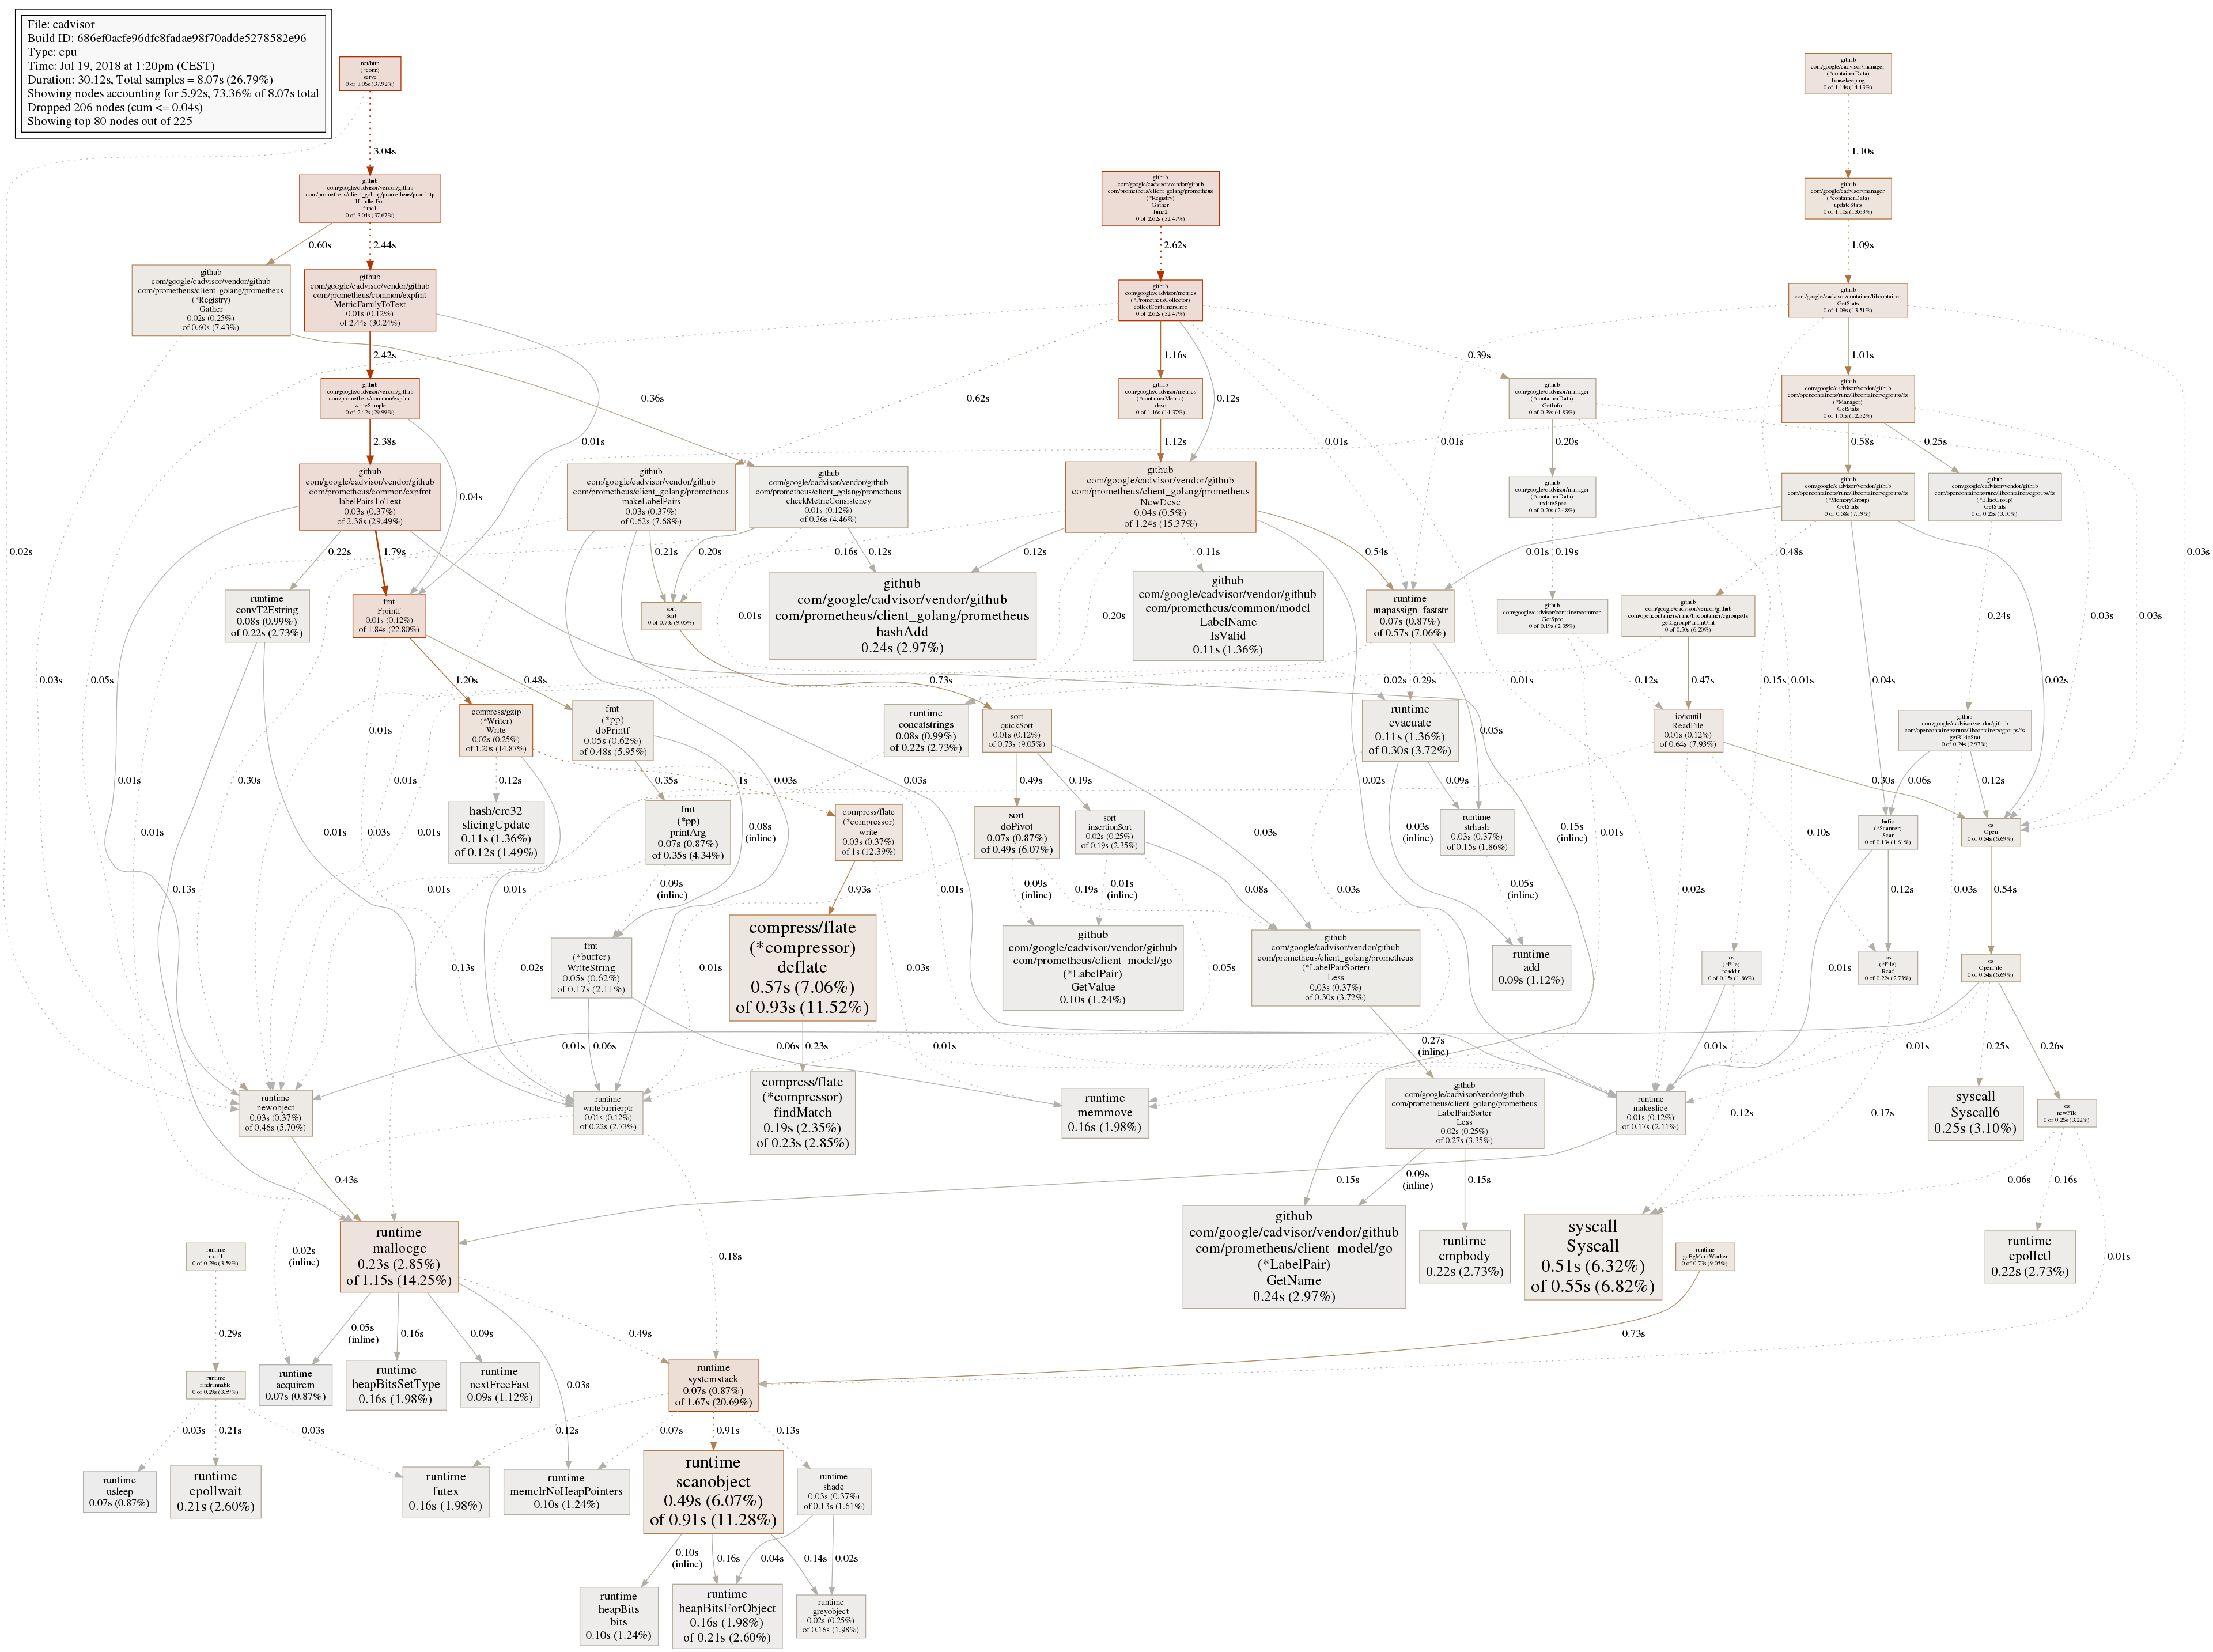
Could you get a CPU profile of cAdvisor for us to debug:
go tool pprof http://localhost:8080/debug/pprof/profile
$ png > output.png
It would also be know how about how many containers you're tracking. 0.14.0 _just_ missed some extra information we added to /validate for that :)
 vmarmol
on 22 May 2015
vmarmol
on 22 May 2015
Can confirm this issue on a MBP running atop boot2docker, though now that I'm ready to profile it's slunk back into the abyss.
 pnovotnak
on 3 Jun 2015
pnovotnak
on 3 Jun 2015
No, this is on Docker 1.6.2 - Debian Jessie (as docker host).
teon
on 3 Jun 2015
Also, I've installed lately Rancher (https://github.com/rancherio/rancher) a service for managing Docker containers which also uses cadvisor - same issue here, had to remove rancher since cadvisor took 50% of my 16 CPUs...
teon
on 3 Jun 2015
@teon could you grab a trace to help us debug?
go tool pprof http://localhost:8080/debug/pprof/profile
$ png > output.png
We _definitely_ wanna get this fixed ASAP, but have been unable to reproduce it.
vmarmol
on 3 Jun 2015
@vmarmol whar do you mean by kocalhost, should I run the command from docker container or host?
teon
on 3 Jun 2015
@teon sorry, you just need to hit the cAdvisor port so if you expose the port on the host then it is that host's hostname and port. You probably don't want to run it inside the cAdvisor container since it doesn't have Go installed.
vmarmol
on 3 Jun 2015
go tool pprof http://localhost:8080/debug/pprof/profile
Possible precedence issue with control flow operator at /usr/lib/go/pkg/tool/linux_amd64/pprof line 3008.
Read http://localhost:8080/debug/pprof/symbol
Gathering CPU profile from http://localhost:8080/debug/pprof/profile?seconds=30 for 30 seconds to
/tmp/qtt6Z8he7k
Be patient...
Wrote profile to /tmp/qtt6Z8he7k
Welcome to pprof! For help, type 'help'.
(pprof) png > output.png
Unknown command: try 'help'.
go version go1.3.3 linux/amd64
teon
on 4 Jun 2015
@teon you can ship us the /tmp/qtt6Z8he7k since that has the raw profile. Otherwise check help in pprof to see how you can output it and share it with us. The profile should be sufficient for us.
Thanks! :)
vmarmol
on 4 Jun 2015

teon
on 4 Jun 2015
Argh, that isn't working as nicely as I'd like :( @teon if you have some time can you ping me on IRC so we can try some more live debugging? I am vmarmol on Freenode, I'm in #google_containers.
vmarmol
on 4 Jun 2015
Thanks for the patience, this is the first time I try remote pprof profiling via GitHub :) I think I figured out the command line:
$ go tool pprof -png -output=out.png http://localhost:8080/debug/pprof/profile
Alternatives to png (if that's not available): svg, gif, pdf, andps
vmarmol
on 4 Jun 2015
Same problem here.
Debian 7.8
Docker version 1.7.0, build 0baf609
The graph :

The problem seem related with the number of containers running, the problem appears on servers with around 20 containers, but not on server with a couple of containers.
 cdrcnm
on 2 Jul 2015
cdrcnm
on 2 Jul 2015
I think I may be running into this as well. I'm also on a Macbook Pro with a boot2docker VM.
In my case, I noticed high CPU soon after waking my laptop. After seeing VBoxHeadless consuming 400% CPU (4 core machine), I poked around and saw that .cadvisor was doing most of the fan spinning in my Rancher agent container.
@vmarmol I tried running a slight variant of the command you suggested, but I'm getting this response:
$ go tool pprof -png -output=cadvisor-prof.png "http://$(docker-machine ip dev):8080/debug/pprof/profile"
Fetching profile from http://192.168.99.100:8080/debug/pprof/profile
Please wait... (30s)
server response: 422 status code 422
 md5
on 17 Aug 2015
md5
on 17 Aug 2015
P.S. Let me know if I should be reporting this to the Rancher folks instead or if you need any more details.
md5
on 17 Aug 2015
Nevermind the 422 error... I was being dumb and connecting to the wrong container's port 8080.
md5
on 17 Aug 2015
I'm also running on Macbook Pro (but Ubuntu VMs on VBox) and have the same issue after wake-up of the laptop - all VM around 100% each.
The issue looks to get resolved once I restart the agent processes.
So, the quick solution I have been using until a fix is found is this (inside each host if you have multiple):
kill $(ps aux | grep '[/]var/log/rancher/.cadvisor' | awk '{print $2}')
This results in this process instantly restarting and the issue is resolved until the next sleep.
It also doesn't require any manual restart of the agent(s).
 tasosz
on 13 Dec 2015
tasosz
on 13 Dec 2015
I am running this on coreos so there are a ton of services. Not seeing 100% CPU but high CPU.

 camerondavison
on 23 Dec 2015
camerondavison
on 23 Dec 2015
cc @timstclair
 vishh
on 28 Dec 2015
vishh
on 28 Dec 2015
+1, indeed need inspect the root cause
 xiaods
on 1 Jan 2016
xiaods
on 1 Jan 2016
Opened chrome tab takes 60% CPU. No wonder, if it's loading and visualizing 400 KiB of data each second.
 Vanuan
on 14 Feb 2016
Vanuan
on 14 Feb 2016
I noticed that at least 1 of my machines has been running a 'du -s' on the overlay fs for cAdvisor that seems to be taking a long time.
ps aux output
root 9875 29.2 1.9 81824 80908 ? DN 16:27 41:27 du -s /var/lib/docker/overlay/8c4ffb38e76761b9fa5c29bafa272ea3e8d7509716fc5b0c8c3ace98f6ec998e
cAdvisor runs du for aufs and overlayfs storage drivers to calculate
filesystem usage per container. We reduce the nice level of du such
that it does not affect higher priority tasks and also run it less often.
I'm surprised it is still a concern.
We can either turn it off completely or run it in a sub-cgroup to cap cpu.
On Tue, Feb 16, 2016 at 10:52 AM, Cameron Davison [email protected]
wrote:
I noticed that at least 1 of my machines has been running a 'du -s' on the
overlay fs for cAdvisor that seems to be taking a long time.ps aux output
root 9875 29.2 1.9 81824 80908 ? DN 16:27 41:27 du -s /var/lib/docker/overlay/8c4ffb38e76761b9fa5c29bafa272ea3e8d7509716fc5b0c8c3ace98f6ec998e
—
Reply to this email directly or view it on GitHub
https://github.com/google/cadvisor/issues/735#issuecomment-184825899.
vishh
on 16 Feb 2016
It is not a concern, I guess I am just trying to help to identify the problem. I just thought that it was interesting that it had a TIME of 41:27
camerondavison
on 16 Feb 2016
That is weird. I suspect a slow disk. I'm posting
https://github.com/google/cadvisor/pull/1117 to try to timeout long dus.
On Tue, Feb 16, 2016 at 10:57 AM, Cameron Davison [email protected]
wrote:
It is not a concern, I guess I am just trying to help to identify the
problem. I just that that it was interesting that it had a TIME of 41:27—
Reply to this email directly or view it on GitHub
https://github.com/google/cadvisor/issues/735#issuecomment-184830197.
vishh
on 16 Feb 2016
I'm seeing this as well on v0.21.1. stracing du I noticed it was calculating space usage under its own overlay. (c4e306db947e is cadvisor) It's going through everything that's under /rootfs as well which includes the host's /var/lib/docker. You can see where this is going. Is this a configuration issue? I'm running cadvisor as defined in the README.
lstat("/var/lib/docker/overlay/c4e306db947ecb57dbce88386cfbda7bfb5e4afe9c313902134ee72185cace14/merged/rootfs/var/lib/docker/overlay/5ae48109811049b8b149683728917381e3468375728b42e8c2ff414557c519f4/root/var/lib/dpkg/info/libudev1:amd64.md5sums", {st_mode=S_IFREG|0644, st_size=287, ...}) = 0
 mathpl
on 19 Feb 2016
mathpl
on 19 Feb 2016
statfs("/roots/var/lib/docker/devicemapper/mnt/70d15e9045b9fa71d7703d57eb7b85301de9943671472e0eb7fb858c944bd470", {f_type=0x58465342, f_bsize=4096, f_blocks=26201344, f_bfree=26116217, f_bavail=26116217, f_files=104856576, f_ffree=104843211, f_fsid={64769, 0}, f_namelen=255, f_frsize=4096}) = 0
futex(0x12f81d0, FUTEX_WAIT, 0, NULL) = 0
futex(0xc82250a110, FUTEX_WAKE, 1) = 1
futex(0x12f6e78, FUTEX_WAIT, 0, {0, 160996}) = -1 ETIMEDOUT (Connection timed out)
futex(0xc82250a110, FUTEX_WAKE, 1) = 1
futex(0xc820459310, FUTEX_WAKE, 1) = 1
futex(0x12f6e78, FUTEX_WAIT, 0, {0, 263095}) = -1 ETIMEDOUT (Connection timed out)
futex(0xc821a52110, FUTEX_WAKE, 1) = 1
futex(0xc82188a110, FUTEX_WAKE, 1) = 1
futex(0x12f6e78, FUTEX_WAIT, 0, {0, 1240}) = -1 ETIMEDOUT (Connection timed out)
futex(0xc821a52110, FUTEX_WAKE, 1) = 1
futex(0xc820b7e110, FUTEX_WAKE, 1) = 1
futex(0x12f6e78, FUTEX_WAIT, 0, {0, 62243}) = -1 ETIMEDOUT (Connection timed out)
futex(0xc821a52110, FUTEX_WAKE, 1) = 1
get timed out from strace cadvisor process
xiaods
on 23 Feb 2016
Seeing this on v0.24.1 (ae6934c)
I have a fairly large machine (50 cores, 256GB) with about 60 containers running on it currently. (CoreOS 1235.9.0 / Docker 1.12.6)
Running cadvisor with the quickstart command line here: https://github.com/google/cadvisor results in full utilization of 2 CPU's and such excessive IO that the server became unresponsive with docker ps hanging.
I was able to fix the problem by manually killing the process ID of the cadvisor process.
As a further datapoint, I saw the same behavior downloading the binary and running it outside of docker.
 dpgeekzero
on 22 Mar 2017
dpgeekzero
on 22 Mar 2017
good point
xiaods
on 23 Mar 2017
I'm having a similar issue, reminiscent of #206 too. cAdvisor's CPU load is disproportionally high. 10 containers are running (on a 32 core machine) causing anywhere between 7-25% CPU load. I've tweaked both the per container and global housekeeping intervals to 5s and 1m respectively but that doesn't seem to have made any significant dent. I'm happy to raise it as a separate issue if it feels disconnected from the disk stats calculation that this thread seems to have honed in on.
 daenney
on 15 Apr 2017
daenney
on 15 Apr 2017
So i've dealt with this in a decent number of environments before (pre-docker as well), it looks like in mesos-land they are addressing this sort of thing in mesos-1.3 via the xfs-project-quota/group quota isolator, which newer dockers also support through corresponding controls -- maybe the solution is to detect such a quota isolator and use that, or implemnt that as a toggleable metric vis-a-vis the default disk metrics?
 kainz
on 16 May 2017
kainz
on 16 May 2017
We are waiting on ext4 support for project quota to stabilize. It's been in
the roadmap for nearly a year now.
On Mon, May 15, 2017 at 6:18 PM, Bryon Roché notifications@github.com
wrote:
So i've dealt with this in a decent number of environments before, it
looks like in mesos-land they are addressing this sort of thing in
mesos-1.3 via the xfs-project-quota/group quota isolator, which newer
dockers also support through corresponding controls -- maybe the solution
is to detect such a quota isolator and use that, or implemnt that as a
toggleable metric vis-a-vis the default disk metrics?—
You are receiving this because you commented.
Reply to this email directly, view it on GitHub
https://github.com/google/cadvisor/issues/735#issuecomment-301647951,
or mute the thread
https://github.com/notifications/unsubscribe-auth/AGvIKGru6SZWQBiB3GPIYvioCyR-ZZx5ks5r6PlkgaJpZM4ElATY
.
vishh
on 16 May 2017
@vishh any updates from Google on this issue?
# timeout 10s strace -c -f -p 30402
strace: Process 30402 attached with 13 threads
strace: Process 317 attached
strace: Process 371 attached
strace: Process 386 attached
strace: Process 30402 detached
strace: Process 30467 detached
strace: Process 30468 detached
strace: Process 30469 detached
strace: Process 30470 detached
strace: Process 30471 detached
strace: Process 30483 detached
strace: Process 30484 detached
strace: Process 30485 detached
strace: Process 30607 detached
strace: Process 30630 detached
strace: Process 30769 detached
strace: Process 32358 detached
% time     seconds  usecs/call     calls    errors syscall
------ ----------- ----------- --------- --------- ----------------
 65.29   15.278506       11964      1277       147 futex
 10.57    2.473316         276      8977        15 read
  8.13    1.901699         384      4957           pselect6
  3.84    0.899657         471      1912           epoll_wait
  3.31    0.775641      258547         3           waitid
  1.87    0.438267          34     13010           lstat
  1.60    0.374308          37     10237           close
  1.20    0.281473          14     20762           fcntl
  1.20    0.279661          44      6342       369 openat
  1.19    0.279386          29      9695       756 epoll_ctl
  0.52    0.120677          24      5016           getdents64
  0.47    0.110231          49      2270       263 stat
  0.41    0.095861          21      4540           fstat
  0.20    0.047173          22      2124           newfstatat
  0.13    0.031263          29      1077           open
  0.02    0.005554        1851         3           clone
  0.01    0.002782          87        32           sched_yield
  0.01    0.001487         297         5           write
  0.00    0.000709          15        48           brk
  0.00    0.000403          45         9           pipe2
  0.00    0.000296          37         8           writev
  0.00    0.000277          25        11         6 execve
  0.00    0.000191          19        10           mprotect
  0.00    0.000152           8        20           statfs
  0.00    0.000119           1       168           rt_sigaction
  0.00    0.000117          59         2         1 restart_syscall
  0.00    0.000104          35         3           wait4
  0.00    0.000099           8        12           rt_sigprocmask
  0.00    0.000052          10         5           arch_prctl
  0.00    0.000021           4         5         5 ioctl
  0.00    0.000019           2         9           dup2
  0.00    0.000017           4         4           getuid
  0.00    0.000014           7         2           getpriority
  0.00    0.000011           6         2           setpriority
  0.00    0.000011           2         5           set_tid_address
  0.00    0.000007           2         3           uname
  0.00    0.000007           7         1           fchdir
  0.00    0.000006           2         3           getpid
  0.00    0.000003           1         3         1 rt_sigreturn
  0.00    0.000000           0         1           getsockname
  0.00    0.000000           0         4           setsockopt
  0.00    0.000000           0         2         1 accept4
------ ----------- ----------- --------- --------- ----------------
100.00   23.399577                 92579      1564 total
# strace -f -p 30402 |& grep execve
[pid  2490] execve("/bin/nice", ["nice", "-n", "19", "du", "-s", "/rootfs/var/lib/docker/overlay2/"...], 0xc422891200 /* 4 vars */ <unfinished ...>
[pid  2490] <... execve resumed> )      = 0
[pid  2490] execve("/usr/local/sbin/du", ["du", "-s", "/rootfs/var/lib/docker/overlay2/"...], 0x7ffc44c234d0 /* 4 vars */ <unfinished ...>
[pid  2490] <... execve resumed> )      = -1 ENOENT (No such file or directory)
[pid  2490] execve("/usr/local/bin/du", ["du", "-s", "/rootfs/var/lib/docker/overlay2/"...], 0x7ffc44c234d0 /* 4 vars */ <unfinished ...>
[pid  2490] <... execve resumed> )      = -1 ENOENT (No such file or directory)
[pid  2490] execve("/usr/sbin/du", ["du", "-s", "/rootfs/var/lib/docker/overlay2/"...], 0x7ffc44c234d0 /* 4 vars */ <unfinished ...>
[pid  2490] <... execve resumed> )      = -1 ENOENT (No such file or directory)
[pid  2490] execve("/usr/bin/du", ["du", "-s", "/rootfs/var/lib/docker/overlay2/"...], 0x7ffc44c234d0 /* 4 vars */ <unfinished ...>
[pid  2490] <... execve resumed> )      = 0
[pid  2491] execve("/bin/nice", ["nice", "-n", "19", "du", "-s", "/rootfs/var/lib/docker/overlay2/"...], 0xc422891470 /* 4 vars */ <unfinished ...>
[pid  2491] <... execve resumed> )      = 0
  PID USER      PR  NI    VIRT    RES    SHR S  %CPU %MEM     TIME+ COMMAND
30402 root      20   0 1596616 744408      0 S 120.7 36.5   5:47.19 cadvisor
30777 nobody    20   0  246996 198360      0 S   0.0  9.7   1:53.75 prometheus
22319 999       20   0 1201932 180264      0 S   0.0  8.8   0:11.85 mysqld
22179 arno      20   0  698808  72788      0 S   0.0  3.6   1:04.36 node
24782 arno      20   0  123180  55024   4268 S   1.2  2.7   3:10.16 gitea
22265 arno      20   0  125128  40988      0 S   0.0  2.0   0:05.95 ruby
25664 991       20   0  232432  38220  35236 S   0.0  1.9   0:00.78 php-fpm7
23566 www-data  20   0  454808  30668  16860 S   0.0  1.5   0:16.89 apache2
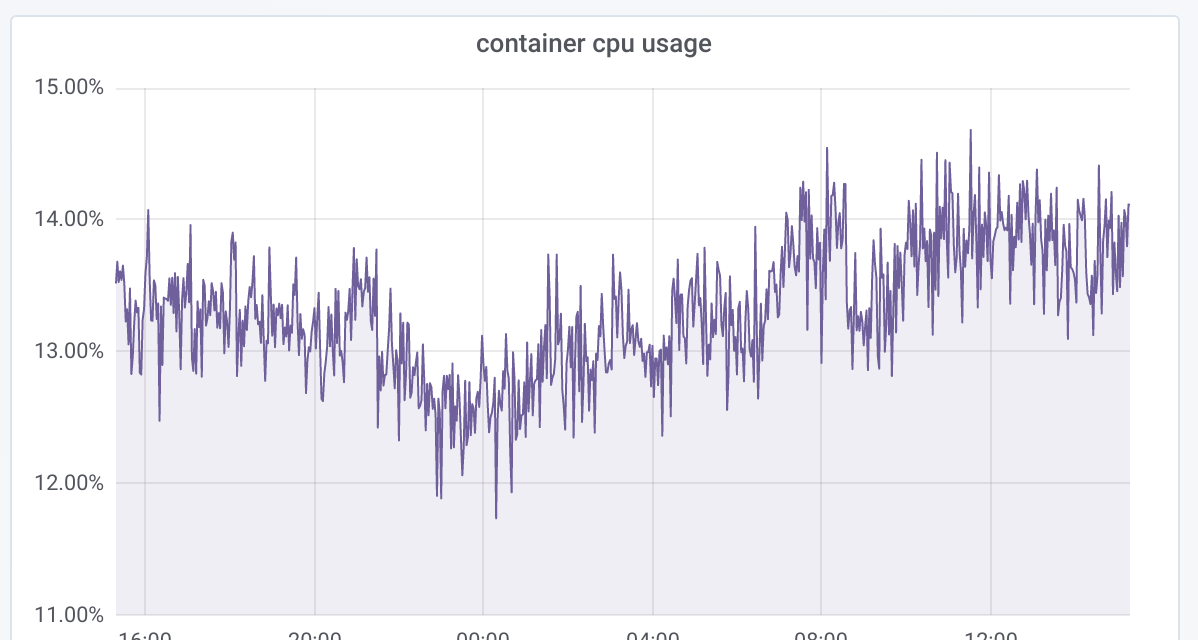
In the Grafana dashboard you can see I was restarting cadvisor once, then it starts eating all CPU/RAM again:

  cadvisor:
    restart: unless-stopped
    image: google/cadvisor:latest
    networks:
      - backend
    volumes:
      - /:/rootfs:ro
      - /var/run:/var/run:rw
      - /sys:/sys:ro
      - /var/lib/docker:/var/lib/docker:ro
- Ubuntu Linux
4.15 - cAdvisor version
v0.28.3 (1e567c2) - Docker
18.03.1-cewithoverlay2atext4.
 arno01
on 19 Jul 2018
arno01
on 19 Jul 2018
No updates sadly. Support for project quota needs to land in container
runtimes and k8s for cAdvisor to make use of it.
On Thu, Jul 19, 2018 at 4:22 AM Andrey Arapov notifications@github.com
wrote:
@vishh https://github.com/vishh any updates from Google on this issue?
—
You are receiving this because you were mentioned.
Reply to this email directly, view it on GitHub
https://github.com/google/cadvisor/issues/735#issuecomment-406243196,
or mute the thread
https://github.com/notifications/unsubscribe-auth/AGvIKKnDRjo-Bg7OdXXLaY6mltJdIU9xks5uIGwFgaJpZM4ElATY
.
vishh
on 20 Jul 2018
So, to recap this 3 year old discussion:
- 100% CPU is due to cadvisor calculating disk usage of each container
- there is a way to set so called "project quota" in some filesystems and it can be done in cadvisor out of the box
- cadvisor devs don't want to implement it until project quota is supported on ext4
So here are the questions:
Is there a way to disable calculating disk usage per container?
Will disabling du calculation reduce cadvisor CPU load?
Is it specific to ext4? Why can't it be implemented on on xfs only?
Can't container runtime limit CPU usage or project qouta? Is it because cadvisor runs in privileged mode?
Vanuan
on 22 Jul 2018
there is a way to set so called "project quota" in some filesystems and it can be done in cadvisor out of the box
FYI: Project quota (or traditional group quota) needs to be set by container management systems and then cAdvisor (or any other monitoring tool) can use the quota APIs to query usage.
Is there a way to disable calculating disk usage per container?
Yes. You can set --disable-metrics=disk.
Will disabling du calculation reduce cadvisor CPU load?
This issue seems to suggest so, but it's not clear under what scenarios that is valid - # of containers, or # of directories within containers, or something else?
Is it specific to ext4? Why can't it be implemented on on xfs only?
Project Quota support exists in both ext4 and xfs. As I mentioned above, container management systems should first start using Quota APIs in-order for cAdvisor to take advantage of it.
vishh
on 30 Jul 2018
Ok, so the blocker is not in cAdvisor, but in container runtimes, right?
Is there a tracking issue in any of these projects:
https://github.com/opencontainers/runc/
https://github.com/containerd/containerd
https://github.com/moby/moby
?
Is it something that should be handled by OCI runtime spec?
Vanuan
on 31 Jul 2018
Here's the one for k8s -
https://github.com/kubernetes/kubernetes/issues/43607
Moby maybe this one - https://github.com/moby/moby/issues/34702
Quota assignment could happen underneath OCI, although the overall system
architecture needs to be sorted out first.
Are you using docker directly or via k8s?
On Mon, Jul 30, 2018 at 8:57 PM John Yani notifications@github.com wrote:
Ok, so the blocker is not in cAdvisor, but in container runtimes, right?
Is there a tracking issue in any of these projects:
https://github.com/opencontainers/runc/
https://github.com/containerd/containerd
https://github.com/moby/moby
?Is it something that should be handled by OCI runtime spec
https://github.com/opencontainers/runtime-spec?—
You are receiving this because you were mentioned.
Reply to this email directly, view it on GitHub
https://github.com/google/cadvisor/issues/735#issuecomment-409086655,
or mute the thread
https://github.com/notifications/unsubscribe-auth/AGvIKHH71VWotDHYjm9dYiB0L3c6-54aks5uL9W-gaJpZM4ElATY
.
vishh
on 1 Aug 2018
I'm using docker swarm.
Thinking more about this, since cadvisor is using bind mounts to determine disk usage, it doesn't look like container runtime can do much about the issue. For example, fstab file must be edited to support disk quota. Also volume drivers need to be exposed to that. Though I'm not sure whether cadvisor can query disk usage of remote volumes.
Regarding the issue in moby you linked it appears that VFS only applies to images and containers. It doesn't apply to bind mounts and volumes. Correct me if I'm wrong
Created an issue here: https://github.com/moby/moby/issues/37574
Vanuan
on 1 Aug 2018
Ok, it looks like I've missed the point. As far as I understood, cadvisor runs du command only on /var/lib/docker/overlay/, to report which containers and images consume the most space. Which appears to be VFS. Is it correct?
But why use du at all? Doesn't docker expose container disk metrics on Unix socket?.. But that looks to be expensive too: https://github.com/moby/moby/issues/31951
With --disable-metrics=disk, would cadvisor still report disk free metrics?
Vanuan
on 1 Aug 2018
Dockers or the cni apis dont necessarily have any great options on top of that, yet. If I had to roll out a system for that today, you have to do something to acquire quota knowledge both on image layers (particularly the per container layer), and on volume drivers. The latter is actually slightly simpler as you could get as simple as implementing a bind mount wrapper that does prjquota and exposes those metrics elsewhere.
For container fs and/or layers, I suppose the easiest thing to do would be to dig into runc and add hooks for setting up then querying a prjquota which you would then need to bubble up to the docker API through however many layers. This is easier on some graph drivers (say btrfs/xfs/zfs) than others.
I'd actually recommend starting with the btrfs graph driver as you get automatic subvolume quotas when you enable quota on a parent volume. Use xfs if you want to get a good feel for everywhere you'll need to do a system API integration though, it's more manual there. Anyways once you have those you want an api to query use, and depending on your clients/needs you may also need to log max quota used and/or have something periodically querying usage to get p95 usage or the like.
I'd recommend getting something working first and then deal with the huge pile of edge case enablement later. That or stick to block device provisioning/mounts like most of the cloud provider solutions.
On July 31, 2018 6:12:30 PM PDT, John Yani notifications@github.com wrote:
I'm using docker swarm.
Thinking more about this, since cadvisor is using bind mounts to
determine disk usage, it doesn't look like container runtime can do
much about this. For example, fstab file must be edited to support disk
quota. Also volume drivers need to be exposed to that. Though I'm not
sure whether cadvisor can query disk usage of remote volumes.Regarding the issue in moby you linked it appears that VFS only applies
to images and containers. It doesn't apply to bind mounts and volumes.
Correct me if I'm wrongCreated an issue here: https://github.com/moby/moby/issues/37574
--
You are receiving this because you commented.
Reply to this email directly or view it on GitHub:
https://github.com/google/cadvisor/issues/735#issuecomment-409416384
--
Sent from my Android device with K-9 Mail. Please excuse my brevity.
kainz
on 1 Aug 2018
Volume metrics and per-container disk metrics aren't a very clear distinction. Prometheus node-exporter for example can get away with statvfs, but disk usage is not tracked say per-overlay, thus the need for the per-container du call in cadvisor. That's what the project quota idea is meant to mitigate. You could also do it with more conventional (aka it's been around 10-20y longer) user/group quota if you rig the right things up with PID/GID namespace mapping. That breaks all sorts of abstractions though, thus the leaning towards project quota.
On July 31, 2018 6:33:55 PM PDT, John Yani notifications@github.com wrote:
Ok, it looks like I've missed the point. As far as I understood,
cadvisor runsducommand only on /var/lib/docker/overlay/, to report
which containers and images consume the most space. Which appears to be
VFS. Is it correct?But why use du at all? Doesn't docker expose container disk metrics on
Unix socket? But that looks to be expensive too:
https://github.com/moby/moby/issues/31951With
--disable-metrics=disk, would cadvisor still report disk free
metrics?--
You are receiving this because you commented.
Reply to this email directly or view it on GitHub:
https://github.com/google/cadvisor/issues/735#issuecomment-409419785
--
Sent from my Android device with K-9 Mail. Please excuse my brevity.
kainz
on 1 Aug 2018
To add though, maybe a 'per-container' disk free metric would be useful, even if that free space happens to be shared amongst other containers. You can sort of rig that up already but maybe having that available would be a useful option? (I.e. you could use a system wide df metric to flag containers on a given host as 'in danger', but that's certainly a more expensive query)
On July 31, 2018 6:33:55 PM PDT, John Yani notifications@github.com wrote:
Ok, it looks like I've missed the point. As far as I understood,
cadvisor runsducommand only on /var/lib/docker/overlay/, to report
which containers and images consume the most space. Which appears to be
VFS. Is it correct?But why use du at all? Doesn't docker expose container disk metrics on
Unix socket? But that looks to be expensive too:
https://github.com/moby/moby/issues/31951With
--disable-metrics=disk, would cadvisor still report disk free
metrics?--
You are receiving this because you commented.
Reply to this email directly or view it on GitHub:
https://github.com/google/cadvisor/issues/735#issuecomment-409419785
--
Sent from my Android device with K-9 Mail. Please excuse my brevity.
kainz
on 1 Aug 2018
I've got an issue which looks really similar to this one:
But as far as I can understand it looks more related to memory stats, not?
 WnP
on 5 Oct 2018
WnP
on 5 Oct 2018
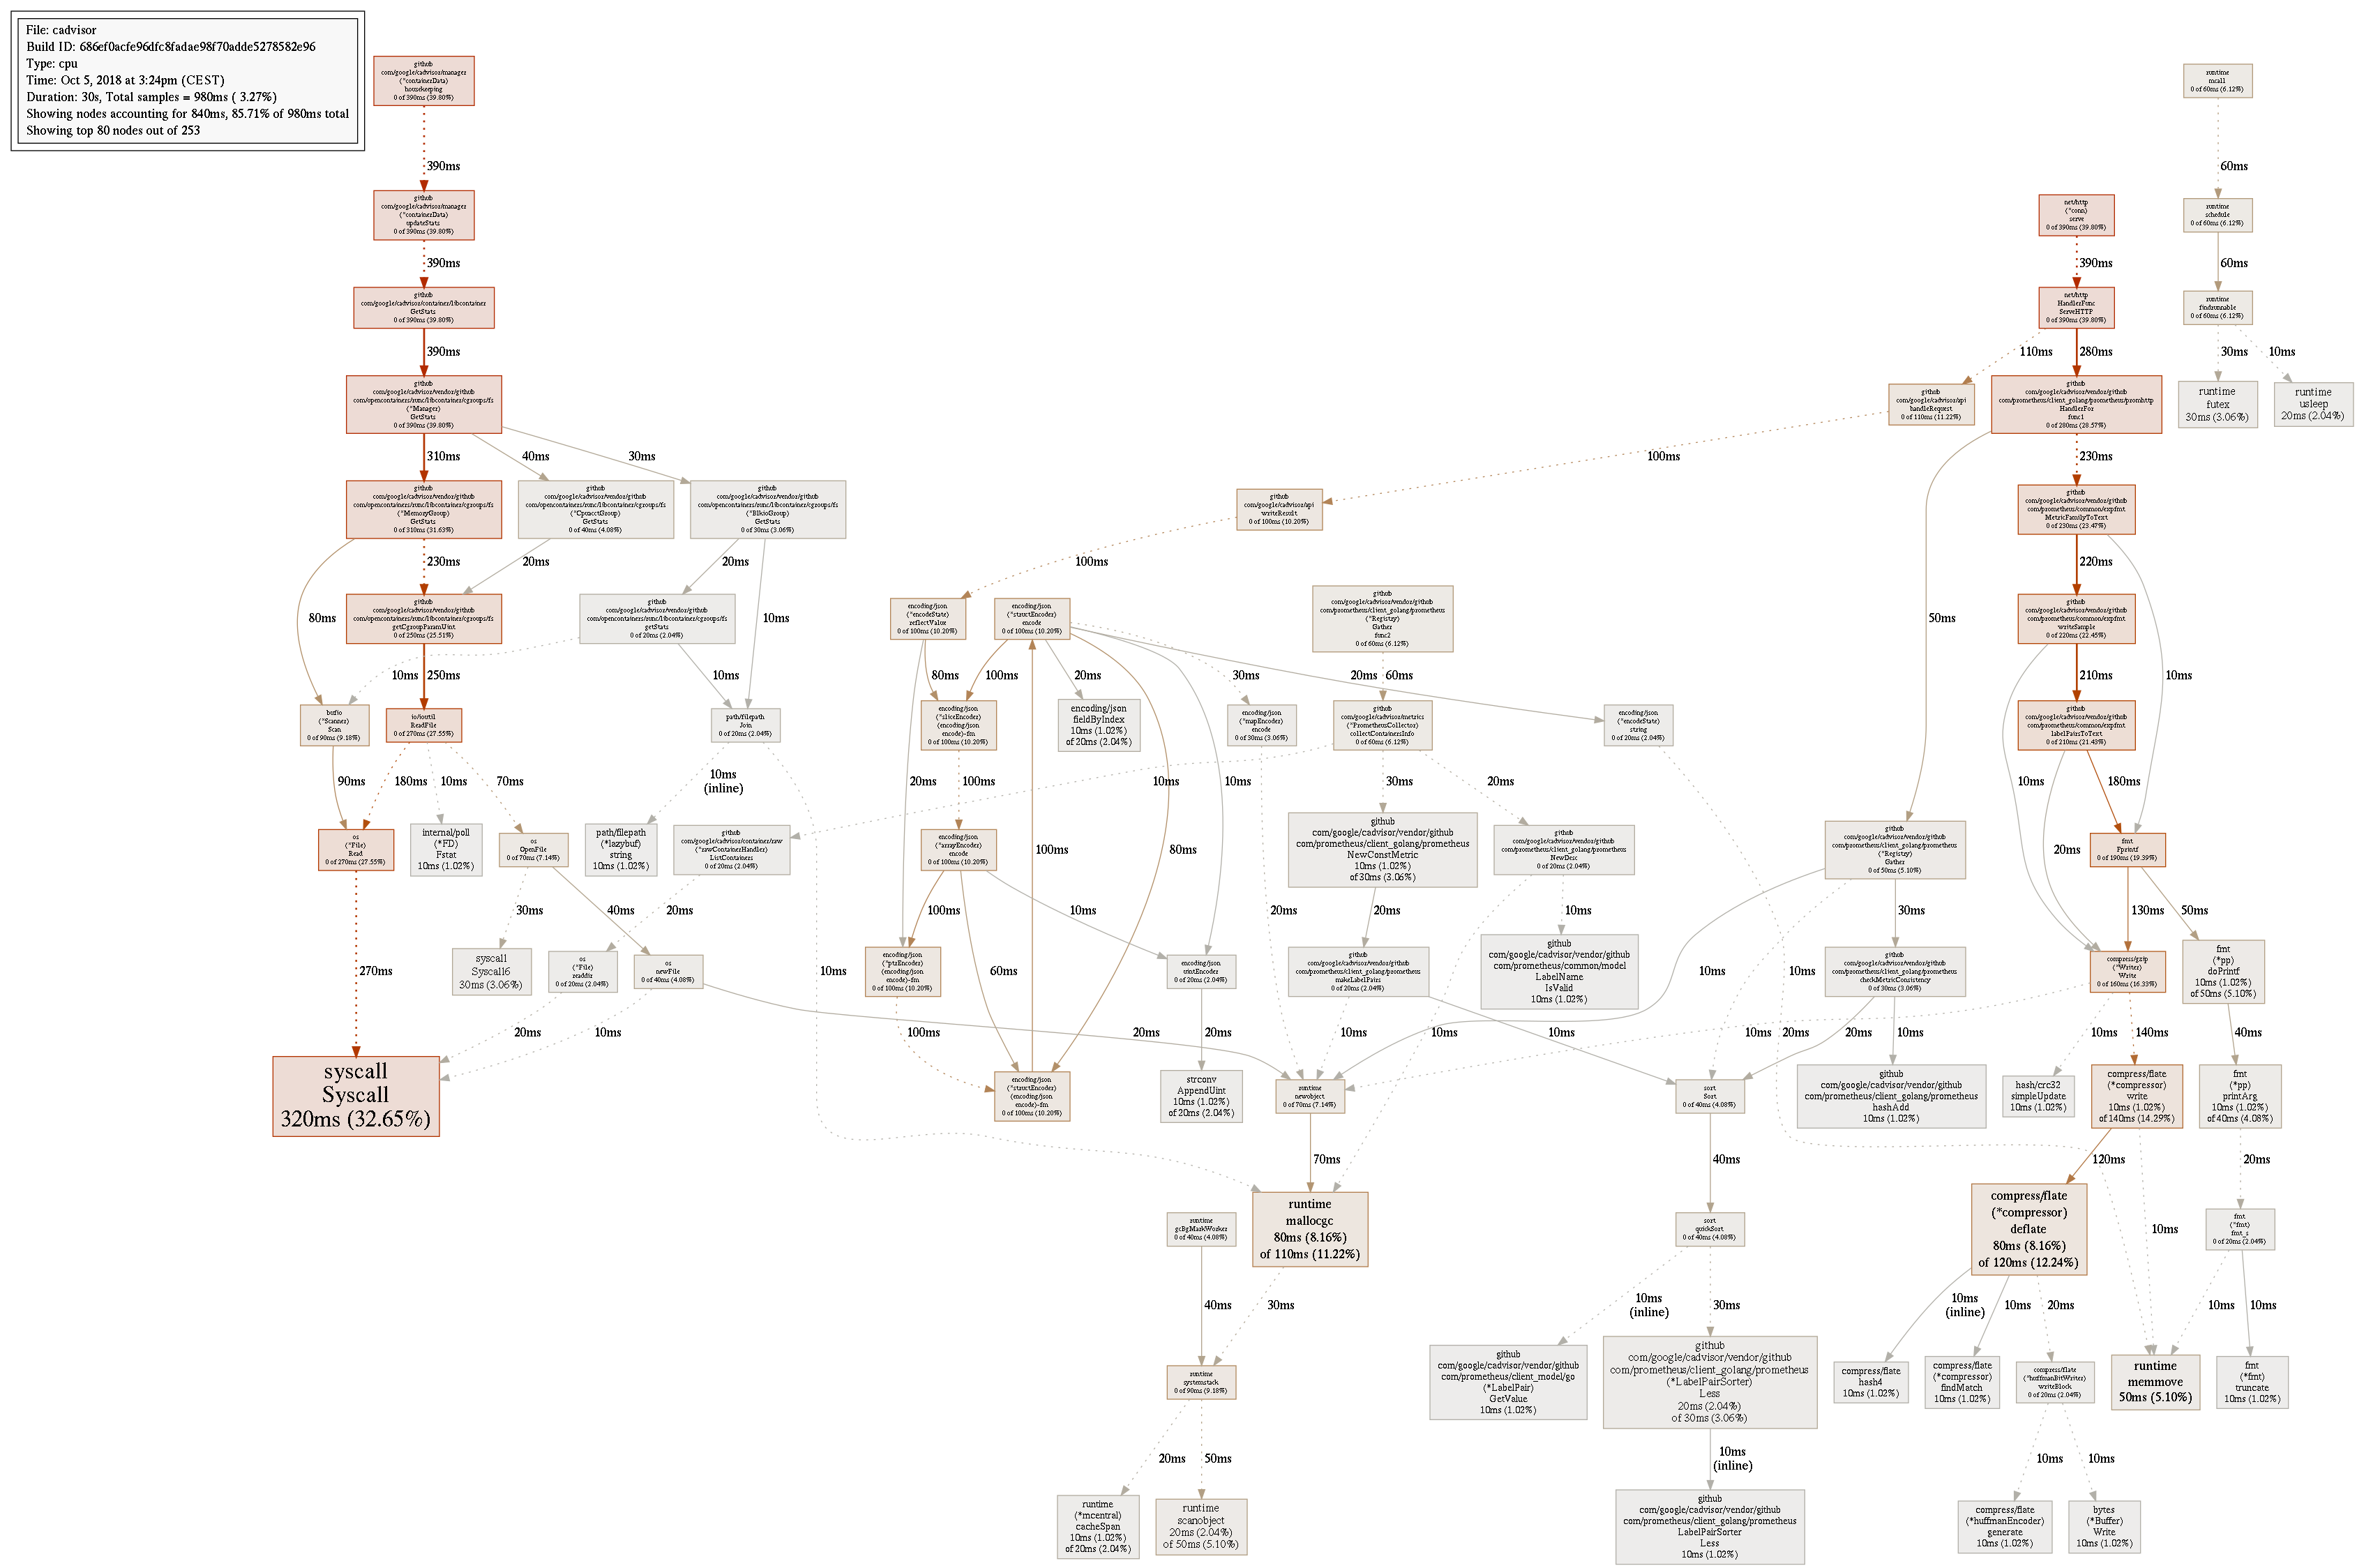
The go tool pprof command does not work anymore?
$ docker run -it --rm --network=services_default golang
root@81cf2b509b15:/go# go tool pprof -png -output=out.png http://cadvisor:8080/debug/pprof/profile
Fetching profile over HTTP from http://cadvisor:8080/debug/pprof/profile
http://cadvisor:8080/debug/pprof/profile: parsing profile: unrecognized profile format
failed to fetch any source profiles
root@81cf2b509b15:/go#
Anyways, I have 10 containers running on a 6 vCPU host and this is the total CPU core usage for the cadvisor container:
 hholst80
on 14 Jun 2019
hholst80
on 14 Jun 2019
Related issues
 krutsko
·
4Comments
krutsko
·
4Comments
 octete
·
6Comments
octete
·
6Comments
 ghost
·
5Comments
ghost
·
5Comments
 jlec
·
5Comments
jlec
·
5Comments
 GregoryKutuzov
·
3Comments
GregoryKutuzov
·
3Comments
Most helpful comment
@vishh any updates from Google on this issue?
In the Grafana dashboard you can see I was restarting cadvisor once, then it starts eating all CPU/RAM again:
4.15v0.28.3 (1e567c2)18.03.1-cewithoverlay2atext4.