Cadvisor: containers using MADV_FREE do not see their memory usage decrease
I've a bunch of containers running Thanos (a golang app which proxy prometheus queries).
The latest version of Thanos has been compiled with go 1.12 which use MADV_FREE to release memory back to the system instead of MADV_DONTNEED in go 1.11.
Unfortunately it seems that cadvisor does not see the memory being released with MADV_FREE.
Here a graph showing container_memory_usage_bytes after switching back to MADV_DONTNEED instead of MADV_FREE using GODEBUG=madvdontneed=1.

I don't know if cadvisor can do something about it though.
 sylr
sylr
All 7 comments
Related change for Golang: https://github.com/golang/go/issues/23687 but did not have a chance to dive into what this option does / what's expected. The effect is quite scary though.
 bwplotka
on 15 May 2019
bwplotka
on 15 May 2019
https://github.com/prometheus/prometheus/issues/5524 seems like Go 1.12.5 has this fixed
bwplotka
on 15 May 2019
I don't think cAdvisor can do anything here. cAdvisor just reports the value from cgroup files. This is either a golang issue, as suggested by @bwplotka above, or a kernel issue.
 dashpole
on 15 May 2019
dashpole
on 15 May 2019
Actually there is a fix. Use See update below, my understaning of WSS was obviously wrong.container_memory_working_set_bytes metric instead (:
cc @sylr
bwplotka
on 30 May 2019
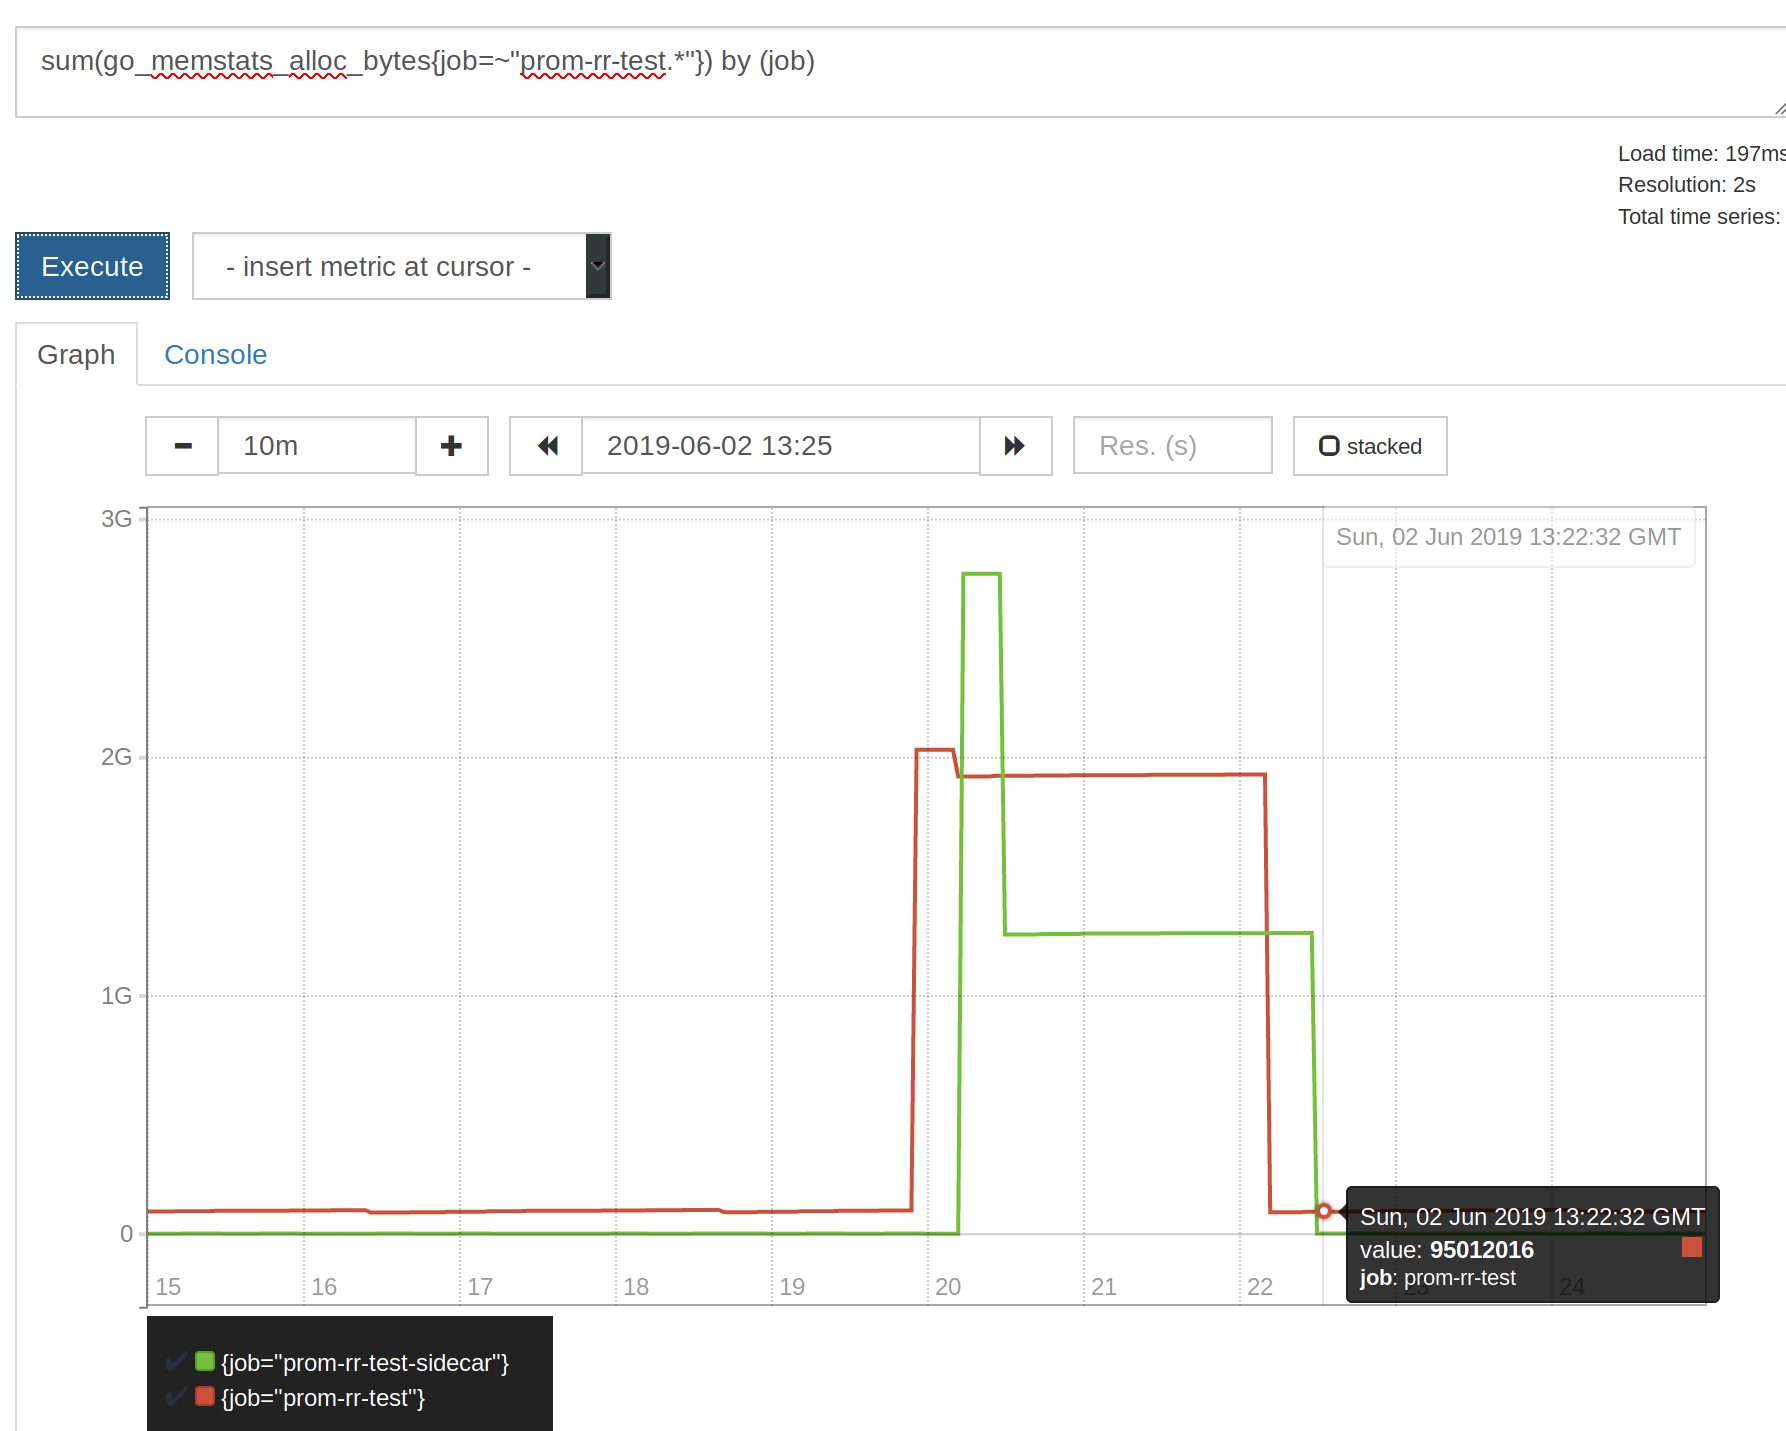
After couple of tests I am no longer sure if we can rely on container_memory_working_set_bytes as "memory saturation of the container" metric. There are many people that uses this as a reference in alerts etc but I can see some weird results:
Actual allocated memory on the heap of 2 Golang processes in each container:
container_memory_working_set_bytes is showing magic numbers:

For fun (because this is misleading, but works as expected) container_memory_usage_bytes:

Wonder if my signals are weird (heap being larger than WSS) due to some different scrape internal etc so some spike being missed.
cc @sylr @gouthamve
bwplotka
on 2 Jun 2019
@bwplotka I wouldn't trust go_memstats_... as I find it particularly hard to understand what they really represent (see: https://github.com/golang/go/issues/32284).
sylr
on 3 Jun 2019
Wrote a post about this in details here: https://bwplotka.dev/2019/golang-memory-monitoring/
bwplotka
on 9 Jun 2019
Related issues
 jmirc
·
6Comments
jmirc
·
6Comments
 NichUK
·
5Comments
NichUK
·
5Comments
 arjun-dandagi
·
4Comments
arjun-dandagi
·
4Comments
 vivekj11
·
4Comments
dashpole
·
7Comments
vivekj11
·
4Comments
dashpole
·
7Comments
Most helpful comment
Wrote a post about this in details here: https://bwplotka.dev/2019/golang-memory-monitoring/