Cadvisor: Cadvisor exposes redundant Prometheus metrics with different labels
I scraped metrics from Cadvisor with the following scrape job:
- job_name: kubernetes-cadvisor
  scrape_interval: 30s
  scrape_timeout: 10s
  metrics_path: /metrics
  scheme: https
  kubernetes_sd_configs:
  - api_server: null
    role: node
    namespaces:
      names: []
  bearer_token_file: /var/run/secrets/kubernetes.io/serviceaccount/token
  tls_config:
    ca_file: /var/run/secrets/kubernetes.io/serviceaccount/ca.crt
    insecure_skip_verify: false
  relabel_configs:
  - separator: ;
    regex: __meta_kubernetes_node_label_(.+)
    replacement: $1
    action: labelmap
  - separator: ;
    regex: (.*)
    target_label: __address__
    replacement: kubernetes.default.svc:443
    action: replace
  - source_labels: [__meta_kubernetes_node_name]
    separator: ;
    regex: (.+)
    target_label: __metrics_path__
    replacement: /api/v1/nodes/${1}/proxy/metrics/cadvisor
    action: replace
As i monitored e.g. the metric container_cpu_usage_seconds_total with the Query: _container_cpu_usage_seconds_total{pod_name="your-pod-name"}_ on the UI, i recognized two redundant results.
The difference between the two redundant metrics are only the labels.
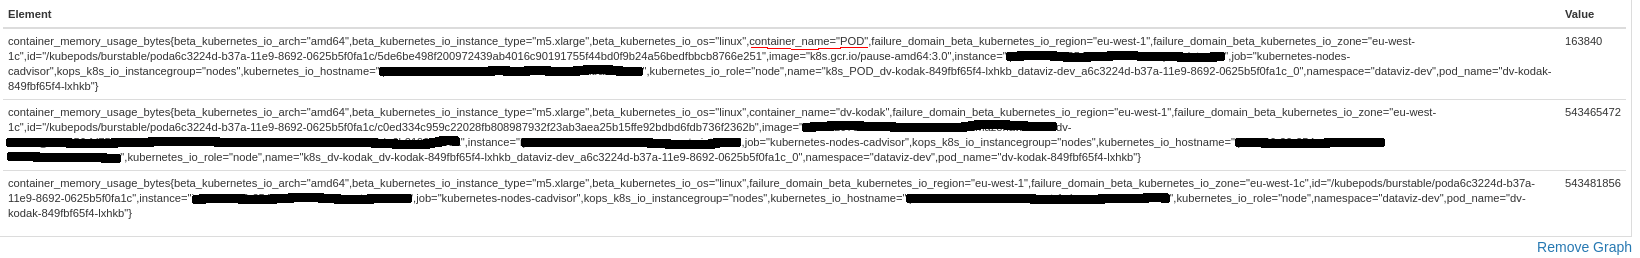
The "id" in the first metric is longer than in the second one. In addition to that, the second metric has no "container_name", "image" and "name" label.
The float values of the two versions have a minimal deviation. In my opinion, this is caused by the different scrape times (one metrics gets scraped milliseconds before the other).
Does anybody know, why there are exposed two redundant metrics? Or is it still a bug?
 tiwalter
All 11 comments
can you post the duplicate metrics?
 dashpole
on 10 Nov 2018
dashpole
on 10 Nov 2018
Sure.

The orange-rimmed id's are different in length (the one above is longer). The green-rimmed metrics are only existent in the first metric.
As mentioned, the float values have a minimal deviation (maybe caused by the different scrape times).
tiwalter
on 12 Nov 2018
Ah, you have found metrics for the pod's cgroup as well. The top one is container metrics, and the bottom is pod metrics.
dashpole
on 13 Nov 2018
Thanks @dashpole.
Is there an opportunity to deactivate exposing the metrics from the pod's cgroup?
tiwalter
on 14 Nov 2018
Since you are using the cAdvisor embedded in kubernetes, no. But you can always filter for a metric that has a non-empty container name.
dashpole
on 16 Nov 2018
Hi @dashpole , does cadvisor always expose pod cgroup metrics? I recently found these metrics in my v1.12.3 k8s cluster. But I haven't seen them with v1.10.x k8s or older.
 caitong93
on 12 Dec 2018
caitong93
on 12 Dec 2018
cAdvisor exposes metrics for all cgroups on the node, so the pod cgroup metrics should exist in all versions of cAdvisor.
dashpole
on 12 Dec 2018
But I'm pretty sure the metrics I got from kubelet cadvisor endpoint, didn't contain pod cgroup metrics. Maybe due to kubelet code change? I will look deeper when I got time.
And hi @tiwalter , what's the version of k8s you are using?
caitong93
on 14 Dec 2018
Hi @caitong93,
i use Kubernetes v1.11
tiwalter
on 21 Dec 2018
This was added in https://github.com/kubernetes/kubernetes/pull/63406. This was a change made in the kubelet, rather than in cAdvisor.
dashpole
on 26 Mar 2019
I also have the same pb but in triple ! To get the right value I needed to add this filter :
container_memory_usage_bytes{container_name!="POD", container_name!=""}
Because just filtering to get metrics that has a non-empty container name was not enough. I still have lines with container_name="POD"
 cabrinoob
on 31 Jul 2019
cabrinoob
on 31 Jul 2019
Related issues
 cheneypan
·
4Comments
cheneypan
·
4Comments
 rikatz
·
5Comments
rikatz
·
5Comments
 sylr
·
7Comments
sylr
·
7Comments
 vivekj11
·
4Comments
vivekj11
·
4Comments
 octete
·
6Comments
octete
·
6Comments
Most helpful comment
I also have the same pb but in triple ! To get the right value I needed to add this filter :
Because just filtering to get metrics that has a non-empty container name was not enough. I still have lines with
container_name="POD"