1. What version of Caddy are you using (caddy -version)?
0.11.0
2. What are you trying to do?
Use caddy as a reverse proxy in a production environment inside of a docker container
3. What is your entire Caddyfile?
http://somestats.somedomain.com {
  redir https://somedomain.com{uri}
}
https://somestats.somedomain.com {
  prometheus 0.0.0.0:9180
  gzip
  realip cloudflare
  tls /etc/caddy/certs/somedomain.com.crt /etc/caddy/certs/somedomain.com.key {
    protocols tls1.0 tls1.2
  }
  basicauth / someuser somepass
  proxy / 127.0.0.1:9180 {
    websocket
    max_conns 2000
    header_upstream Host {host}
    header_upstream X-Real-IP {remote}
    header_upstream X-Forwarded-For {remote}
    header_upstream X-Forwarded-Proto {scheme}
  }
}
http://somevhost.somedomain.com {
  redir https://somevhost.somedomain.com{uri}
}
https://somevhost.somedomain.com {
  prometheus 0.0.0.0:9180
  gzip
  realip cloudflare
  tls /etc/caddy/certs/somedomain.com.crt /etc/caddy/certs/somadomain.com.key {
    protocols tls1.0 tls1.2
  }
  basicauth / someuser somepass
    proxy / 172.17.0.2:1234 {
    websocket
    max_conns 2000
    header_upstream Host {host}
    header_upstream X-Real-IP {remote}
    header_upstream X-Forwarded-For {remote}
    header_upstream X-Forwarded-Proto {scheme}
  }
}
http://someothervhost.somedomain.com {
  redir https://someothervhost.somedomain.com{uri}
}
https://someothervhost.somedomain.com {
  prometheus 0.0.0.0:9180
  gzip
  realip cloudflare
  tls /etc/caddy/certs/somedomain.com.crt /etc/caddy/certs/somedomain.com.key {
    protocols tls1.0 tls1.2
  }
  proxy / 172.17.0.6:80 {
    websocket
    max_conns 2000
    header_upstream Host {host}
    header_upstream X-Real-IP {remote}
    header_upstream X-Forwarded-For {remote}
    header_upstream X-Forwarded-Proto {scheme}
  }
}
4. How did you run Caddy (give the full command and describe the execution environment)?
docker build --tag ourcompany/caddy:0.11.0 --build-arg plugins=realip,prometheus github.com/abiosoft/caddy-docker.git#0.11.0
docker run ourcompany/caddy:0.11.0 -quic -grace 5s --conf /etc/caddy/conf/caddy.conf --log stdout
5. Please paste any relevant HTTP request(s) here.
6. What did you expect to see?
Somewhat constant memory usage.
7. What did you see instead (give full error messages and/or log)?
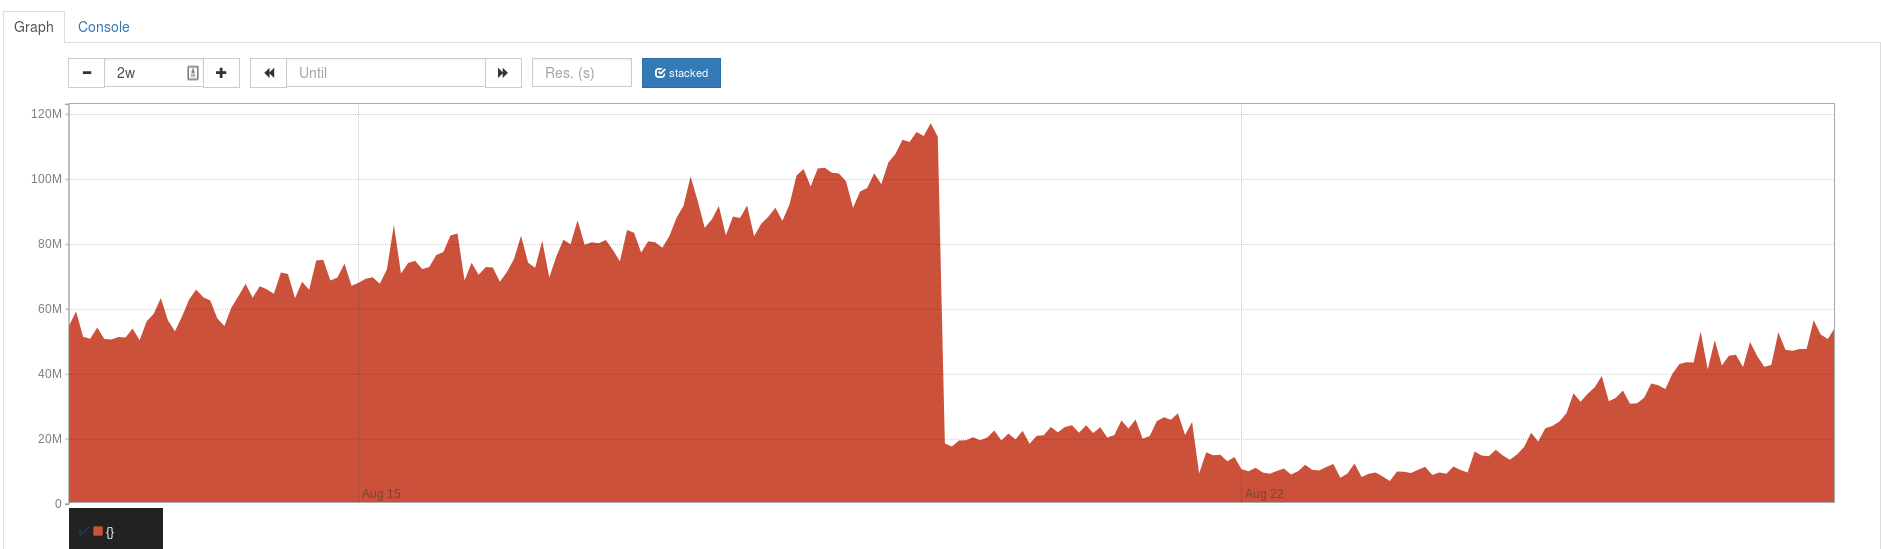
This is a prometheus chart of avg(go_memstats_alloc_bytes) from the Caddy prometheus endpoints of 11 servers. The cliff in the middle of the chart is us replacing caddy 0.10.11 with 0.11.0 on these servers. To the right we see the memory usage creeping up again which is what we are hoping to avoid.
When caddy's memory usage is high it prevents other parts of our infrastructure from running effectively and also tends to cause failure when we try to stop or restart our caddy container.
8. How can someone who is starting from scratch reproduce the bug as minimally as possible?
We are not aware of how to reproduce this leak. We tried lots of requests via ApacheBench on a non-production server of ours to try to recreate the leak, but could not reproduce it. ~We have a suspicion without any testing or proof that QUIC may be involved.~ We also tested making lots of requests with QUIC.
 sharph
All 7 comments
Can you enable the pprof and expvar directives and then link us to the debug pages so we can look at the heap profile and stack traces?
 mholt
on 27 Aug 2018
mholt
on 27 Aug 2018
I'll look into enabling those directives and get back to you.
sharph
on 27 Aug 2018
threadcreate.txt
heap.txt
goroutine.txt
vars.txt
I pulled these off a server with a go_memstats_alloc_bytes metric of 204862320.
sharph
on 28 Aug 2018
Those links seems broken unfortunately
 francislavoie
on 28 Aug 2018
francislavoie
on 28 Aug 2018
Sorry about that! Just re-uploaded in the correct repo and edited my comment.
sharph
on 28 Aug 2018
Problem was solved on our end by setting the read, write, and header timeout values to a big-ish value (3h).
sharph
on 10 Sep 2018
Thanks for reporting back. I was gonna say, after finally having a quick chance to skim over the dumps, that it looked like you just had a LOT of requests open. Probably some (unintentional?) slow-lorising going on or something. Glad you figured it out.
mholt
on 10 Sep 2018
Related issues
 PhilmacFLy
·
3Comments
PhilmacFLy
·
3Comments
 xfzka
·
3Comments
mholt
·
3Comments
xfzka
·
3Comments
mholt
·
3Comments
 whs
·
3Comments
whs
·
3Comments
 mikolysz
·
3Comments
mikolysz
·
3Comments