Cache: Networking issues impacting cache save/restore
Since we've received a number of issues related to network issues impacting save/restore, I'm creating a "catch all" issue to track the investigation and mitigation.
Related Issues
https://github.com/actions/cache/issues/265 https://github.com/actions/cache/issues/259 https://github.com/actions/cache/issues/207 https://github.com/actions/cache/issues/200 https://github.com/actions/cache/issues/189
Diagnostics
The figure below shows the max server latency from our cloud storage provider for one of the storage accounts (the cache service uses 16 total, but all show similar trends). There's a clear increase in high latency requests the past two weeks or so.
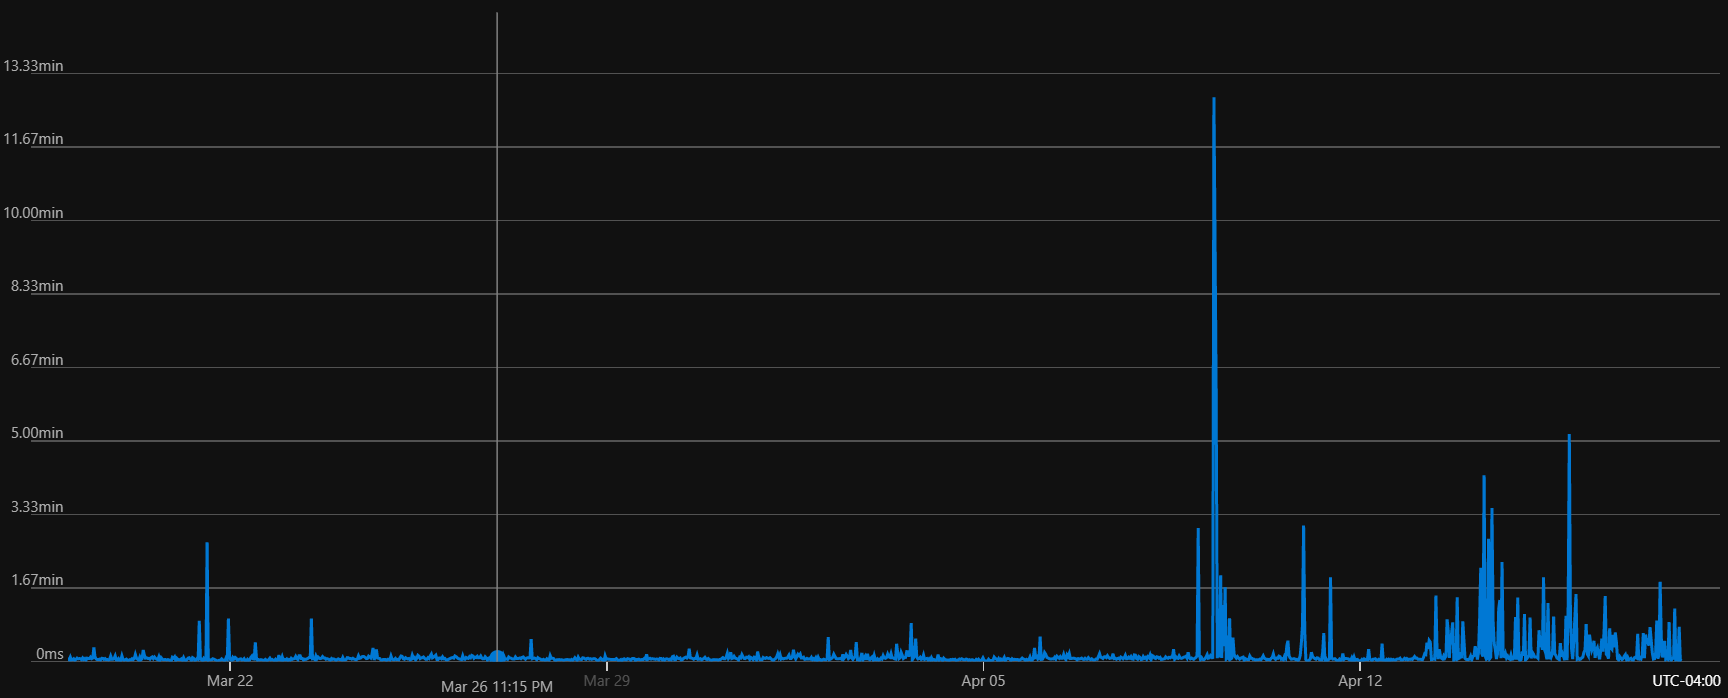
I've escalated with our provider and they have started an investigation. I'll update here as we know more.
 dhadka
All 55 comments
Following here (from #265). Would be great if at least network failure was detected probably (during restore) and either the action failing or at least leaving disk empty, instead of a half restored and corrupted state on disk, that for us breaks following steps.
 pjoe
on 21 Apr 2020
pjoe
on 21 Apr 2020
Is there a way to set a timeout for cache restore?
In current situation we are burning build minutes just waiting for cache restore that eventually times out and leaves corrupted cache on disk :(
pjoe
on 21 Apr 2020
We're seeing this as well, restoring ~300mb of ruby gems with unpredictable delays.
I've seen as fast as 9s (seconds), average of 15-20s, and hundreds of highs of 40s, 50s, 3m20s, 5m, using [email protected] (and other vanilla cache tags) we have ran ~10,000 cache pulls.
I've tested switching to zstd compression, and while the compression and unpackaging is faster, we are still seeing slow retrieval swings, as high as 50 second retrieval in the ~400 tests I ran with zstd.
cc @chrispat
 everops-alex
on 22 Apr 2020
everops-alex
on 22 Apr 2020
@pjoe I've yet to try this, but the docs say you can set a step timeout that will kill the process if the step exceeds that limit. Note, however, that this will cause the step to fail. What we really need is a cache-specific timeout that will abort the restore but allow the workflow to continue, treating it like a cache miss.
I've also been exploring socket timeouts. Here is an example of it aborting a slow download.
dhadka
on 23 Apr 2020
@dhadka you can set continue-on-error on the step and then use the new outcome on the steps context https://help.github.com/en/actions/reference/context-and-expression-syntax-for-github-actions#steps-context to condition other steps.
 chrispat
on 23 Apr 2020
chrispat
on 23 Apr 2020
Thanks for the replies to this issue -- unfortunately something like continue-on-error (while we use it elsewhere in our build) and any logic to skip on timeout are not sufficient, as this would result in a 2-3 minute bundle install _instead of_ the 10s-5m cache pull/unzip.
I agree that just running bundle install on every iteration is more predicatable, but we are seeing a lot of successful cache pull's at sub-20 seconds and I cannot justify aborting a long pull to reinstall the entire gem bundle.
For us, this would only work if we set our timeout to 2 minutes -- but then we are still having jobs wait 2 minutes to pull cache to then abort and spend 2-3 more minute installing the bundle cache.
everops-alex
on 23 Apr 2020
After playing more w/ caching, it's becoming evident that the issues we are seeing are related to data retrieval.
everops-alex
on 24 Apr 2020
Here issue that was fixed and looks very similar actions/setup-node/issues/116
 munsocket
on 24 Apr 2020
munsocket
on 24 Apr 2020
I'm getting around this currently by baking my bundle cache into a docker image with the GA self-hosted runner as the entrypoint. 👍
everops-alex
on 24 Apr 2020
@munrocket Yes, that's part of the issue. We're using the same http-client. I already have a PR to validate the file length (https://github.com/actions/cache/pull/269) but am also testing out the approach used by https://github.com/actions/setup-node/issues/116 to detect errors (using util.promisify(stream.pipeline)).
dhadka
on 27 Apr 2020
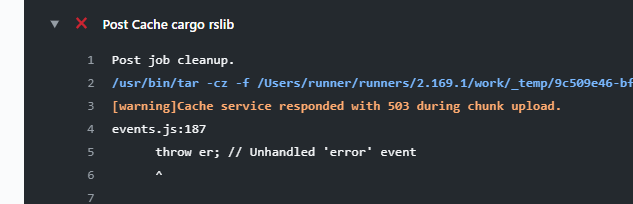
I am getting this error:
[warning]Cache service responded with 500 during chunk upload.
events.js:187
throw er; // Unhandled 'error' event
^
Error: EBADF: bad file descriptor, read
Emitted 'error' event on ReadStream instance at:
at internal/fs/streams.js:167:12
at FSReqCallback.wrapper [as oncomplete] (fs.js:470:5) {
errno: -9,
code: 'EBADF',
syscall: 'read'
}
 JavierMeep
on 28 Apr 2020
JavierMeep
on 28 Apr 2020
@JavierMeep but nothing changed. Show link to your GA please.
munsocket
on 28 Apr 2020
@munrocket sorry it is in a private repo.
JavierMeep
on 28 Apr 2020
Also getting the same 500 error semi-regularly today when attempting to save caches. Project is also in a private repo.
Here's the error message:
[warning]Cache service responded with 500 during chunk upload.
events.js:187
throw er; // Unhandled 'error' event
^
Error: EBADF: bad file descriptor, read
Emitted 'error' event on ReadStream instance at:
at internal/fs/streams.js:167:12
at FSReqCallback.wrapper [as oncomplete] (fs.js:470:5) {
errno: -9,
code: 'EBADF',
syscall: 'read'
}
 wlabatey
on 28 Apr 2020
wlabatey
on 28 Apr 2020
@wlabatey @JavierMeep These started after an OS upgrade, so we are rolling back to the old OS version. Expect to mitigate in ~1 hr.
dhadka
on 28 Apr 2020
@dhadka Thanks for the info!
wlabatey
on 28 Apr 2020
can't delete this comment, but my question isn't relevant anymore, thanks!
 looshlee
on 28 Apr 2020
looshlee
on 28 Apr 2020
Getting this quite often:
[command]/bin/tar -xz -f /home/runner/work/_temp/1da182f3-adc2-4f69-ad6a-526a657bb34e/cache.tgz -C /home/runner/work/brightfunds/brightfunds/vendor/bundle
gzip: stdin: unexpected end of file
/bin/tar: Unexpected EOF in archive
/bin/tar: Unexpected EOF in archive
/bin/tar: Error is not recoverable: exiting now
[warning]Tar failed with error: The process '/bin/tar' failed with exit code 2
Then the subsequent bundle install fails because the cache is partially restored.
 scottjacobsen
on 30 Apr 2020
scottjacobsen
on 30 Apr 2020
When tar fails like in my prior comment is the cache-hit set to false? In that case I could add a step that does a rm -rf on the vendor/bundle directory so the subsequent bundle install is installing into a clean directory.
scottjacobsen
on 30 Apr 2020
Getting this too. This is affecting our workflow a lot.
Renovate bot opens PRs to update deps. It automerges when tests pass. But the tests fail _a lot_ with this and all of the PRs then need to be manually merged.
 moltar
on 1 May 2020
moltar
on 1 May 2020
I am also getting it with Mac OS: https://github.com/ankitects/anki/pull/584 - https://github.com/ankitects/anki/pull/584/checks?check_run_id=639592894#step:56:3
This is a quite frequent and useless issue with Mac OS. If it does not have internet connection/whatever error, it should not fail my build by any means other than making us waist time looking at why the build failed.
 evandrocoan
on 3 May 2020
evandrocoan
on 3 May 2020
Another big issue is that re-running all of these jobs creates extra usage, which is metered and now the costs are going up. And as @evandrocoan pointed out, the majority, if not all, of the failures are on macOS, which is metered at a multiple.
And there is no way to re-run only the failed jobs, and you have to re-run ALL of the them.
When using a matrix of 3 node versions x 3 OSes, that's 9 jobs that need to be re-run, because only one had failed.
moltar
on 3 May 2020
I think everyone who suffered from this should be getting free credits for actions.
moltar
on 3 May 2020
When the
cache-hitset tofalseI could add a step that does arm -rf?
@scottjacobsen interesting question
munsocket
on 3 May 2020
When
tarfails like in my prior comment is thecache-hitset tofalse? In that case I could add a step that does arm -rfon thevendor/bundledirectory so the subsequentbundle installis installing into a clean directory.
That the best option. Partially restoring the cache just makes the build fail because most important files are usually missing.
evandrocoan
on 4 May 2020
I think an atomic option would be useful - where the tar file is extracted to a /tmp directory, and then just moved into place with mv, only if the tar command returns success. This way you couldn't end up with a partially restored cache, and you wouldn't need to try and detect failures in the subsequent steps. It would need to be optional as I'm sure there are some workflows where the target directory is not empty and you need to untar in place. In that case the atomic option would not apply. But I bet for the majority of workflows it would be the right option.
scottjacobsen
on 5 May 2020
Atomic ftw. I would even make it default. Not really sure what cases would break from this being on. Moving recursively from /tmp to destination shouldn't really be different from untar'ing in place, or am I missing something?
pjoe
on 6 May 2020
@pjoe, I see a few times the untar operation on the GitHub Actions machines to fail mysterious in the middle of process and only half of the files to be unpacked, leaving my working tree in an inconsistent state, leading the tests to fail.
evandrocoan
on 6 May 2020
Exactly ... same thing we are seeing. So if it instead untar'ed to /tmp before moving to destination and properly detected a failure, then the destination would be in a consistent state (either no cache restored or full cache restored) when continuing to the next step.
pjoe
on 6 May 2020
@pjoe A recursive move is not atomic as it could fail after having only moved a subset of files. Moving a single directory should be atomic so long as the move is not across file systems, so I was thinking it should just mv the directory.
That being said, a recursive move on the same file system seems very unlikely to fail part way through, so maybe that would be sufficient, and cover the case where there are already some files in the destination directory. Good idea.
scottjacobsen
on 6 May 2020
@evandrocoan @scottjacobsen @wlabatey @JavierMeep We published a new v1 last week with reliability improvements. Have you noticed a decrease in flakiness?
dhadka
on 19 May 2020
I think the connection error has not happened this week, but yesterday I had a Mac OS build failing without any reason for a no valid error: https://github.com/evandroforks/anki/runs/687614069#step:51:1
##[error].github/workflows/checks.yml (Line: 227, Col: 16):
##[error]The template is not valid. .github/workflows/checks.yml (Line: 227, Col: 16): hashFiles('**/Cargo.toml') failed. Fail to hash files under directory '/Users/runner/runners/2.262.1/work/anki/anki'
No way my template was invalid. All other builds (linux/windows) passed fine.
This was not the first time a Mac OS build failed out of nowhere with that error.
evandrocoan
on 19 May 2020
@dhadka I haven't noticed any issues for a few days now. Seems good, thanks! :+1:
wlabatey
on 19 May 2020
@evandrocoan What you're seeing might be related to https://github.com/actions/runner/issues/449. If not, please file an issue against https://github.com/actions/runner, as that repo owns all of the built-in functions like hashFiles.
dhadka
on 19 May 2020
I still get this quite often:
Cache gems
2m 29s
Run actions/cache@v1
[warning]Premature close
And then a 5 minute bundle install since the cache didn't restore. On the plus side I haven't seen any partially restored caches in a while. This is better than that.
When the cache does restore it is pretty slow - over a minute:
Cache gems
1m 16s
Cache restored from
Run actions/cache@v1
Cache Size: ~1198 MB (1256000931 B)
/bin/tar -xz -f /home/runner/work/_temp/85ea2614-bb53-405d-b797-c253cbc376d1/cache.tgz -C /home/runner/work/brightfunds/brightfunds/vendor/bundle
Cache restored from key: gems-b8845a9d27f152d8d653d1c88b0b4cb62cd265445de35d03b0f7205e477154e7-451ada242064255be70875879d8aa9ef3965052ef251459fa79a91ded2026c64
We've been running our tests on SemaphoreCI as well, to compare reliability, etc with gh actions. On Semaphore the cache restore is usually around 30 or 40 seconds.
Edit -
I wonder if there is an issue with larger cache files. Our gem cache is 1198MB. I've noticed our node_modules cache never has issues and it is about 43 MB. Still, we are well under the 5GB limit.
scottjacobsen
on 19 May 2020
If you're interested in more timings I've been watching our 1GB gems cache restores. We are using the matrix feature to run 8 rspec jobs in parallel. Within one workflow run I've seen some of the jobs restore the cache in as little as 40 seconds, and some take over 3 minutes. Between one and two minutes is most common.
scottjacobsen
on 20 May 2020
@scottjacobsen I think what you're seeing is jobs running in different regions. When we stood up the cache service, all runners were on the EastUS. But they have expanded out to other regions, partly for resiliency to datacenter outages. From the telemetry, I calculate about 85% of jobs run in the EastUS today, the rest go to other datacenters in the US.
The issue though is the cache data is not co-located in those other regions, so transfer time increases. I ran some tests, and a 1 GB download within the EastUS takes ~43 seconds, whereas this increases to ~141 seconds when going to the WestUS. In your case, since you have 8 jobs per workflow, that means on average 1 of those jobs will fall outside of the EastUS.
dhadka
on 22 May 2020
Thanks @dhadka. That's good information. That cross country latency probably does explain most of the variability. Could that 100s of latency also be proportional to the file size? I've noticed our smaller caches tend not have such big swings in restore times, but I don't really have enough numbers to know for sure.
In the last few days I've seen a couple outliers, a 14 minute and 26 minute cache restore, so there must be other factors sometimes.
It looks like there are some good changes coming in V2 of the cache action - I especially like that multiple directories can be stored in a single file, so the restore cost only needs to be paid once.
scottjacobsen
on 22 May 2020
As an additional piece of data, I’ve been seeing the following restore times of Yarn’s cache directory on a macOS runner: 5m 0s, 2m 48s, 1m 15s, 44s, and 52s. All five runs were executed yesterday, on 26 May 2020. In every case, the exact same cache was restored (about 450 MB).
Is there a way to see where the runner of a specific job is located?
 sonicdoe
on 27 May 2020
sonicdoe
on 27 May 2020
@sonicdoe I don't think so, I didn't see anything in the runner debug logs that indicated the region. However, I can find out by looking at our telemetry if I know the user/org and repo name.
dhadka
on 27 May 2020
Thank you but that’s not necessary 🙂 I was just wondering if there’s an easy way for me (and others) to check whether there’s a correlation between run time and runner location.
sonicdoe
on 29 May 2020
Seeing several of both failed cache restores and very slow (15 minutes plus) cache restores today.
scottjacobsen
on 15 Jun 2020
Also want to jump in and say we experience the same thing, often with a warning like [warning]Premature close. I would rather that it just properly failed the step, so the following steps didn't even attempt to run.
It also seems to be not all that consistent. For each commit we currently run 10 jobs, after using the cache action to cache out dependencies ones in a single build. Usually it works pretty well, but it's not that unusual to see just 1 of these 10 different jobs fails.
 zlepper
on 18 Jun 2020
zlepper
on 18 Jun 2020
@zlepper Thanks for the report. We're wrapping up https://github.com/actions/toolkit/pull/497 which should help a lot. Once that PR gets merged, we'll need to bump the version of the toolkit used by the cache action.
Instead of treating the cache as one large file it downloads, this change will download the file in 4 MB chunks. This should help reduce restore speeds, since the chunks can be downloaded in parallel, and improve reliability, since each chunk can be retried independently. Also, since each chunk is a fixed size, we can set more aggressive timeouts to avoid slow/stalled downloads.
dhadka
on 18 Jun 2020
I just this new kind of random error which randomly breaks the build only for Mac OS: https://github.com/ankitects/anki/pull/604/checks?check_run_id=786490395#step:26:10
Run actions/upload-artifact@v1
Uploading artifact 'anki_macos_python3.7' from '/Users/runner/runners/2.263.0/work/anki/anki/dist' for run #2272
Uploading 3 files
Unable to copy file to server StatusCode=TooManyRequests: Too Many Requests. Source file path: /Users/runner/runners/2.263.0/work/anki/anki/dist/ankirspy-2.1.28+40eab4bd-cp37-cp37m-macosx_10_7_x86_64.whl. Target server path: anki_macos_python3.7/ankirspy-2.1.28+40eab4bd-cp37-cp37m-macosx_10_7_x86_64.whl
Cannot continue uploading files, so draining upload queue of 1 items.
Fail to upload '/Users/runner/runners/2.263.0/work/anki/anki/dist/ankirspy-2.1.28+40eab4bd-cp37-cp37m-macosx_10_7_x86_64.whl' due to 'Critical failure uploading '/Users/runner/runners/2.263.0/work/anki/anki/dist/ankirspy-2.1.28+40eab4bd-cp37-cp37m-macosx_10_7_x86_64.whl''.
GitHub.Runner.Plugins.Artifact.UploadFailedException: Critical failure uploading '/Users/runner/runners/2.263.0/work/anki/anki/dist/ankirspy-2.1.28+40eab4bd-cp37-cp37m-macosx_10_7_x86_64.whl'
at GitHub.Runner.Plugins.Artifact.FileContainerServer.UploadAsync(RunnerActionPluginExecutionContext context, Int32 uploaderId, CancellationToken token)
File error 'Critical failure uploading '/Users/runner/runners/2.263.0/work/anki/anki/dist/ankirspy-2.1.28+40eab4bd-cp37-cp37m-macosx_10_7_x86_64.whl'' when uploading file '/Users/runner/runners/2.263.0/work/anki/anki/dist/ankirspy-2.1.28+40eab4bd-cp37-cp37m-macosx_10_7_x86_64.whl'.
##[error]Too Many Requests
##[error]Exit code 1 returned from process: file name '/Users/runner/runners/2.263.0/bin/Runner.PluginHost', arguments 'action "GitHub.Runner.Plugins.Artifact.PublishArtifact, Runner.Plugins"'.
@evandrocoan Please file an issue against the toolkit repo, since they own the upload-artifacts action - https://github.com/actions/toolkit/tree/master/packages/artifact. However, based on the status code, it looks like some resource limit was exceeded and it should self mitigate. They'll be able to tell you the specifics as I'm not familiar with that action.
dhadka
on 19 Jun 2020
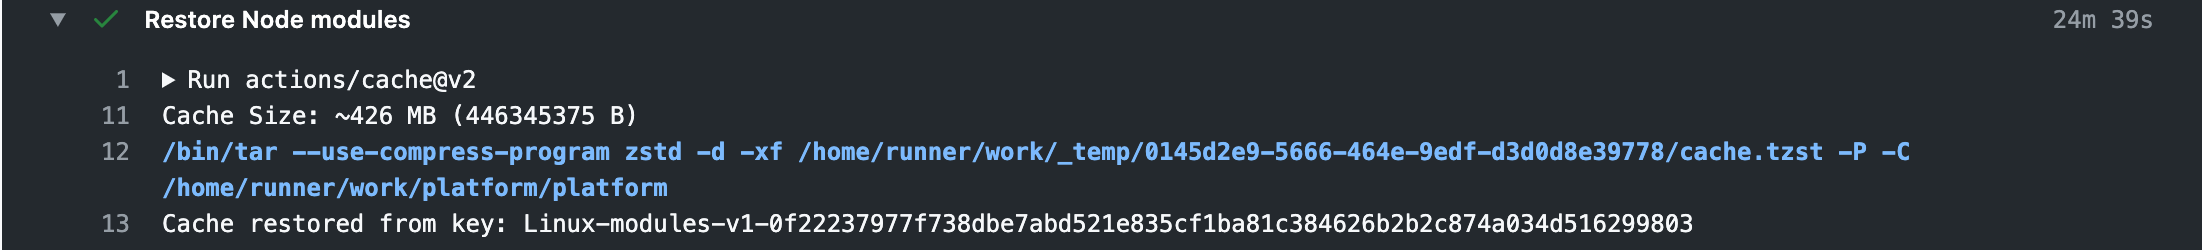
I'm also seeing the problem of the cache restores being very slow. It's ranging anywhere between a few seconds to 24 minutes as well as it just giving up after a period of time
When it goes bad:
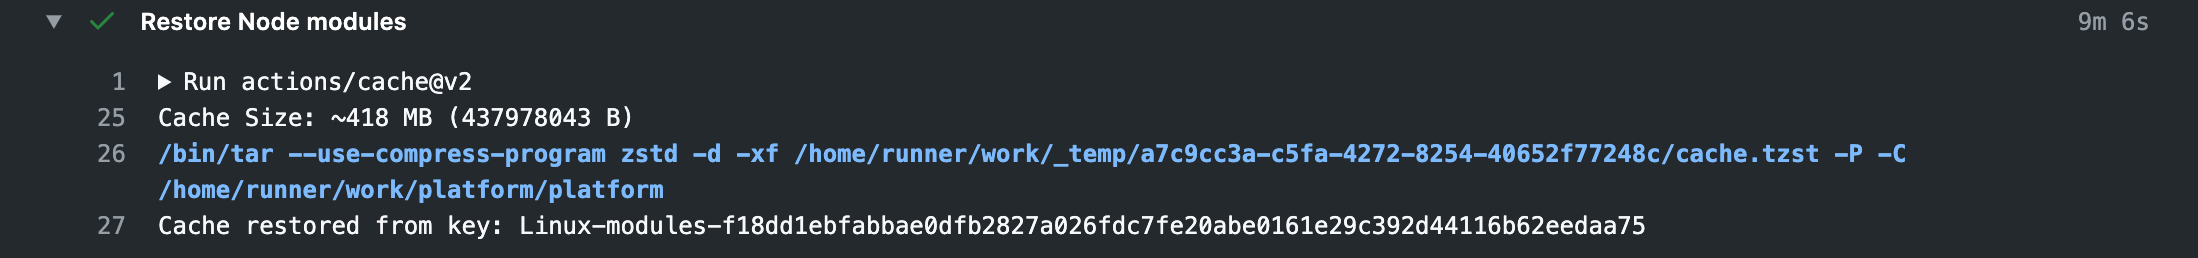

When it goes really bad:
When it goes well:
Workflow in question can be found here: https://github.com/motech-development/platform/blob/master/.github/workflows/checks.yml
Actions here: https://github.com/motech-development/platform/actions
 mogusbi
on 10 Jul 2020
mogusbi
on 10 Jul 2020
I hope v3 fixes the speed issues, but it is at the point where GH should remove the recommendation to use this action to "speed up workflows" from their main documentation, or at least put a prominent warning. We've removed caching from our workflows because at best caching saves 5 minutes per job (45 compute total minutes per workflow, that we pay for), and frequently just costs much much more than that.
scottjacobsen
on 13 Jul 2020
I agree with @scottjacobsen here.
I also think GH should provide free credits to everyone who was using this action.
moltar
on 14 Jul 2020
Here's the quick and dirty S3 caching I'm using for now - thought I would share. It doesn't have any bells or whistles, but It has been working well for us, with a 1GB gem cache that changes infrequently. It downloads and extracts in about 40 seconds each time. https://gist.github.com/scottjacobsen/ef7ccdf0ef48080a63e2fd4076d4e83f
scottjacobsen
on 15 Jul 2020
Here's the quick and dirty S3 caching I'm using for now - thought I would share. It doesn't have any bells or whistles, but It has been working well for us, with a 1GB gem cache that changes infrequently. It downloads and extracts in about 40 seconds each time. https://gist.github.com/scottjacobsen/ef7ccdf0ef48080a63e2fd4076d4e83f
Nice! Thank you for sharing.
Wonder if that would speed up if you were to use azure.
I think actions run on azure.
Getting it in the same region would probably get it even faster.
moltar
on 15 Jul 2020
FWIW I saw something similar the past couple of days, with cache downloading for a ~300 MB cache taking around 5 minutes (example run).
As a workaround, it'd be great if I could specify a timeout for cache downloading - something like "please skip the cache if it's still downloading after 15 seconds".
edit: Nevermind, this has been mentioned here before - sorry, should've skimmed through the existing replies first! :see_no_evil:
 The-Compiler
on 20 Jul 2020
The-Compiler
on 20 Jul 2020
We've released v2.1.0 of the cache action yesterday. If you're using actions/cache@v2, you will automatically use this latest version.
This switches from the http-client to the Azure Storage SDK for NodeJS for downloading the cache content. The http-client treated the file as one large stream, whereas the Storage SDK splits it into 4 MB chunks. In addition to being able to download the chunks in parallel, we set a 30 sec timeout on each chunk and include retries, which should hopefully restart any slow connections.
With this new version, you'll also see it print out download progress:
Received 0 of 1682754204 (0.0%), 0.0 MBs/sec
Received 92274688 of 1682754204 (5.5%), 44.0 MBs/sec
Received 218103808 of 1682754204 (13.0%), 69.3 MBs/sec
Received 335544320 of 1682754204 (19.9%), 80.0 MBs/sec
Received 461373440 of 1682754204 (27.4%), 88.0 MBs/sec
Received 583008256 of 1682754204 (34.6%), 92.6 MBs/sec
Received 675282944 of 1682754204 (40.1%), 91.9 MBs/sec
Received 775946240 of 1682754204 (46.1%), 92.4 MBs/sec
Received 868220928 of 1682754204 (51.6%), 91.9 MBs/sec
Received 964689920 of 1682754204 (57.3%), 91.9 MBs/sec
Received 1052770304 of 1682754204 (62.6%), 91.2 MBs/sec
Received 1124073472 of 1682754204 (66.8%), 89.2 MBs/sec
Received 1195376640 of 1682754204 (71.0%), 87.6 MBs/sec
Received 1262485504 of 1682754204 (75.0%), 85.9 MBs/sec
Received 1342177280 of 1682754204 (79.8%), 85.3 MBs/sec
Received 1413480448 of 1682754204 (84.0%), 84.2 MBs/sec
Received 1480589312 of 1682754204 (88.0%), 83.0 MBs/sec
Received 1547698176 of 1682754204 (92.0%), 81.9 MBs/sec
Received 1619001344 of 1682754204 (96.2%), 81.2 MBs/sec
Received 1678559900 of 1682754204 (99.8%), 80.0 MBs/sec
Received 1678559900 of 1682754204 (99.8%), 76.2 MBs/sec
Received 1682754204 of 1682754204 (100.0%), 51.1 MBs/sec
Cache Size: ~1605 MB (1682754204 B)
Closing since the v2.1.0 release should help with download issues, however, please feel free to re-open or create a new issue if download issues continue.
dhadka
on 27 Jul 2020
@dhadka
That's a gr8 improvement, but still not as fast as one would expect.
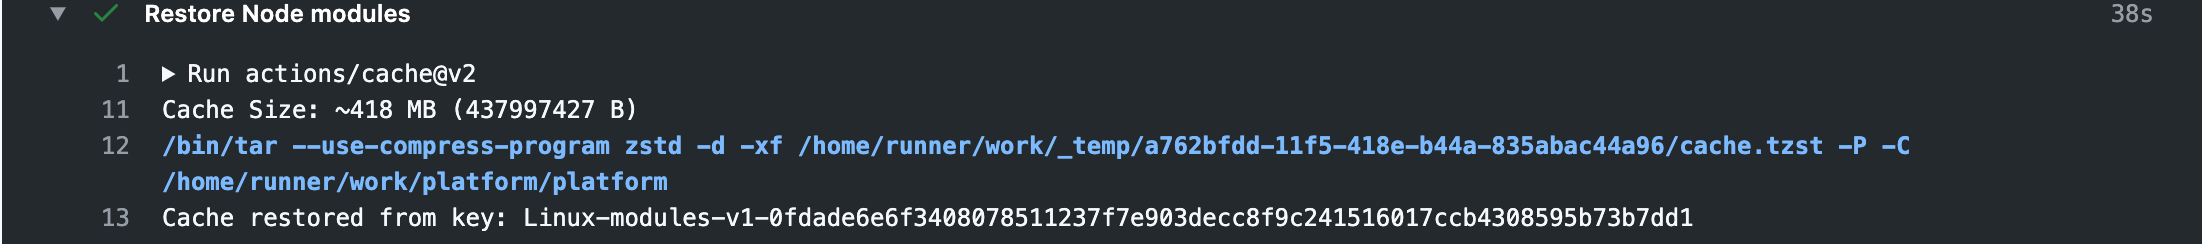
Download is fast now, however untarring the cache is still VERY slow.
It takes us whole 49s to untar only 850MB. (we cache python installation)
On my VM it takes only 15seconds using gzip which should be slower than zstd.
Is it possible that compression is mal-configured to a strict compression-level ? Is the disk super-duper slow on writing many files ?
Here is the log that show the decompression step takes 49s.
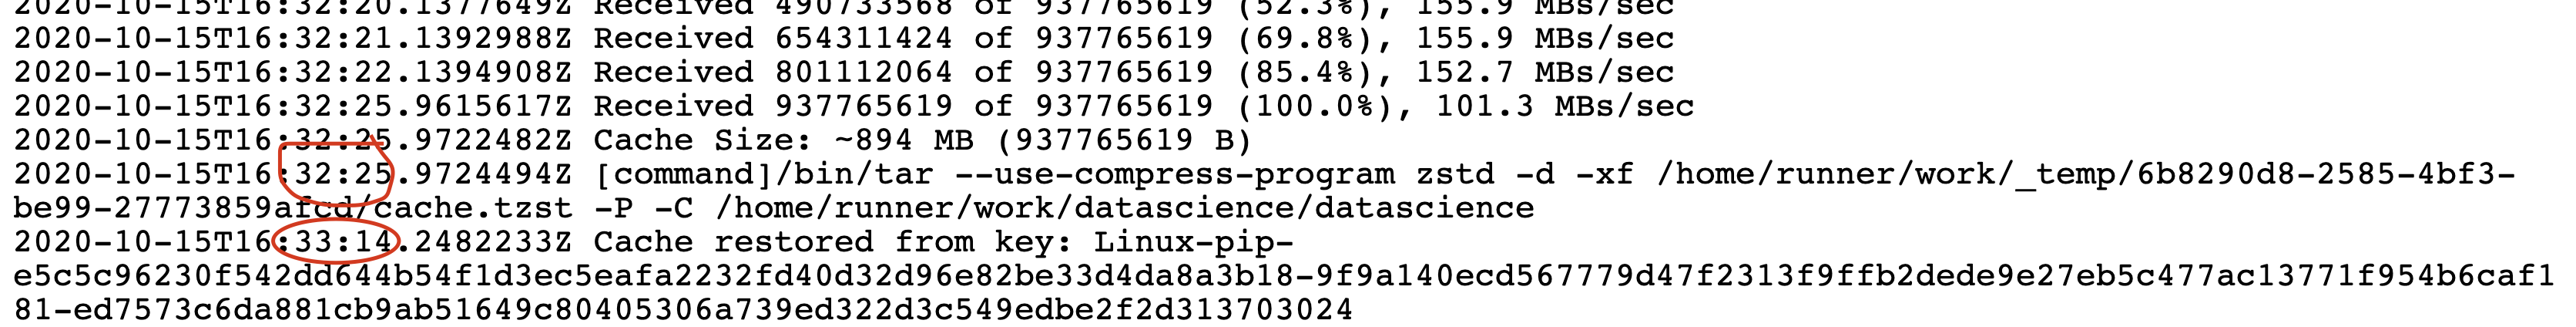
The decompression command that takes 49s is (copied from the logs above)
/bin/tar --use-compress-program zstd -d -xf /home/runner/work/_temp/6b8290d8-2585-4bf3-be99-27773859afcd/cache.tzst -P -C /home/runner/work/datascience/datascience
We use the approach explained below to cache the python installation directory
https://medium.com/ai2-blog/python-caching-in-github-actions-e9452698e98d
 shugybugy-assaf
on 16 Oct 2020
shugybugy-assaf
on 16 Oct 2020
Related issues
 binkley
·
4Comments
binkley
·
4Comments
 FacetGraph
·
3Comments
FacetGraph
·
3Comments
 jcornaz
·
4Comments
jcornaz
·
4Comments
 s-weigand
·
5Comments
s-weigand
·
5Comments
 Lyeeedar
·
5Comments
Lyeeedar
·
5Comments
Most helpful comment
We've released v2.1.0 of the cache action yesterday. If you're using
actions/cache@v2, you will automatically use this latest version.This switches from the
http-clientto the Azure Storage SDK for NodeJS for downloading the cache content. Thehttp-clienttreated the file as one large stream, whereas the Storage SDK splits it into 4 MB chunks. In addition to being able to download the chunks in parallel, we set a 30 sec timeout on each chunk and include retries, which should hopefully restart any slow connections.With this new version, you'll also see it print out download progress: