Hi, the Y range is just 0-5: so the graph renders automatically 2 things I don't need:
- fractionals values: 1.5, 2.5
- a negative -0.5 value
How can avoid those both?
 antonioaltamura
All 6 comments
I solved my problem of fractionals values with
tick: {
format: function(d) {
return d3.round(d); //this wil round the number (1.5 will be rounded to 1)
}
}
But you should try to use the format function d3.format("d")
More info here in the d3 formatting documentation
Greetings
 ayozebarrera
on 27 May 2015
ayozebarrera
on 27 May 2015
it works indeed with
tick: {
format: d3.format("d")
}
thanks
antonioaltamura
on 28 May 2015
yes, it works but it still shows the ticks for those floating values. So I think this option only hides label for the floating values:

How can I stop generating it? i.e not just hiding labels.
Here is the complete code which I'm using:
c3.generate({
    bindto: '#user-reg-linechart',
    data: {
        x: 'x',
        columns: [
            registrationDates,
            registrationCount
        ]
    },
    axis: {
        x: {
            type: 'timeseries',
            tick: {
                format: '%Y-%m-%d'
            }
        },
        y: {
            min: 0,
            tick: {
                format: d3.format('d')
            },
            padding: {top: 0, bottom: 0}
        }
    }
});
 parth-vora-7
on 1 Aug 2017
parth-vora-7
on 1 Aug 2017
@ParthVora777 Did you find your solution?
 Yaminn
on 15 Oct 2019
Yaminn
on 15 Oct 2019
I'm facing the same issue as @ParthVora777 pointed out. Does anyone have a solution?
 netooran
on 23 Dec 2019
netooran
on 23 Dec 2019
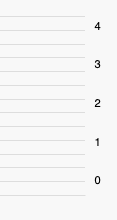
        tick: {
          // format: d3.format('d')
          format: function(d) {
            if (Math.floor(d) != d){
              return;
            }
            return d;
          }
        },
This turns my chart Y axis looks like:
Ref: https://stackoverflow.com/questions/12643591/how-to-limit-d3-svg-axis-to-integer-labels
 adong
on 10 Nov 2020
adong
on 10 Nov 2020
Related issues
 alantygel
·
3Comments
alantygel
·
3Comments
 udhaya2kmrv
·
3Comments
udhaya2kmrv
·
3Comments
 jstone-ponderosa
·
3Comments
jstone-ponderosa
·
3Comments
 DieterSpringer
·
4Comments
DieterSpringer
·
4Comments
 kethomassen
·
3Comments
kethomassen
·
3Comments
Most helpful comment
yes, it works but it still shows the ticks for those floating values. So I think this option only hides label for the floating values:
How can I stop generating it? i.e not just hiding labels.
Here is the complete code which I'm using: