C3: Question: Is there any way to adjust white space between bar chart?
Hi,
I want to create chart look like this.

Is there any approach to adjust the space between each bar to become closer? Current my C3 chart look like this.

Thanks,
Panuwat
 panubear
All 8 comments
Change _0.6_ to _0.9_ or _1_ here:
https://github.com/masayuki0812/c3/blob/master/c3.js#L1613
+1 for implementing config param for bar width
 yojeek
on 28 Mar 2014
yojeek
on 28 Mar 2014
Hi,
Thank you for the feedback.
I added options bar.width and bar.width.ratio for the width of bar chart. These can be used like this:
bar.width = 100then, the width of bars will be 100pxbar.width.ratio = 0.9then, the width of bars will be 90% of the tick width
@panubear For your purpose, I think bar.width.ratio can be used as @yojeek said. Could you try this on the latest version 0.2.24.
Thank you!
 masayuki0812
on 29 Mar 2014
masayuki0812
on 29 Mar 2014
@yojeek Thank you so much for your kindly help.
@masayuki Many thanks for keep developing C3 library especially the remarkable change in this version.
If you don't mind, I would like to ask few more questions.
1) Currently, I use this format for coding to refer to bar.width.ratio > Is there other way (coding style) to refer bar.width.ratio? It would be great if you could add some example to demonstrate on how to use these two options efficiently.
bar: {
width: {
ratio: 0.9
}
}
2) We can use only one of them or we can use both options at the same time?
panubear
on 29 Mar 2014
Hi,
I added this option to the sample for bar chart. Please check this http://c3js.org/samples/chart_bar.html
I think your assumption is OK and it depends on the situation how option object is defined in a code.
These options can not (and do not need to) be used together because if one specified then the other will be determined. Please use one of them based on your use case.
masayuki0812
on 30 Mar 2014
Thanks a lot for your clarification.
panubear
on 31 Mar 2014
Can someone solve this issue if data is received as :
columns: [
['data1', 20],
['data2', 30]
]
The above solution is just used for if data is received as:
columns: [
['data1', 20, 30]|
]
 DogaIster
on 3 Jan 2017
DogaIster
on 3 Jan 2017
Adding white space this way breaks the responsive stretchiness of the chart. This doesn't work.
 clubajax
on 2 Mar 2017
clubajax
on 2 Mar 2017
I managed to hack it this way:
Code:
c3.generate({
    bindto: "#target",
    data: {
      type: 'bar',
      columns: [
        ['data1', 225, null],
        ['data2', null, 109],
      ],
      groups: [
        ['data1', 'data2'],
      ],
    },
    color: {
      pattern: ['#a4a4a4', '#ffe512'],
    },
    onrendered: () => d3.selectAll('.c3-axis.c3-axis-x .tick').style('visibility', 'hidden'),
})
Result:
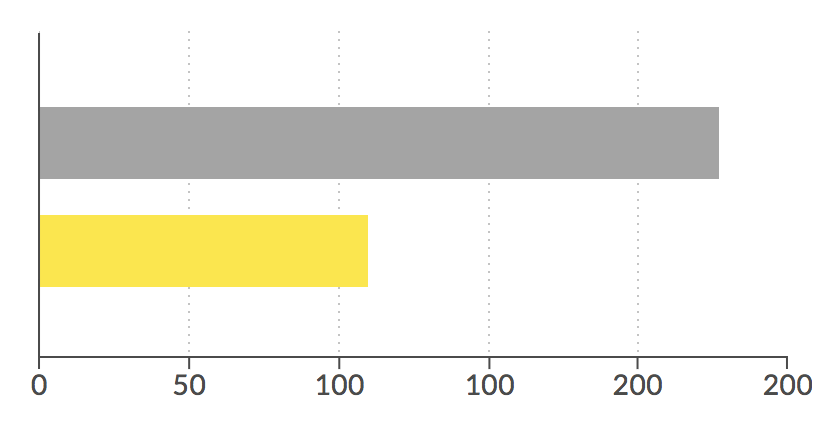
 2metres
on 24 Apr 2018
2metres
on 24 Apr 2018
Related issues
 zachallia
·
3Comments
zachallia
·
3Comments
 seubert
·
3Comments
seubert
·
3Comments
 unlight
·
3Comments
unlight
·
3Comments
 DieterSpringer
·
4Comments
DieterSpringer
·
4Comments
 Zerim
·
3Comments
Zerim
·
3Comments
Most helpful comment
Can someone solve this issue if data is received as :
columns: [
['data1', 20],
['data2', 30]
]
The above solution is just used for if data is received as:
columns: [
['data1', 20, 30]|
]