Description
I could not find the reason, but too many master process are created
Test code to reproduce
queue.ts file
import * as Queue from "bull";
import {Job, JobOptions} from "bull";
import {Operation} from "./operation";
import {Account} from "./account";

export let queue1 = new Queue('worker1', {
    redis: {
        db: 5
    }
});

export let queue2 = new Queue('worker2', {
    redis: {
        db: 6
    }
});

export let queue3 = new Queue('worker3', {
    redis: {
        db: 7
    }
});

export let queue4 = new Queue('worker4', {
    redis: {
        db: 8
    }
});

export let queue5 = new Queue('worker5', {
    redis: {
        db: 9
    }
});

let jobOptions: JobOptions = {
    removeOnComplete: true,
    removeOnFail: true,
    attempts: 3,
    timeout: 10000,
};

export async function addToQueue1(operation: Operation, delay?: number): Promise<Job>
{
    if (delay) {
        jobOptions.delay = delay;
    }

    return await queue1.add('job1', operation.getId(), jobOptions);
}

export async function addToQueue2(operation: Operation, delay?: number): Promise<Job>
{
    if (delay) {
        jobOptions.delay = delay;
    }

    return await queue2.add('job2', operation.getId(), jobOptions);
}

export async function addToQueue3(operation: Operation, delay?: number): Promise<Job>
{
    if (delay) {
        jobOptions.delay = delay;
    }

    return await queue3.add('job3', operation.getId(), jobOptions);
}

export async function addToQueue4(operation: Operation, delay?: number): Promise<Job>
{
    if (delay) {
        jobOptions.delay = delay;
    }

    return await queue4.add('job4', operation.getId(), jobOptions);
}

export async function addToQueue5(account: Account, delay?: number): Promise<Job>
{
    if (delay) {
        jobOptions.delay = delay;
    }

    return await queue5.add('job5', account, jobOptions);
}
i use this file to add operations to queue from processors, for example:
worker4.ts for queue4
export default async function(job: Job): Promise<boolean> {
    let operation = await manager.getOperation(job.data); // I add operation id to job.data and keep operation object in redis hash and here i just get this object from redis hash

    logger.debug('Operation:', operation);

    let account = await manager.getAccount(); // Get object from redis

    if (!account.isUpdated()) {
        await addToQueue4(operation, 5000);

        return true;
    }

    const api = new Api(account);

    if (operation.getStatus() === OperationStatus.CLOSED) {
        let response = await api.close(operation.getData(), operation.getId());

        logger.debug('response: ', response);
        await addToQueue1(operation);
    } else if (operation.getStatus() === OperationStatus.BANNED) {
        let response = await api.ban(operation.getData(), operation.getId());

        logger.debug('reponse', response);
        await addToQueue1(operation);
    } // etc

    return true;
}
Bull version
^3.3.10
Additional information
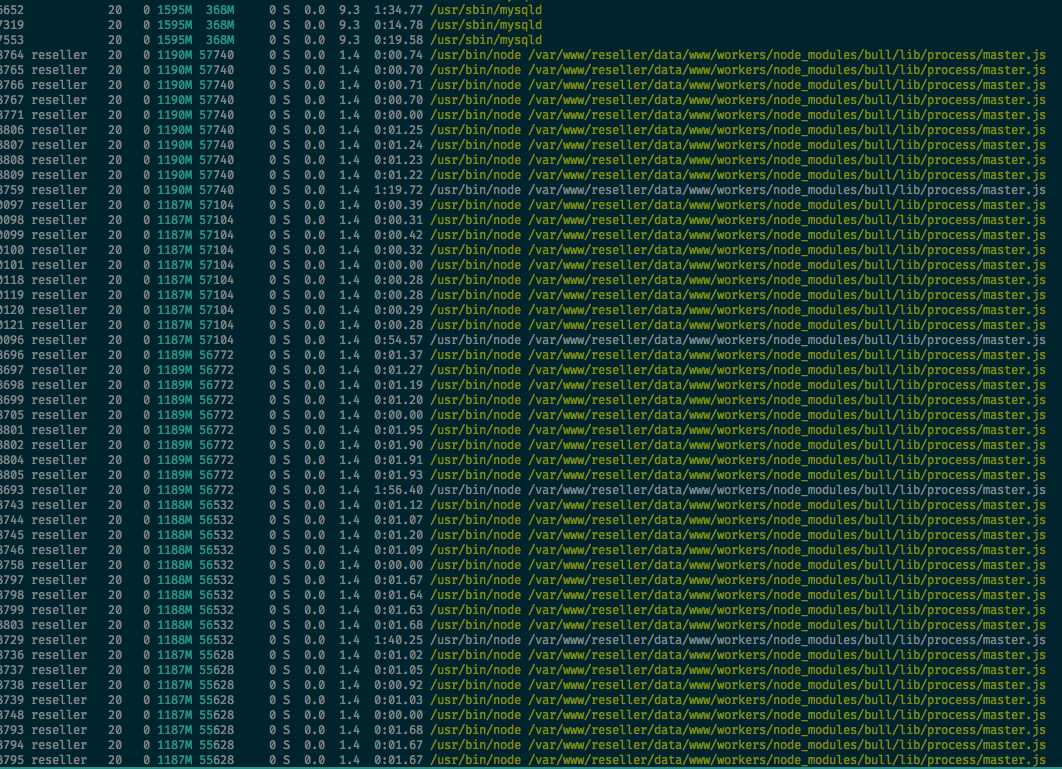
At the moment I have not found what the problem is. But this code runs on production about 2 days and today i found that my server was lagging and if i try to use commands like 'ls' it says to me: "Cannot allocate memory" and after that i run htop and make a screenshoot
P.S. Sorry for my English.
 Exitialis
All 24 comments
I am also having the same issue.
Looking through the code for child pool processes, https://github.com/OptimalBits/bull/blob/07b78257e18a86bf59066c19be14d2d9e79078d8/lib/process/child-pool.js
I have a feeling it is regarding the .on exit or in regards to something on the child process not being unbounded somehow. I figured out what child process it is by modifying the process.title on each of my child processor files. When my jobs are done it doesn't auto destroy the said process until the server closes. I hope this is sort of related.
 noriega3
on 30 Apr 2018
noriega3
on 30 Apr 2018
looking through the issues here, it may be related to this.
https://github.com/OptimalBits/bull/pull/750
noriega3
on 30 Apr 2018
Seems like I just faced this issue as well
 lxcid
on 14 May 2018
lxcid
on 14 May 2018
I have added some more tests for child reuse, however they are all passing so I really cannot reproduce this issue, it would be great if you could write a test case that reproduces the problem:
https://github.com/OptimalBits/bull/commit/6a389d9381fb9930ed8adb3281ae46ed180a89fd
https://github.com/OptimalBits/bull/commit/d6357ce92bc94c025de000063ba217aee25898a7
 manast
on 14 May 2018
manast
on 14 May 2018
@manast thanks for the quick response! I'm still investigating my issue! I'm trying to investigate if its caused by other libraries. Making some changes to see if the memory usage stabilise! I'll reply as soon as I have a good hypothesis.
lxcid
on 14 May 2018
@manast sorry, I have a question that kinda related to how process are generated. If I use rate limiter with max 1 and duration 1000, it will mean that it will only spawn 1 job every second (does it consider the current running job?)
lxcid
on 14 May 2018
@lxcid that specific case means the queue will process max 1 job per second.
manast
on 14 May 2018
Thanks for the extra test cases. I am also investigating the issue. Note: I also use redis in the background using shared instances within the jobs themselves, and these redis connections close once the job is complete using Promise.using/dispose
For child creation, reading the code and seeing how child processes work. An example would be if I have 2 jobs going towards the same processor name, eventProcessA. Job 1 goes in and starts processing. Job 2 wants to start but bull checks that it is busy with another job (job 1), so then spawns another eventProcessA to run in parallel to complete job 2.
Both eventProcessA's stay in memory as 2 free childs available once these jobs are complete? Or is it supposed to gracefully close each child process once it completes? I'm assuming the intention is to stay in memory. I've done a .clean but that doesn't close the created child processes.
noriega3
on 16 May 2018
The idea of the child pool is to reuse processes so that the performance penalization for creating a process per job is minimized. Since bull will only process as many jobs in parallel as the concurrency value, it should never create more processes than said concurrency value. A future addition could be to force the creation of new process for every new job, (and close the old process), if more isolation is required at the cost of worse latency.
manast
on 16 May 2018
That makes sense. It does perform significantly faster for future jobs when running through my tests. I do have a suggestion that I'll make a new thread for.. But going back, I may just thought too in depth to the point where I assumed I could easily close specifically named child processes in memory by cleaning or destroying. But now, I will probably use "*" and letting that parallel process figure out which of my internal functions to use, with bull creating more as needed.
noriega3
on 16 May 2018
I'm encountering the same issue, I'll try to make a small example to reproduce the issue
 kombucha
on 1 Jun 2018
kombucha
on 1 Jun 2018
Experiencing similar issue when new jobs are created very quickly, but the jobs themselves take a long time to execute.
When debugging the ChildPool code create jobs A, B and C, on the first job (A) it creates a new child, for the second (since the first one is not finished) it sees that there are no free processes so it creates a new one. For the third one (depending on how long the A or B takes) it will re-use an existing process or create a new child process. I'm not sure why it keeps taking new jobs from the queue if the concurrecny is set to 1.
 DavisJaunzems
on 4 Jun 2018
DavisJaunzems
on 4 Jun 2018
@DavisJaunzems thanks for the info, this may get us a hint on how to create a test that reproduces the issue.
manast
on 5 Jun 2018
More debugging shows that it has something to do with the job that I'm executing (it creates database connection, etc.), because when running a simple sleep job then it behaves as expected.
Update: Turns out that the logic I had in the job (starts a lite nest.js web app to get DB connection and other things in the context), also had the Queue creation logic in it. So it would re-create ChildPool object every time making the this.free empty. So it wouldn't find any child processes in that context and just spawn a new child process every time. This also explains why it was reading multiple jobs at the same time when concurrency was set to 1. My advise is to double check if your job logic doesn't clash with the existing queue logic.
However, I still see an issue when two jobs are created in the queue very quickly, that it would spawn at most N processes, where N is the number of processors (.process) registered for queue, anything to do with the locking logic @manast ?
DavisJaunzems
on 5 Jun 2018
Seeing similar issue. A host of Bull processes which spawn puppeteer instances. Memory builds up on Bull but not on puppeteer instances after 1 hour. Echoing comments above: Fast adding queue. DB and redis connection inside worker but no adding new queue within.
 alvinwoon
on 19 Jul 2018
alvinwoon
on 19 Jul 2018
@alvinwoon I'll double check the logic for spawing process to see if there is a hazard somewhere.
manast
on 19 Jul 2018
@alvinwoon unfortunately I am not able to see how this hazard can happen :/
Maybe with a concise reproducible example I could find the issue.
manast
on 22 Jul 2018
I took another attempts to try investigate the issue again…
I think had the same behaviour as everyone, I reduced the concurrency to 2.
const opts = {
  limiter: {
    max: 5,
    duration: 1000,
  },
};
const jobsQueue = Queue('jobs', opts);
jobsQueue.process(
  'FIRST_JOB',
  2,
  path.join(__dirname, 'jobs/processors/first-job.js'),
);
jobsQueue.process(
  'SECOND_JOB',
  0,
  path.join(__dirname, 'jobs/processors/second-job.js'),
);
jobsQueue.process(
  'THIRD_JOB',
  0,
  path.join(__dirname, 'jobs/processors/third-job.js'),
);
After running for a while, the system top reported about 16 node node_modules/bull/lib/process/master.js instances…
I'm gonna attempt to try see if I can figure anything out…
lxcid
on 22 Dec 2018
I'm not very familiar with the codebase but afaik, I believe the code in question is at ChildPool.retain()…
This function forked a child process if there is no free child process to reuse (at line 32). It doesn't do any check nor limit the number of processes created…
This sandbox system get setup if we tell the queue we want to process the job with a process file…
https://github.com/OptimalBits/bull/blob/9ea172098babb5c01e749c57953e9a4d1fc4bc68/lib/queue.js#L685-L697
I believe concurrency does not control the amount of process get created, seems like concurrency control speed at which the scheduler schedule the jobs.
So if you have large number of job queued up, the scheduler might schedule them as fast as possible (I believe this is where rate limiter is respected), but if u does not have enough processor to keep up with the scheduler, more child will get forked.
lxcid
on 22 Dec 2018
The concurrency controls the amount of jobs that can be processed in parallel. It is a simple loop. Whatever is the reason for this issue is much more subtile.
manast
on 22 Dec 2018
Would it be possible to emit an event for when a child is forked? I’m not sure how it will help but we might able to log when that happen and see how it interact with limiter settings.
It’s think to control the memory, if we could manage the child process or limit its creation, it should help quite a bit.
lxcid
on 23 Dec 2018
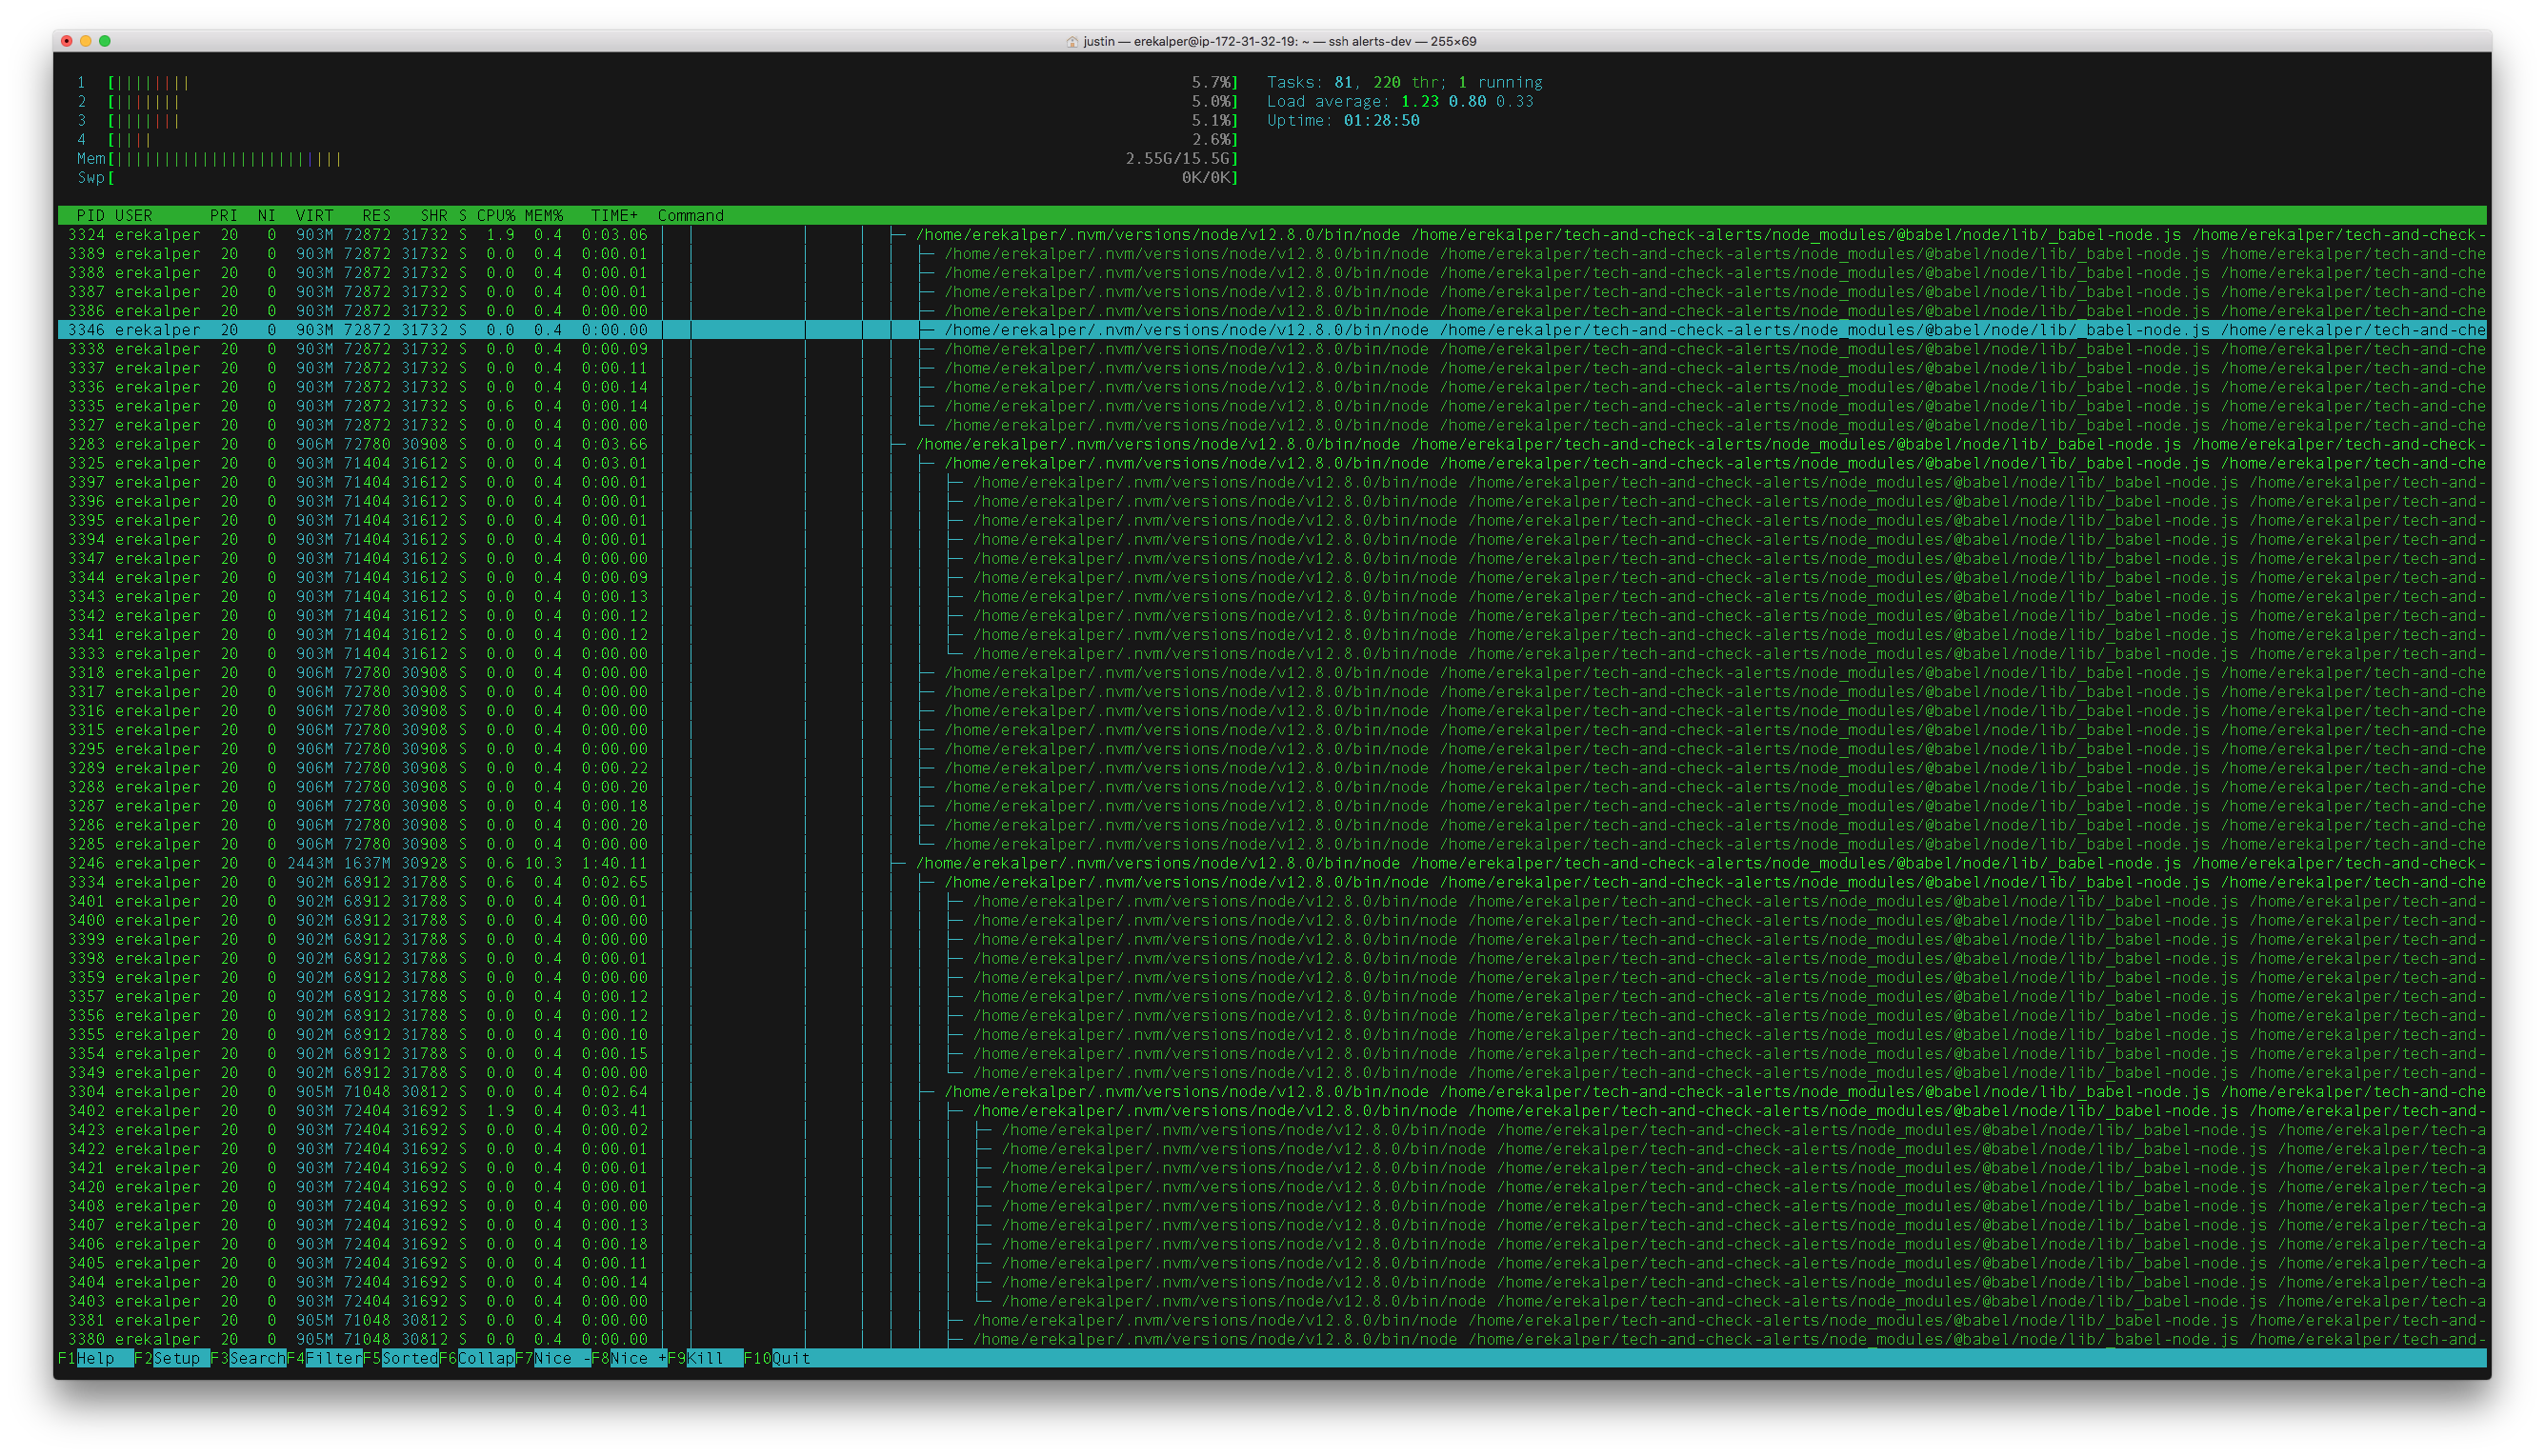
We are facing this issue over at this project but only when deploying to a server.
When running locally I see around 15 master.js processes when I run htop.
When running on our dev deployment we see hundreds.
The machines have the same number of cores (4), same amount of RAM (16 GB), the difference may be how long each job takes to complete due to network latency?
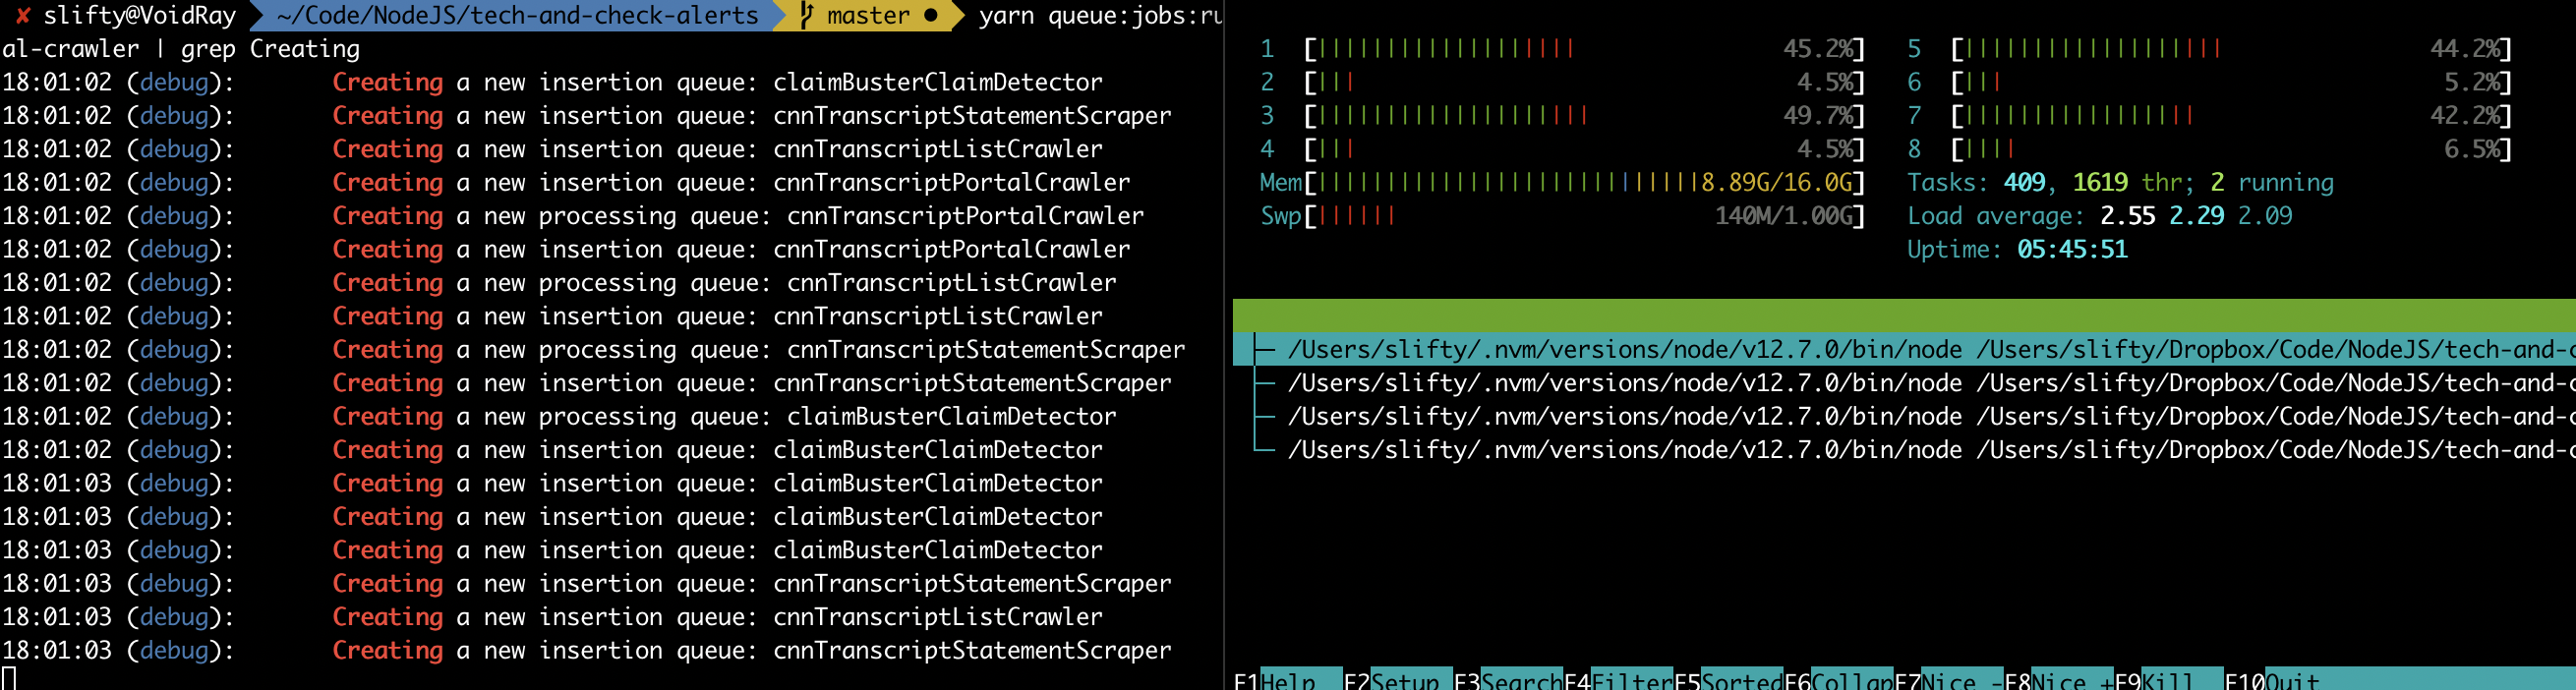
We have a few queues which create new jobs for other queues (it is essentially a crawl / scrape pipeline). The queues themselves are created by this factory and this is an example processor
Some clues:
On local dev, the 15 master.js processes remain open even after all queues are empty. Same on the server for the hundreds.
Here is a screenshot of the process trees (they are all the same master.js processes)
Local Dev process tree
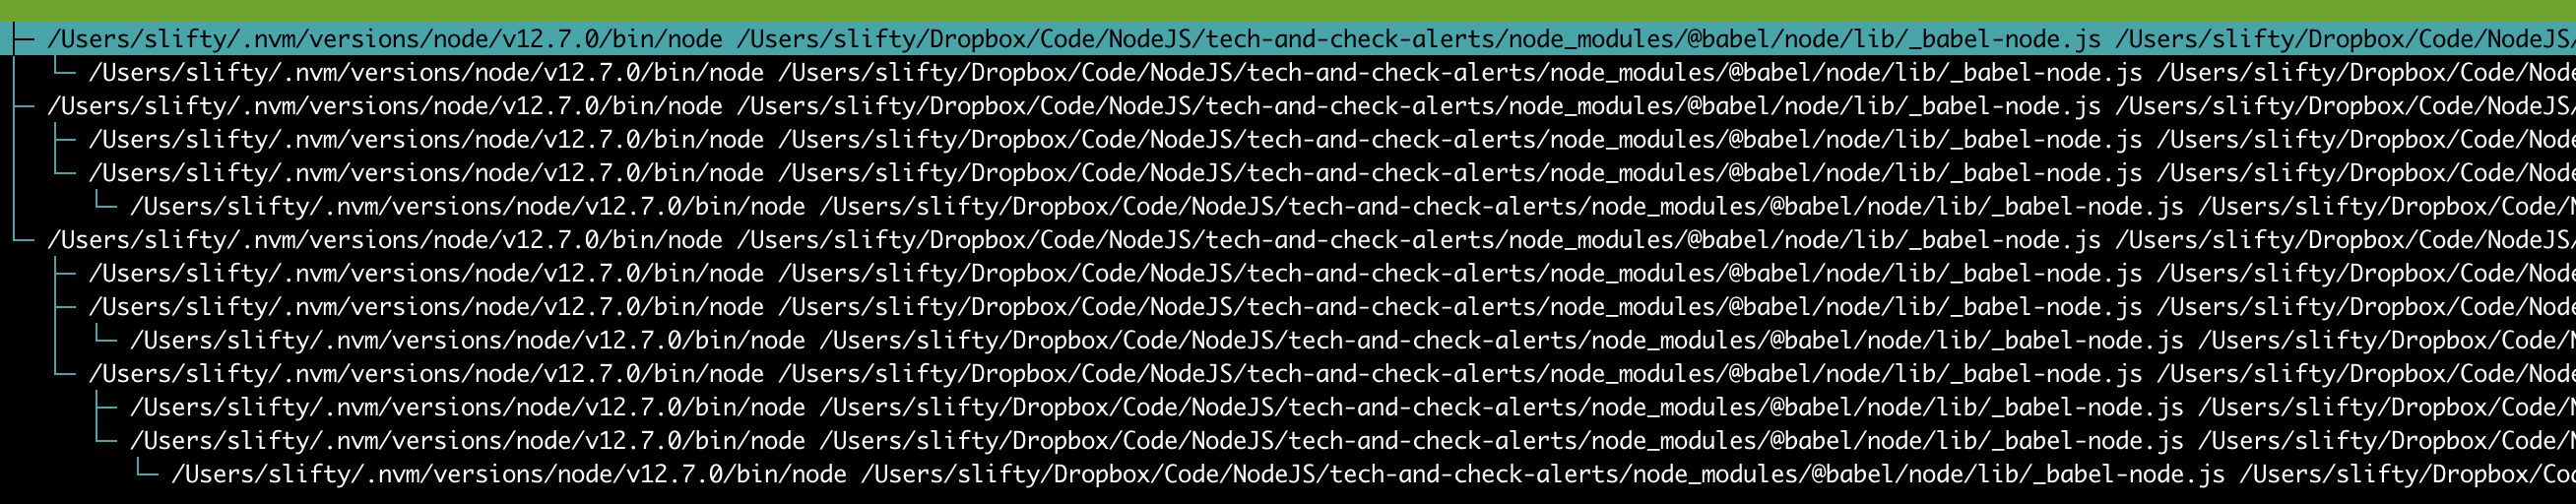
Server Dev process tree
- I added a debug line on the first line of the
getQueue()factory method and it looks like 15 queues are created on both local and dev (reminder: hundreds of master processes are created on dev, but 15 master process are created on local)
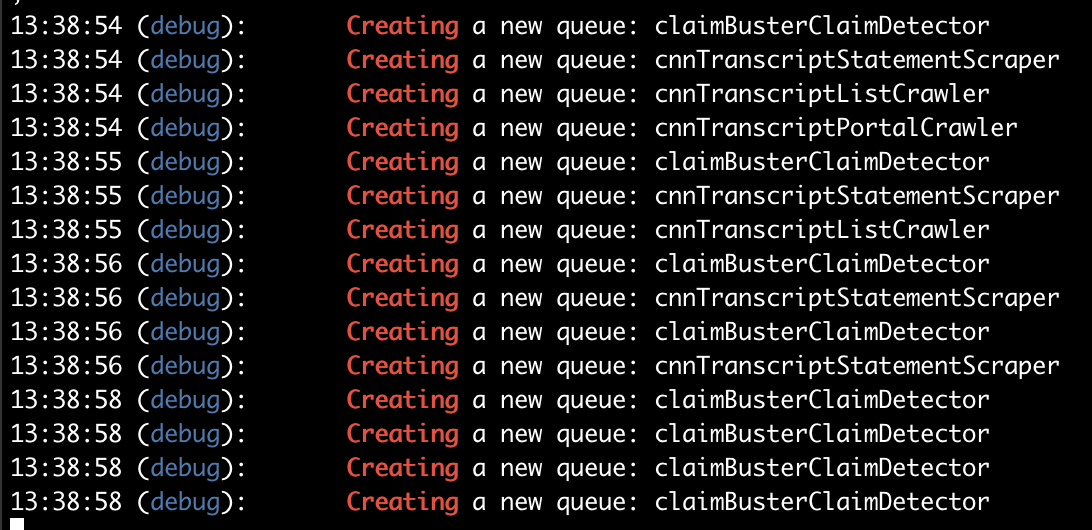
I'll update this note as we discover more about what's going on.
Update
(I believe... ) We figured out what was causing this on our end: our queue factory was also registering a processor to the queue when creating it. This meant that every time we created a new queue (e.g. creating something simply to insert a new job) we also created a new processor and therefore a new paired child thread.
One thing is that the way concurrency works is not entirely from the documentation -- e.g. it isn't clear that concurrency is specific to a single queue OBJECT not the queue name (though I admit that it is now pretty obvious that it would have to be at the object level). I'm not sure if the folks in this thread were facing this as a their problem but here is what it all looks like for me now:
 slifty
on 19 Aug 2019
slifty
on 19 Aug 2019
Hi @slifty! Yes, It was a little surprising for me too when I used Bull first time. Queue options are never persisted in Redis. You can have as many Queue instances per application as you want, each can have different settings. The concurrency setting is set when you're registering a processor, it is in fact specific to each process() function call, not Queue. If you'd use named processors, you can call process() multiple times. Each call will register N event loop handlers (with Node's process.nextTick()), by the amount of concurrency (default is 1).
 stansv
on 20 Aug 2019
stansv
on 20 Aug 2019
Another note -- htop shows threads as processes by default. If OP were to type "H" I wonder if it would collapse into just the six processes that they expect.
Maybe this issue is a combination of folks who are misunderstanding the output of htop and folks who are misunderstanding the way concurrency works across multiple queue objects (I fell into both categories).
slifty
on 20 Aug 2019
Related issues
 alolis
·
4Comments
alolis
·
4Comments
 ianstormtaylor
·
4Comments
ianstormtaylor
·
4Comments
 sarneeh
·
3Comments
sarneeh
·
3Comments
 NicolasDuran
·
4Comments
NicolasDuran
·
4Comments
 btd
·
3Comments
btd
·
3Comments
Most helpful comment
Another note -- htop shows threads as processes by default. If OP were to type "H" I wonder if it would collapse into just the six processes that they expect.
Maybe this issue is a combination of folks who are misunderstanding the output of htop and folks who are misunderstanding the way concurrency works across multiple queue objects (I fell into both categories).