Bull: Higher CPU usage with Bull 3.x (over Bull 1.x)
We're noticing significantly higher CPU across the board with Bull 3.0. The upgrade was about halfway through the charts below. Job throughput remained constant.
Redis CPU:

Node process CPU

We're using all the default settings for Bull 3.0.
 bradvogel
All 28 comments
Do you know anything off the top of your head that would have caused this? We can dig more in our side - especially into the Node process CPU since that shouldn't have increased in this upgrade. My guess is that it's the new way all events are sent globally.
bradvogel
on 28 May 2017
Events were also sent globally in version 2.x, but it was less efficient then since now they are sent directly from the lua script, saving a roundtrip. 3.0 should be in theory just faster, code is less complex and there are much less roundtrips overall, so this is quite an unexpected result.
 manast
on 28 May 2017
manast
on 28 May 2017
Should have mentioned that this was from Bull 1.0. We'll investigate
bradvogel
on 28 May 2017
Re-titled it. We'll run some benchmarks and see where it regressed.
bradvogel
on 28 May 2017
Is this the CPU of the redis instance or a worker process? Do you know what the peaks are?
manast
on 28 May 2017
I can try some benchmarks tomorrow to see if I can see something strange.
manast
on 28 May 2017
Both node and redis CPU, proportionally. This is good though because it makes to easier to debug. The peaks are an influx of jobs generated by another from job (sorry, should have mentioned in the description). Another curious fact is that network output (as told by the AWS cloudwatch metrics) also increased proportional to the CPU. So that tells more the workers are reaching back to redis a lot more to process a single job.
bradvogel
on 28 May 2017
ah ok, sorry I missed that one graph is for redis and the other for node. Some interplay is definitively happening since the correlation is almost 1:1. There must be something spurious going on, since the network traffic generated by the queue overhead should be definitively smaller than previous versions, even 1.0.
manast
on 29 May 2017
I am running the bee-queue benchmarks and we are mostly at par, sometimes even a bit faster than bee-queue. There is a warning though when having a high concurrency value, such as 20, because we register three listeners per concurrent "thread". I have fixed so that it is only one now, but still the warning is generated. This warning is mostly harmless and I do not think has any effect on performance.
manast
on 29 May 2017
I re-ran the tests and found that Redis and Node CPU regressed in both Bull 2.x and again in 3.x.
These charts show an upgrade from 1.x to 2.x and to 3.x, with everything else constant (job throughput, number of servers, etc):

We'll dig into more on our side to see where the time is being spent - especially in the Node process, which is easier to debug.
bradvogel
on 30 May 2017
Is the blueline 3.0 or 2.0?
Btw, I have a theory about what could be happening and I will implement a fix for it. Namely that when using a high concurrency level, if all the "threads" are idle and a new job is added to the queue, all threads will try to fetch a job from the queue, although only one will succeed. This could potentially create a lot of overhead if the jobs come in following an "inconvenient" pattern.
manast
on 30 May 2017
I ran some performance tests to see if I could make some targeted performance improvements. I realized that the major source of CPU was the pmessage subscription: all Bull workers are
receiving state changes for all Bull jobs across the system in order to publish the global:* events.
So I disabled the global events by changing psubscribe into two simple subscribe calls for delayed and active since those are necessary for queue operation. The diff is here: https://github.com/OptimalBits/bull/pull/555/files
bradvogel
on 30 May 2017
(continuing above) The results from the above experiment greatly lowered Node CPU relative to the original baseline above where CPU was at 100% (upgrading from Bull 1.x to Bull 3.x):

and also helped bring Redis CPU down a bit:

Though these charts show that Bull 3.x is still much slower than 1.x, they were at least a dramatic improvement over the original performance benchmarks above.
bradvogel
on 30 May 2017
@manast You're also right about high concurrency and all "threads" trying to fetch at the same time. That would be another great perf optimization.
bradvogel
on 30 May 2017
ok. The problem is that global events are not only needed for clients, also for the queue itself, since we do not rely on a blocking call anymore we need to send messages to notify that new jobs have arrived...
manast
on 30 May 2017
I wonder why pmessage is so slow though, should'nt be it, unless you have like thousands of clients connected to redis.
manast
on 30 May 2017
See my PR here: https://github.com/OptimalBits/bull/pull/555/files. I preserved global events for added and delayed, but I'm using faster message rather than pmessage to subscribe to them. I suppose we'd also need global events for wait and resume. But why are the other global: events needed?
We have probably 20 worker processes connected (10 servers x 2 node processes on each), and processing a total throughput of around 50 jobs/sec. So each time a job is completed, the pmessage listener on all Bull workers picks up the completed event, (runs it through JSON.parse)[https://github.com/OptimalBits/bull/blob/master/lib/queue.js#L308], and emits it locally. This is generating a lot of extra CPU overhead if there are no listeners.
On the issue Namely that when using a high concurrency level, if all the "threads" are idle and a new job is added to the queue, all threads will try to fetch a job from the queue, although only one will succeed - want me to file a separate github issue to track that? I think that'll also help a lot, given that we have a concurrency of 40 :)
bradvogel
on 30 May 2017
Yes. I guess that we need a smarter way to setup listeners, specially the global ones. We can have a proxy so that we only register redis messages for the events the user actually subscribed to. This would make workers faster. Honestly, I did not think pubsub was so slow, I read about its performance and it seemed as it could not be an issue, specially the difference between message and pmessage is quite surprising.
manast
on 30 May 2017
I think pubsub within Redis is still fast. I think it's how we're listening to it that's slow (for example, by running JSON.parse on all jobs that are completed). I think that's why temporarily removing the pmessage listener improved Node CPU usage a lot more than Redis CPU.
On the issue Namely that when using a high concurrency level, if all the "threads" are idle and a new job is added to the queue, all threads will try to fetch a job from the queue, although only one will succeed - want me to file a separate github issue to track that? I think that'll also help a lot, given that we have a concurrency of 40 :)
bradvogel
on 30 May 2017
bradvogel
on 1 Jun 2017
Filed https://github.com/OptimalBits/bull/issues/553#issuecomment-304949746 separately as https://github.com/OptimalBits/bull/issues/561
bradvogel
on 5 Jun 2017
manast
on 10 Aug 2017
We still have the same issue.
All the same: CPU on workers nodes goes high, network out shows the same graph.
Our server use node cluster with concurrency of 20 workers.
Each worker creates Bull object and subscribe to 2 queues.
 victornikitin
on 19 Nov 2018
victornikitin
on 19 Nov 2018
@bradvogel how have you fixed the problem?
victornikitin
on 20 Nov 2018
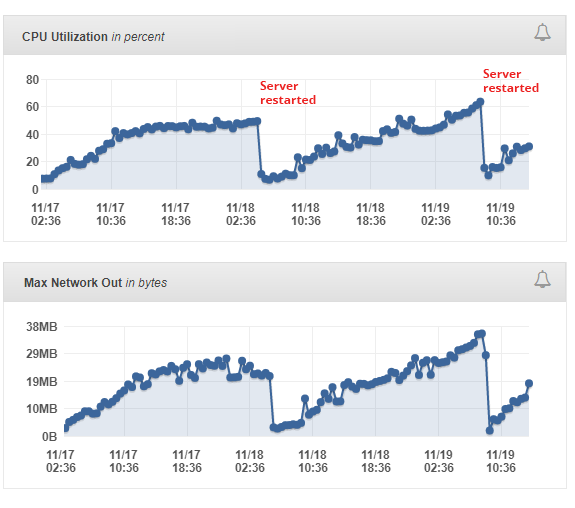
We are switching from KUE to BULL.
The graphic shows OUT traffic for 1 server with 20 cluster workers (concurency) with 2 queues each.

KUE showed 5GB per day without CPU grow.
BULL showes 20GB per day and CPU grow.
Application code is all the same. All jobs are with delay for several ms..sec.
victornikitin
on 20 Nov 2018
@victornikitin this thread is quite old, and the issues discussed here are not relevant anymore, the way bull works now is much more different. I would like to hear more about your specific case and try to reproduce it.
That the CPU is higher is not really an indication of a problem, could just be that bull is processing jobs faster and therefore keeping the CPU in higher usage.
Anyway, if you provide me with more information I will help you to figure out this issue.
manast
on 20 Nov 2018
btw, are you using a sandboxed processor or a regular one?
manast
on 20 Nov 2018
@manast thank you for reply.
We suppose that problem can be on our side. We were also creating many named queues and haven't closed them. So we think that these calls could generate traffic and CPU usage. With KUE this prooblem havent affect us (have no idea why). We refactored our application, and for right now both traffic and CPU is ok. We will response if we will found any other effects.
Sorry for mistake.
victornikitin
on 21 Nov 2018
Related issues
 davedbase
·
3Comments
davedbase
·
3Comments
 rodrigoords
·
4Comments
rodrigoords
·
4Comments
 chocof
·
3Comments
chocof
·
3Comments
 NicolasDuran
·
4Comments
NicolasDuran
·
4Comments
 thelinuxlich
·
3Comments
thelinuxlich
·
3Comments
Most helpful comment
Fixed in https://github.com/OptimalBits/bull/pull/641