Browser: Content autofill is slowing down page loads severely in Firefox
Steps to reproduce:
Load 5 tabs with some Jira URL (https://issues.jenkins-ci.org/browse/JENKINS-1181)
Select all tabs with Shift + Click.
Click F5 to reload all pages at the same time.
Wait for all pages to load then repeat this 3 more times.
Expected behavior
Most of the web content process's work is related to the site
Actual behavior
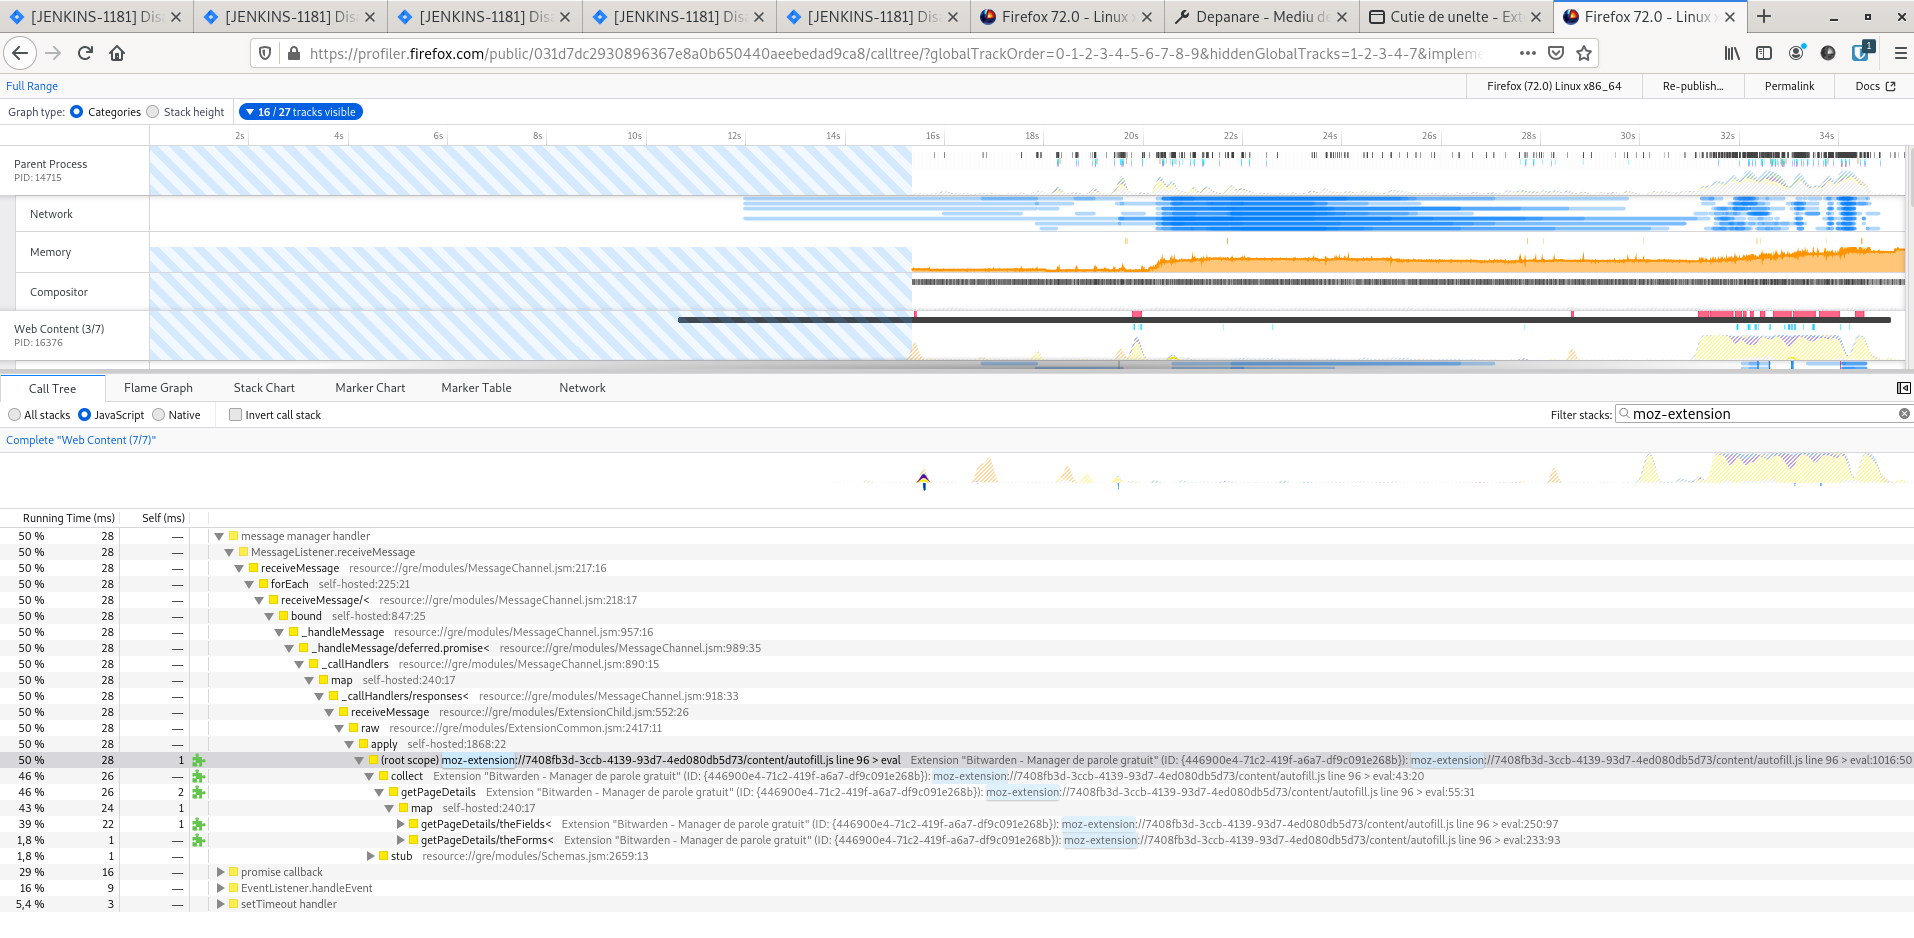
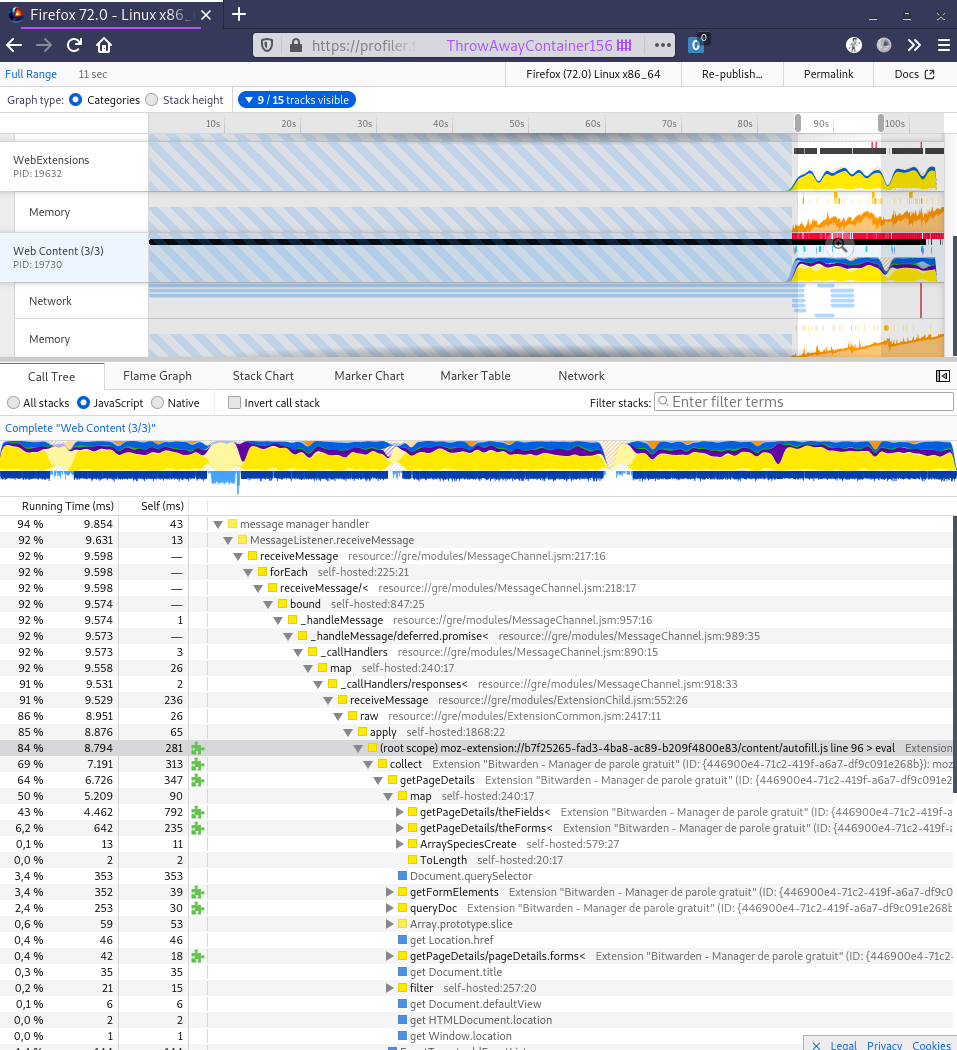
More than 50% of web content process is spent in autofill.js. Here is the profile I recorded https://perfht.ml/2OnWdx2
In case you never used the Firefox Profiler here is some documentation https://profiler.firefox.com/docs/#/
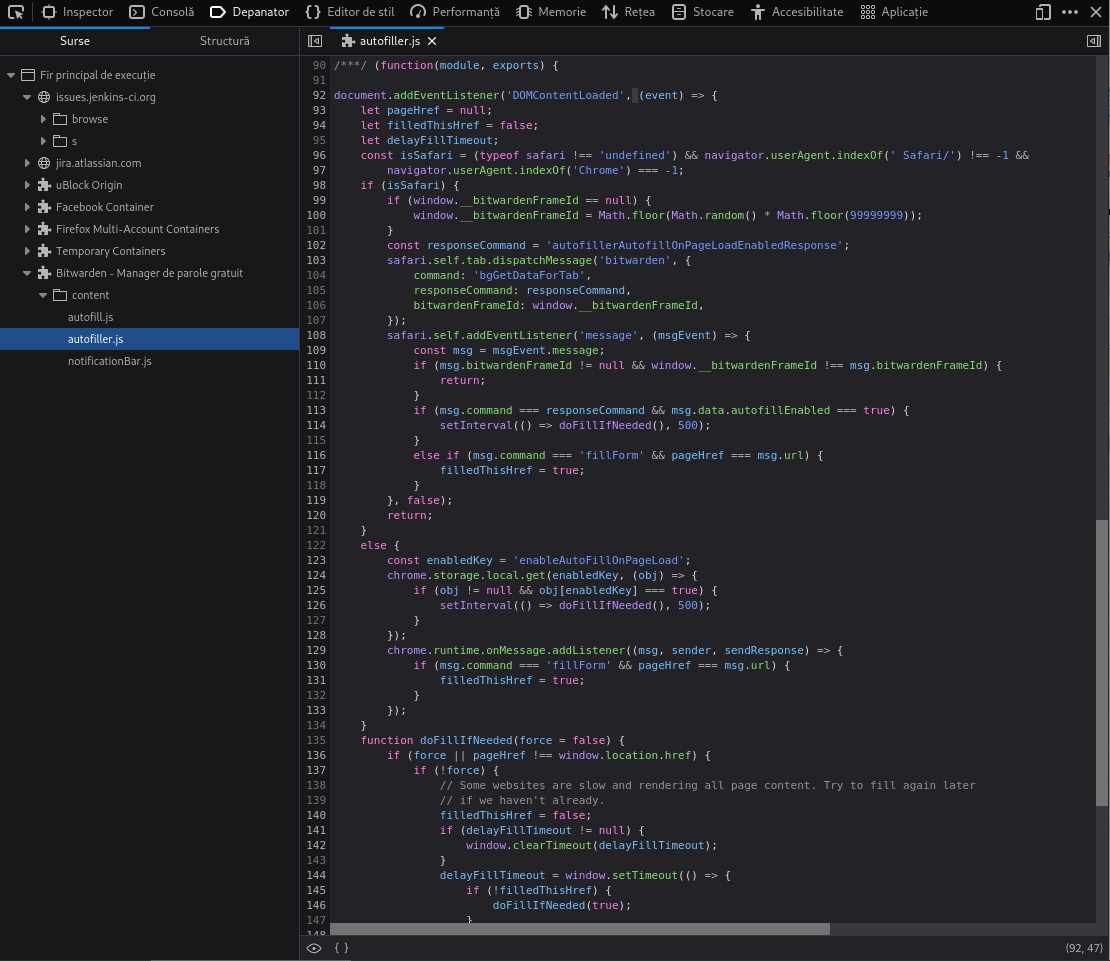
I built the Bitwarden extension from the master branch in order to get the sources in the profile. Not sure how well that went since content.js line 96 does not point to any valid line.
BitWarden it the most resource hungry extension I use and I use quite a lot. I would be happy with some flag or option to disable whatever feature causes this perf issue.
 andreicristianpetcu
All 13 comments
Can you open Settings > Options and check "Disable Add Login Notification" and "Disable Changed Password Notification". Does the problem go away?
 kspearrin
on 26 Nov 2019
kspearrin
on 26 Nov 2019
@kspearrin Sadly this does not fix my issue. Here is the new profile https://perfht.ml/2KWiZKd
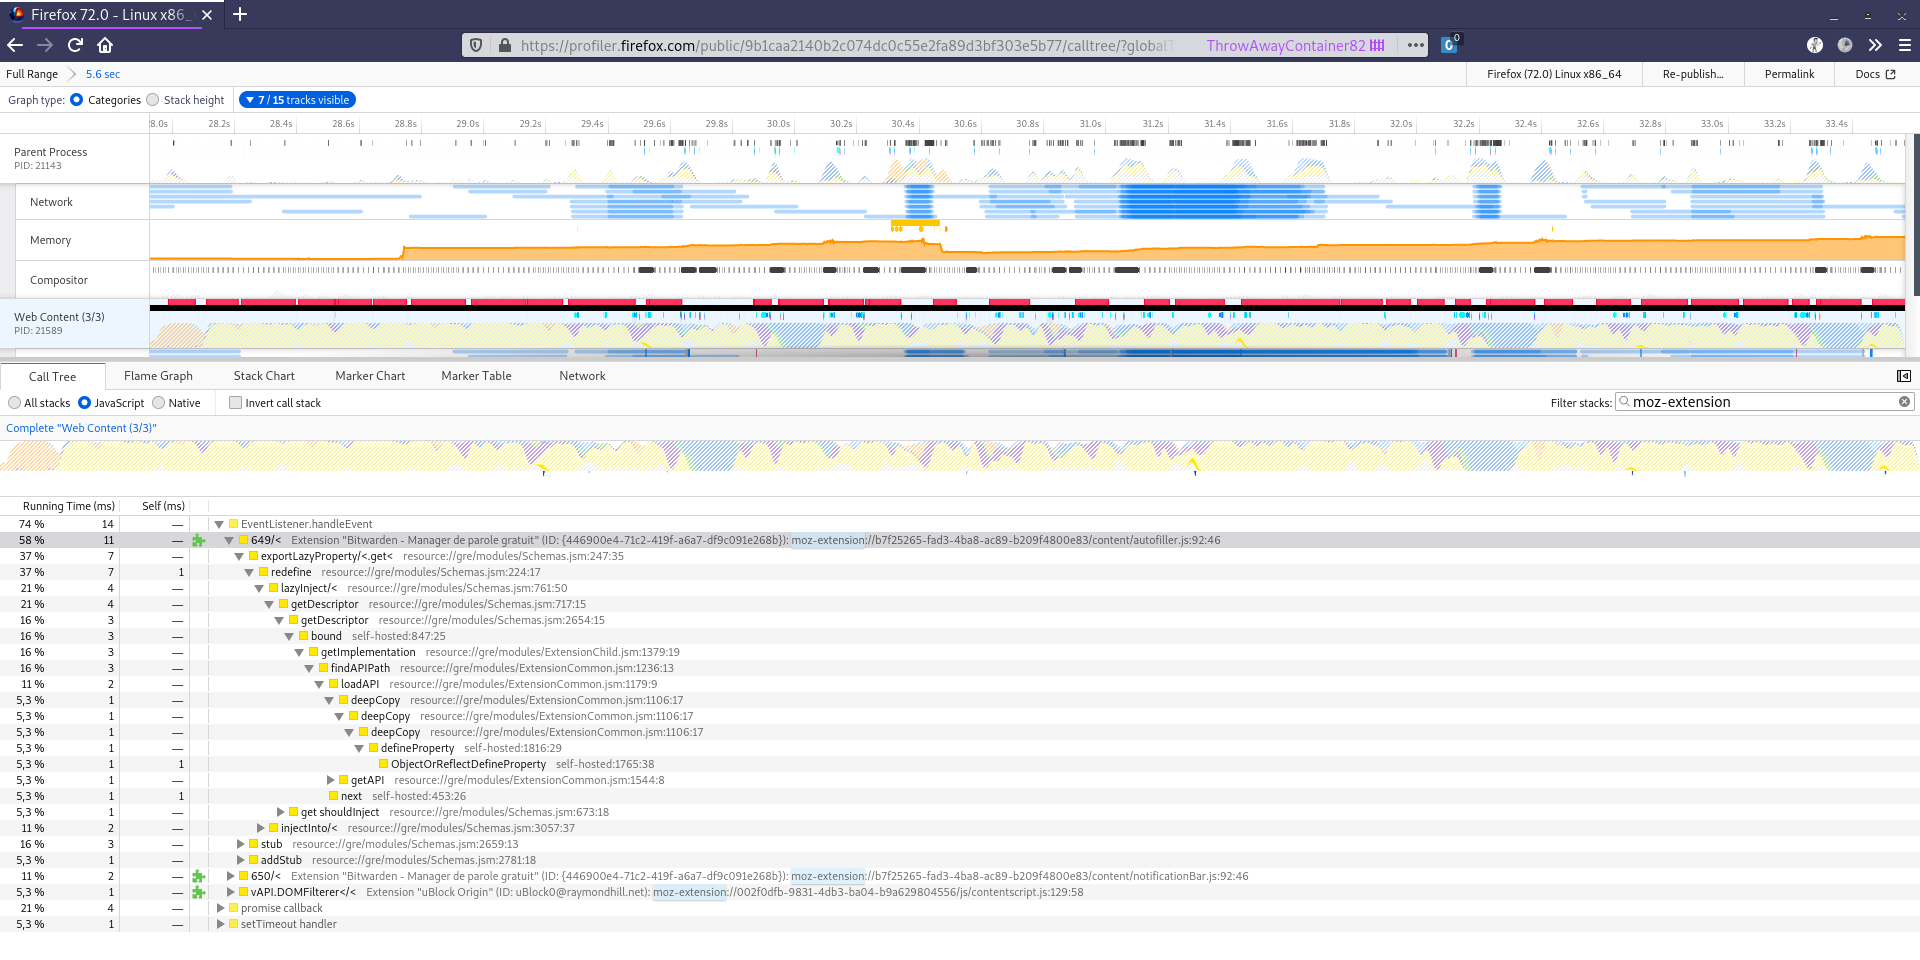
This is where the profile points to. It seems that even with these flags changed, I still load the autofiller.js file.
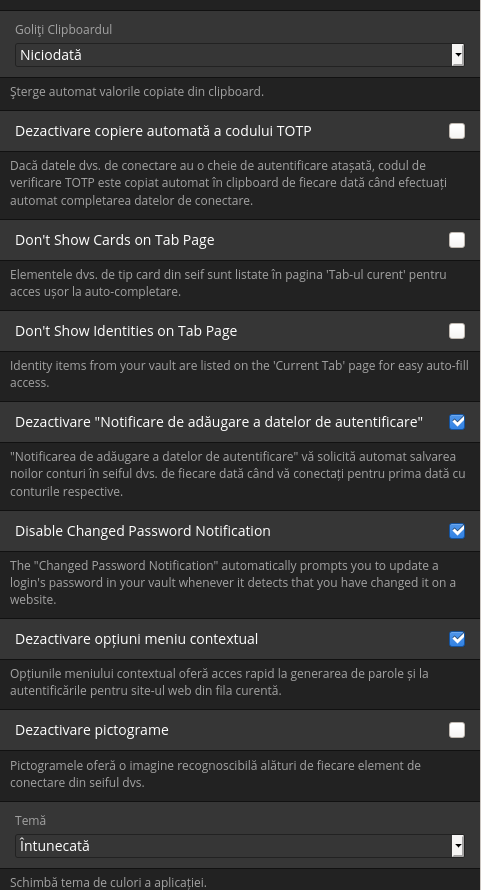
Sorry for the non-english UI :smile:
andreicristianpetcu
on 26 Nov 2019
Are you using “autofill on page load”?
kspearrin
on 26 Nov 2019
No, I'm not

andreicristianpetcu
on 26 Nov 2019
This is where the profile points to. It seems that even with these flags changed, I still load the autofiller.js file.
The file will still load. I cannot conditionally change that. However, it should not do any work if those settings are as described.
Is the problem coming from autofill.js or 'autofiller.js`? You reference both of those in your comments.
kspearrin
on 27 Nov 2019
@kspearrin The first one is autofill and the second one is autofiller. I also saw notificationBar but that did not have such an impact.
I see you load both of these files from manifest.json.
What stops you from executing it on page load?
function onComplete(e){
    if(isFeatureEnabled()){
        chrome.tabs.executeScript(e.tabId, { file: "content/autofill.js"});
        chrome.tabs.executeScript(e.tabId, { file: "content/autofiller.js"});
    }
}

chrome.webNavigation.onCompleted.addListener(onComplete,
  { url: [{ schemes: ["http", "https"] }] }
);
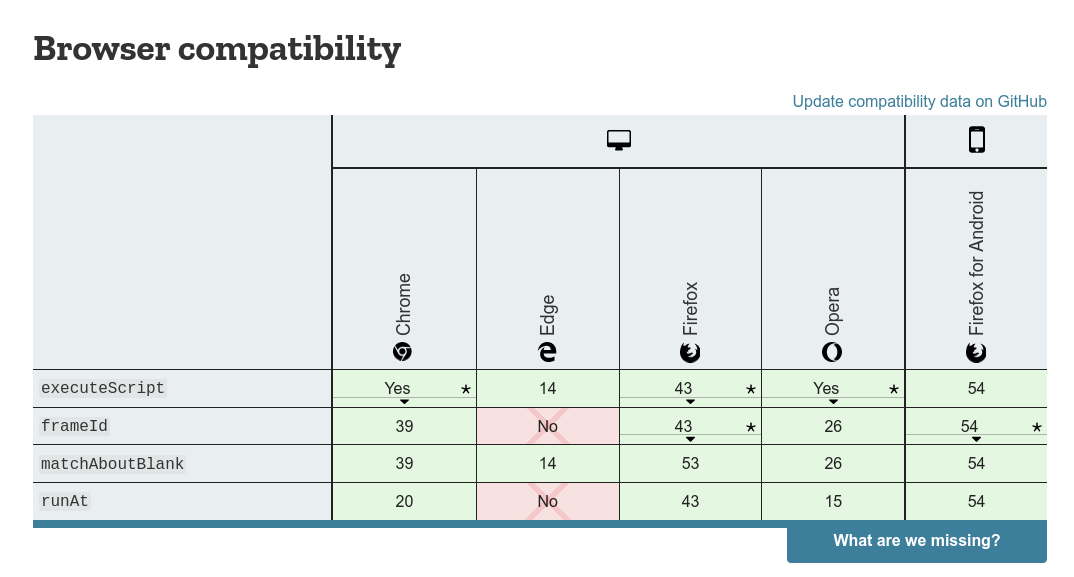
executeScript is available cross browser.
I can try to make these changes locally when I get some time and see how it affects page load and performance data.
andreicristianpetcu
on 27 Nov 2019
I made this silly little commit.
With const isNotificationEnabled = true; the performance issues are still there.
https://perfht.ml/2slbeXH
With const isNotificationEnabled = false; the performance issues are fixed.
https://perfht.ml/2L2HoxQ
Unfortunately in both cases the extension does not work properly. I blame it on my lack of familiarity with your code base :smile: WebExtensions give you tons of options when and how to load the files programatically.
My patch will never work in non-Firefox browsers without the polyfill. Either use the callback version of the API or the polyfill if the order of js file loading is important for you.
andreicristianpetcu
on 27 Nov 2019
TIL about executeScript.
I would certainly expect your commit to resolve the issues since it is essentially removing all of the scripts. We need to figure out which feature is causing the autofill collection that causes the degrading perf.
kspearrin
on 27 Nov 2019
Is there anything else I can help with? Is the performance profile enough for you? @kspearrin
Basically this is how I recorded the profile https://vimeo.com/269371096 the video is old, the profile url changed but that is the general idea.
andreicristianpetcu
on 27 Nov 2019
Actual behavior
More than 50% of web content process is spent in autofill.js. Here is the profile I recorded https://perfht.ml/2OnWdx2
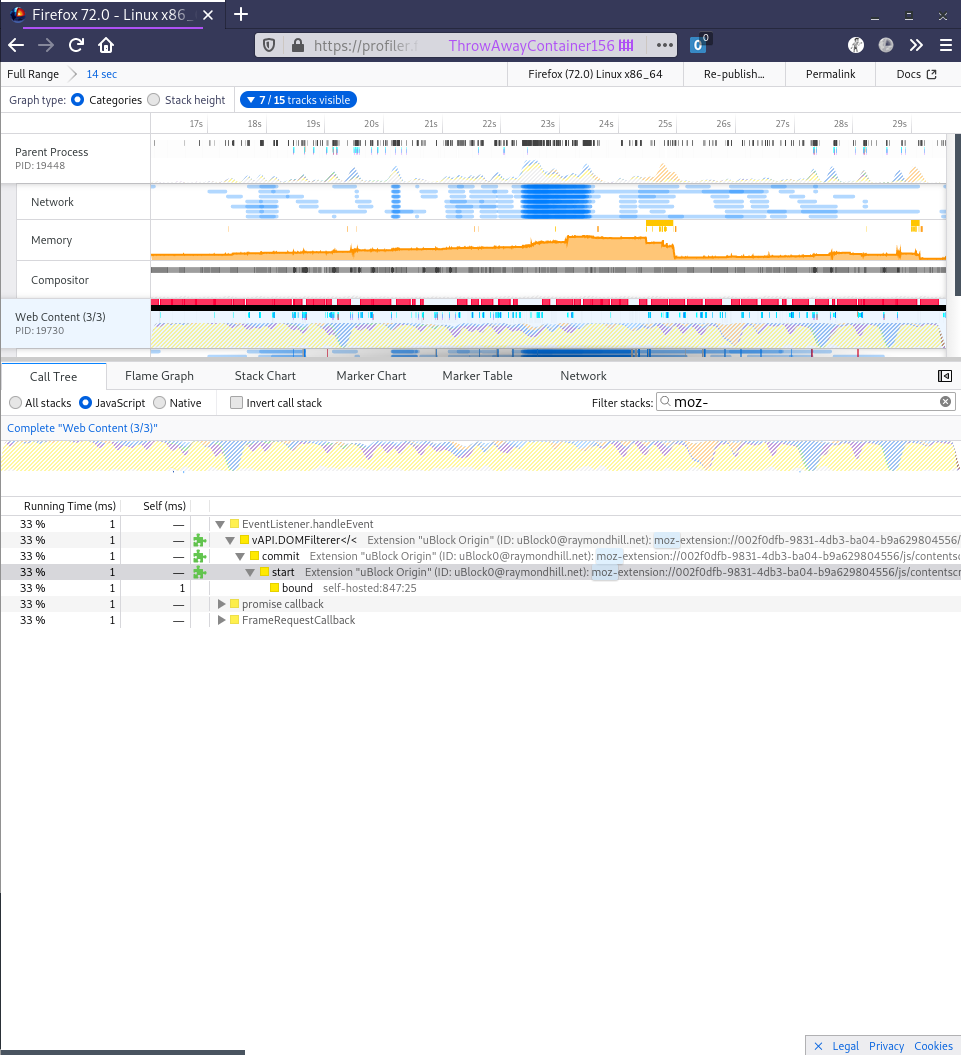
This is not actually what the profile shows. The profile has a search filter applied to it (for the string moz-extension), and the percentage shown in the tree is relative to the filtered samples, i.e. to the number of samples that have the string moz-extension anywhere in their stack. There is no easy way in the profiler to see the percentage relative to all collected samples.
It's instructive to look at the absolute "Running time (ms)" numbers, and they aren't all that high in this profile.
 mstange
on 3 Dec 2019
mstange
on 3 Dec 2019
Could be related? (root cause is still not fixed). I didn't look very hard at the profile that was posted though.
Edit: Another related bug from Lastpass this time.
 eoger
on 3 Dec 2019
eoger
on 3 Dec 2019
You are right, sorry for the confusion @mstange the filter influences the percentage.
@eoger these issues do not seem like mine. My browser does not slow to a crawl or freeze. I noticed that Jira is really slow on my main profile with a ton of extensions and it's faster on a new profile. I found a public Jira and started profiling. I noticed Bitwarden was injecting scripts for features I disabled being the number one performance consumer among several extensions. I will try to profile on Chrome also.
Lastpass is terrible on performance. I tried to approach them, shared a profile, did not call back even if I was a payed customer. Lastpass issues were the reason I switched to BW 😄 pretty sure that is a different issue.
andreicristianpetcu
on 3 Dec 2019
Why not lazy load the content scripts based on features being used? They get loaded all the time even if you need them or not.
andreicristianpetcu
on 3 Dec 2019
Related issues
 0b10011
·
25Comments
0b10011
·
25Comments
 dralley
·
79Comments
dralley
·
79Comments
 Moxville
·
38Comments
Moxville
·
38Comments
 WardsParadox
·
139Comments
WardsParadox
·
139Comments
 chrisirwin
·
28Comments
chrisirwin
·
28Comments
Most helpful comment
Why not lazy load the content scripts based on features being used? They get loaded all the time even if you need them or not.