Brigade: Discussion: Exporting metrics
@willie-yao has been working on a prototype that exports Prometheus metrics from Brigade 2 using the API. He's also working on a Grafana instance that's preconfigured with a datasource and dashboard for retrieving and visualizing those metrics.
Question now is-- what metrics do we think would be useful to see on that dashboard?
So far, we only have a gauge on pending events (or more precisely, events having pending workers). This has been enough to enable a focus on nailing down the architecture, but now we need to decide what other metrics to serve up.
Discuss...
cc @radu-matei @vdice @technosophos
Not setting a milestone because I expect we'll probably ship this as an add-on. The issue appears here in this repo for visibility and lack of a more appropriate place.
 krancour
All 11 comments
Hmmm, it's been a minute since I dabbled in Prometheus/Grafana and/or observability tools in general.
At a high level, though, I had the following ideas for things we could consider looking at:
- Worker duration (global, per project and/or event)
- Worker status ("", "")
- Job duration (global, per project and/or event, per job name)
- Job status ("", "", "")
- Running Events
- Running Workers
- Running Jobs
- (As extrapolation, we already have the Pending Events(Workers) metric mentioned in the description... perhaps similar metrics for all viable Event(Worker) statuses? ... Timed out, Failed, etc.)
- Apiserver metrics (maybe REST status codes for requests? Response times?)
- Event types/sources
- Users
- Projects
- (maybe the three above are not so much metrics but at least graph-able/visualize-able, e.g. project count, project names, etc.)
I'm sure there's a lot more... hopefully this'll spark ideas/discussion.
 vdice
on 22 Jun 2021
vdice
on 22 Jun 2021
@vdice Thank you for these suggestions! I think most, if not all of these are valid metrics that I can implement. If you want to get a feel for how Prometheus/Grafana is currently implemented for Brigade, I have all of my work on this repo.
 willie-yao
on 23 Jun 2021
willie-yao
on 23 Jun 2021
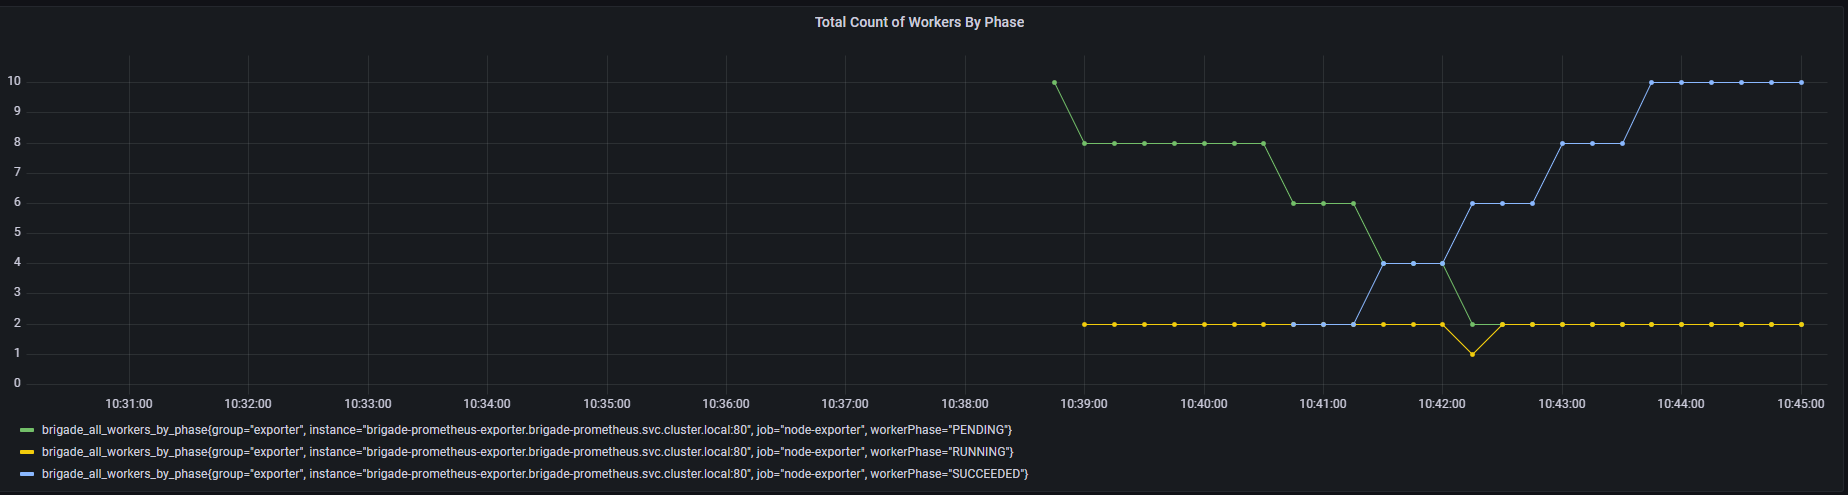
Added a metric that tracks the number of workers that are in each phase. I figured out how to create a time series that showed each status as a different line. Since it's not possible to display string information through Prometheus, would a visualization like this be sufficient for a worker status metric?
willie-yao
on 23 Jun 2021
Just throwing this out there: Based on our own usage of Brigade 1.x, it's likely that one instance of Brigade 2 could have many, many projects. So any metrics _by project_ might produce graphs that are too noisy to be useful.
That said... if we even think something _might_ be useful, implement it. After a couple weeks of dogfooding, we'll know what metrics were useful and which weren't and we can cut anything that isn't valuable.
krancour
on 23 Jun 2021
I agree. I'll avoid making any metrics by project for now, but if anything changes in the future, it will be very easy to change metrics to separate by a different value. This one in particular is actually a metric by worker phase, so the maximum number of lines should be the number of worker phases (i think it's 9).
willie-yao
on 23 Jun 2021
This one in particular is actually a metric by worker phase, so the maximum number of lines should be the number of worker phases (i think it's 9).
Not too many lines, _but_ one might naturally expect that the number of jobs and workers in states like succeeded or failed grows very large over time, while the numbers that are running will be very low, and the number pending will depend on volumes. As the number of successes or failures grows, the scale of the the graph changes, with an ever-increasing upper bound. What you end up with are trend lines for success and failure that go up and to the right forever and pretty much horizontal lines visually indistinguishable from zero for everything else... and then the question becomes: what useful information can be discerned form that?
Again... better to start with more and cut things later, so by all means, please do experiment. My intuition tells me, however, that we may, in general, find more "focused" metrics more meaningful. Gauges are great, for instance, because they tell me what's going on _right now_. "How backed up is the system _right now?_" Histograms with fewer trend lines might also be useful. A histogram of pending events only might visually give me a sense that we're getting backed up at a particular time of day or on a certain day of the week. That's actionable intel for an operator who can then resize their kubernetes cluster and fine-tune the max concurrent workers and jobs.
krancour
on 23 Jun 2021
Since it's not possible to display string information through Prometheus, would a visualization like this be sufficient for a worker status metric?
Nice graph! Yea, I think so.
vdice
on 23 Jun 2021
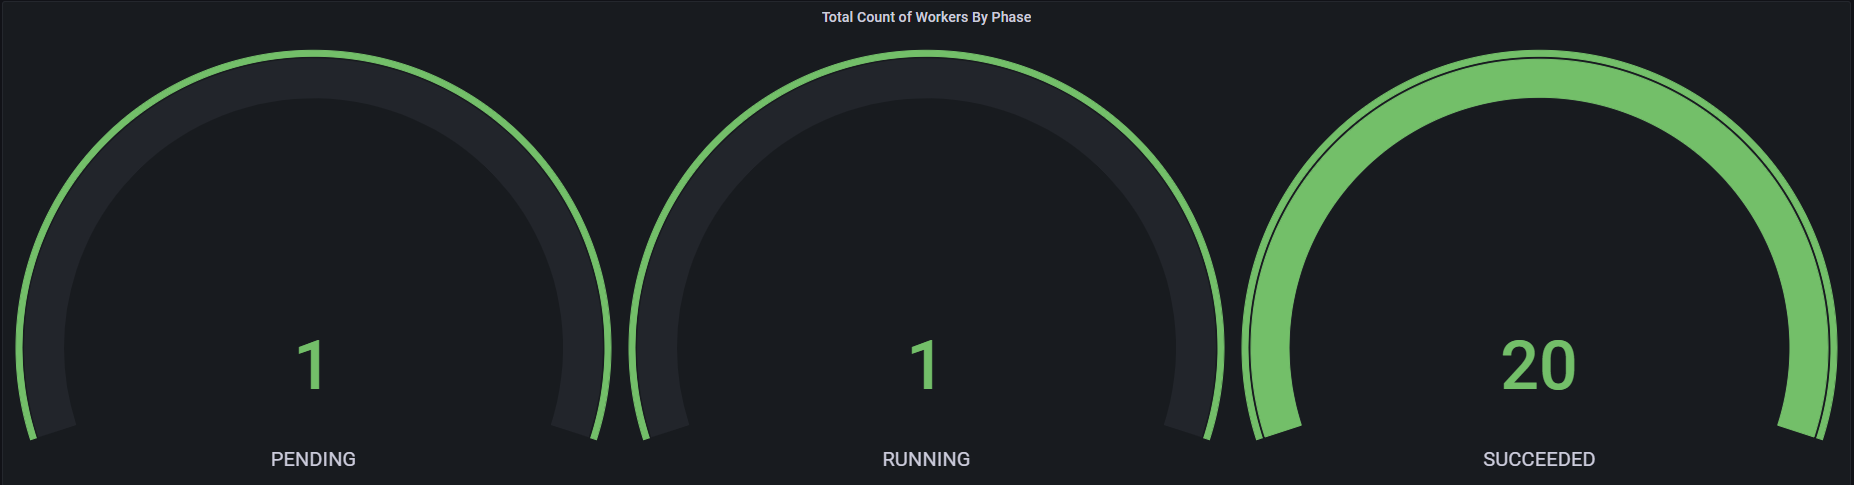
As the number of successes or failures grows, the scale of the the graph changes, with an ever-increasing upper bound
This is definitely true. I forgot the Grafana also supports other visualizations for vectors, like multiple gauges. I think this might be more helpful than a time series.
willie-yao
on 23 Jun 2021
Ah, good call. Yup, those gauges seem preferable for this use case.
vdice
on 23 Jun 2021
Yes... very nice.
krancour
on 23 Jun 2021
Here's how the dashboard looks as of now out of the box. I implemented most of the metrics that would be useful and possible under the scope of the Brigade 2 SDK. I wasn't able to get job duration and status like I did for workers, because it's not possible to list out all jobs by status through the SDK in the same way as workers. Let me know if you guys has any thoughts or suggestions!

willie-yao
on 25 Jun 2021
Related issues
 rmb938
·
6Comments
rmb938
·
6Comments
 radu-matei
·
5Comments
radu-matei
·
5Comments
 carolynvs
·
5Comments
radu-matei
·
4Comments
carolynvs
·
5Comments
radu-matei
·
4Comments
 philmay
·
4Comments
philmay
·
4Comments
Most helpful comment
This is definitely true. I forgot the Grafana also supports other visualizations for vectors, like multiple gauges. I think this might be more helpful than a time series.
