Bokeh: Feature Request Mute legend entries by default
For example:
https://bokeh.pydata.org/en/latest/docs/gallery/logaxis.html
If you have a lot of different lines you also have a lot of entries in the legends. It is already possible to mute/hide legend entries. But i think it is not possible to unselect certain entries by default. I mean image you have 30 lines and you want to compare 2 :) So You have to click 28 times to get the view you want, it would be easier to hide entries by default
discussion
 cheveyo20
>All comments
Actually, this is already possible, you can set muted or visible properties on the renderers themselves:
import pandas as pd
from bokeh.palettes import Spectral4
from bokeh.plotting import figure, output_file, show
from bokeh.sampledata.stocks import AAPL, IBM, MSFT, GOOG
p = figure(plot_width=800, plot_height=250, x_axis_type='datetime')
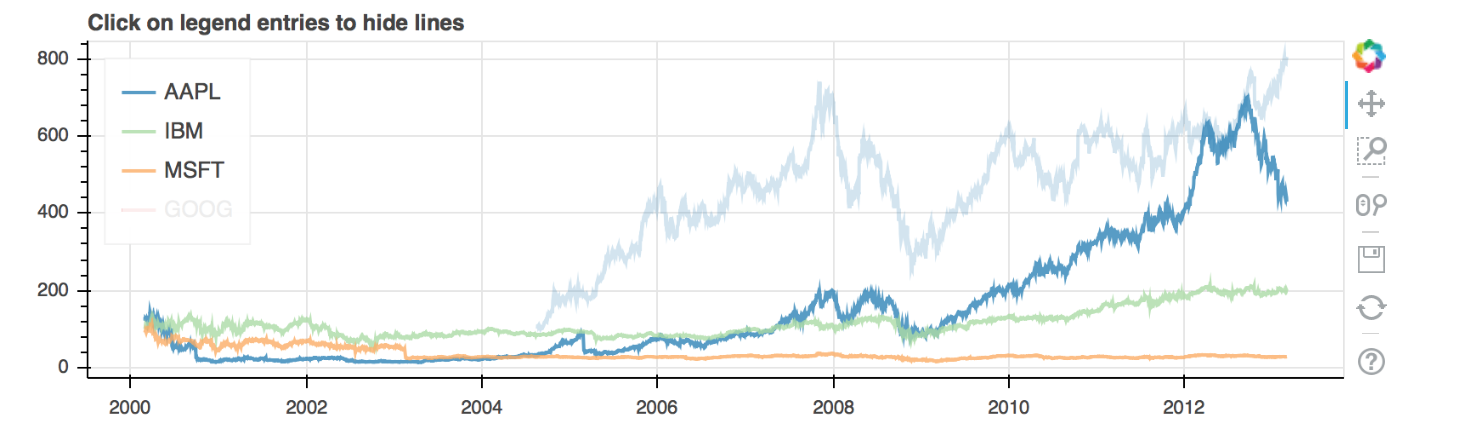
p.title.text = 'Click on legend entries to hide lines'
for data, name, color in zip([AAPL, IBM, MSFT, GOOG], ["AAPL", "IBM", "MSFT", "GOOG"], Spectral4):
df = pd.DataFrame(data)
df['date'] = pd.to_datetime(df['date'])
r = p.line(df['date'], df['close'], line_width=2, color=color, alpha=0.8, legend=name, muted_alpha=0.2)
# mute the last renderer from the loop as an example
r.muted = True
p.legend.location = 'top_left'
p.legend.click_policy = 'mute'
output_file('interactive_legend.html', title='interactive_legend.py example')
show(p)
 bryevdv
on 27 Sep 2017
bryevdv
on 27 Sep 2017
👍9
🎉3
Was this page helpful?
0 / 5 - 0 ratings
Related issues
 tommycarstensen
·
4Comments
bryevdv
·
3Comments
tommycarstensen
·
4Comments
bryevdv
·
3Comments
 abdelwahed
·
4Comments
abdelwahed
·
4Comments
 cyrusmaher
·
3Comments
cyrusmaher
·
3Comments
 samhile
·
3Comments
samhile
·
3Comments
Most helpful comment
Actually, this is already possible, you can set
mutedorvisibleproperties on the renderers themselves: