Blueprint: Table performance degradation with 1.20 (batching malfunctioning?)
Bug report
- __Package version(s)__: 1.20
- __Browser and OS versions__: Latest Chrome, Windows 8.1 Pro
Steps to reproduce
- Add a large table, with fast rendering cells
- Scroll around
Actual behavior
After upgrading to 1.20 it was immeditely obvious that something had gone horribly wrong, as all tables in our application were rendering visibly slowly, both for initial render and updates during scrolling.
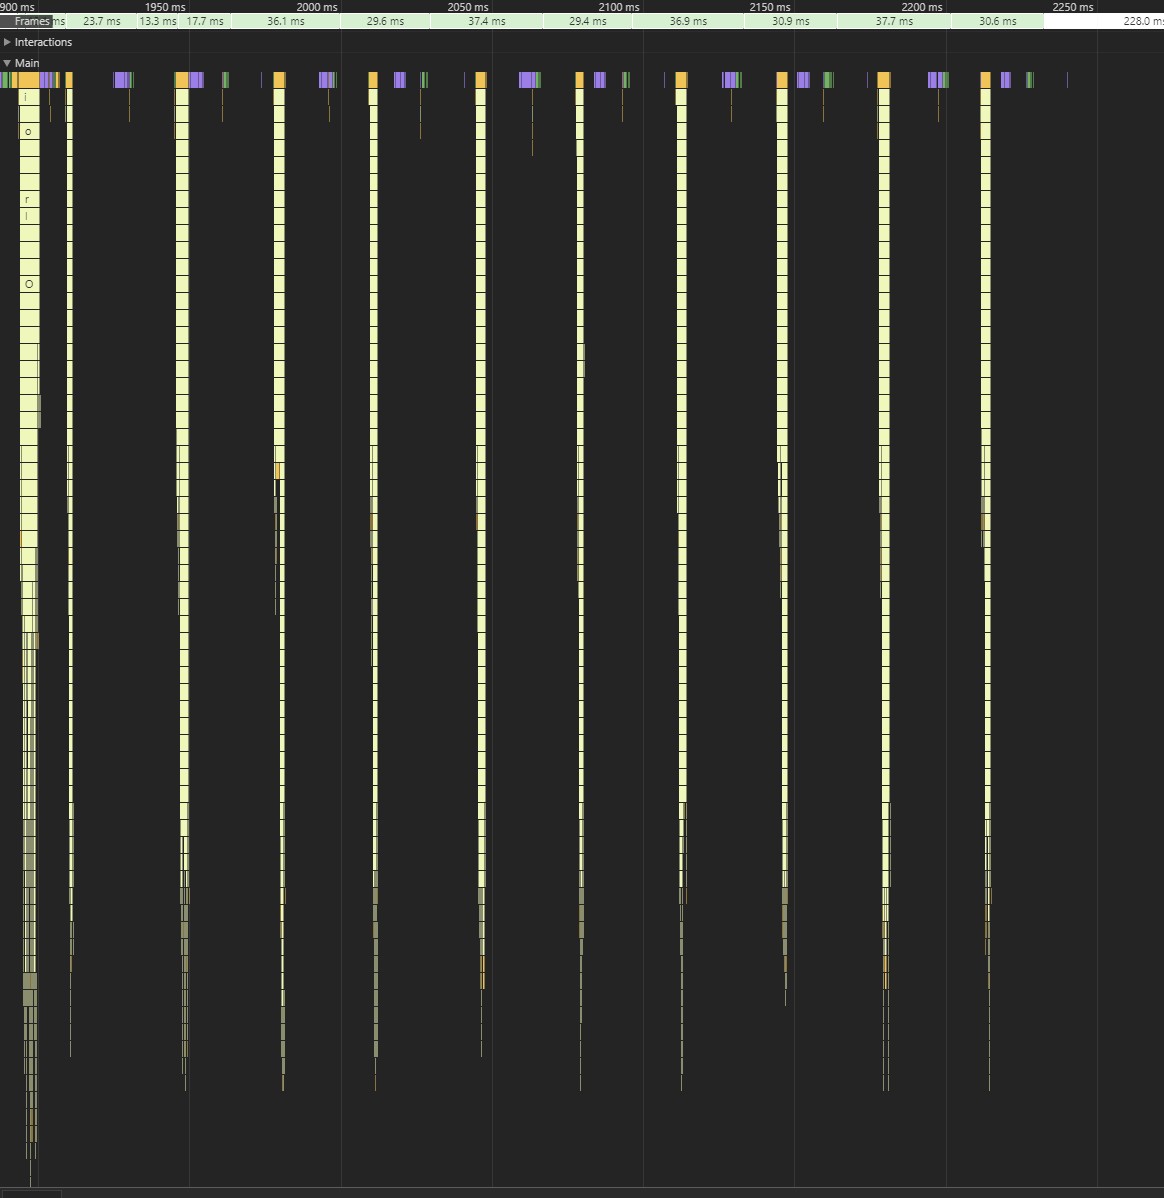
Chrome flame graph shows that total duration for rendering a typical table update has gone from 25-50ms in v1.15 to 250-500ms in v1.20.
Expected behavior
- Same total table rendering duration as in 1.15
Comments
Looks like the batch rendering PR (https://github.com/palantir/blueprint/pull/1201) is malfunctioning horribly in some situations.
I think in future it would be better if you'd add this kind of risky features initially as "opt-in", and enable them by default only after significant real-world feedback from users.
[edit] The attached flame graph is a single table update in 1.20. Notice how sparsely the batches execute.
 henrify
All 17 comments
@henrify Can you give more details about your setup and how you're using the table? What type of cells are you using? This is the first time we see that, we've had great perf improvements with the batching feature so far.
 llorca
on 20 Jul 2017
llorca
on 20 Jul 2017
@llorca Thanks for your fast reply.
The "setup" is React 15.6.1 in production mode, Webpack with uglify and Typescript 2.3, and the test setup is 4x4ghz, 32gb ram, fast gpu, running latest chrome on win 8.1
This affects every table in our application, and there really isn't any common theme for "how we are using the tables". They range from 100 to 100000+ rows, from single column to 20+, with cells that render simple string or complex dom.
Please find below two concrete examples, and let me know if i can provide any more info on this.
Table A
60 rows displayed, 8 columns with row header, each cell has single child component with key of {rowIndex+":"+columnIndex} and renders short string
1.15
45ms for single scroll wheel turn (jumps 3 rows)
150ms for full page jump (clicking on scrollbar)
1.20
25+18ms [2 renders] for single scroll wheel turn
770ms [24 renders] for full page jump, table draws visibly in batches
Table B
70 rows displayed, 1 column without row header, each cell has single child component with domain key and renders complex DOM
1.15
11ms for single scroll
50ms for full page jump
1.20
10ms [1 render] for single scroll
90ms [3 renders] for full page jump, with visible flickering like artefact
(The timings for dragging the thumb of scroll bar are similar to the "full page jump" times, e.g. Table A takes ~770ms to draw after using scroll bar)
henrify
on 21 Jul 2017
@henrify a minimal repro in a Gist or JSFiddle would be really helpful for us to look into this issue. Does it happen with the Blueprint docs on your computer as well?
@tgreenwatts have you noticed any batched rendering performance differences on Windows vs. Mac? requestAnimationFrame might be behaving differently across OSs.
 adidahiya
on 21 Jul 2017
adidahiya
on 21 Jul 2017
@adidahiya Actually the Blueprint docs table has the exact same behaviour. As the table is so small, the effect is not as clearly visible, but it is exactly same.
As you already have repro in your own docs, i'm not going to produce separate Gist on this.
Just increase the size of the table and load more data to it, and you should see the effect very clearly on affected computers/browsers/whatever is the factor that breaks this.
henrify
on 21 Jul 2017
I hadn't noticed anything but I will try repro-ing with the team in person tomorrow
 tgreenwatts
on 21 Jul 2017
tgreenwatts
on 21 Jul 2017
Just a hypothesis:
Flame graph from the docs table shows rendering in 5 batches, each about 50ms, in exactly same style "sparse" spikes as in the flame graph I attached before.
The spikes - "user land" cell rendering work - take 2ms per batch, and the rest of 48ms is recalculating styles, updating layer tree etc.
If the 48ms portion is near constant per batch/render, then by dividing 10ms worth of required "user land" work to five batches you would be multiplying the 48ms constant portion by 5x.
henrify
on 21 Jul 2017
@themadcreator can you share your thoughts here? thanks!
llorca
on 21 Jul 2017
@henrify I checked out our docs, didn't notice anything bad. Just to make sure we're on the same page, can you share a GIF of the slowness you're experiencing?
llorca
on 21 Jul 2017
As i mentioned, the effect is not so clearly visible on the docs table, because the table is so small (but it is still there).
I think gif animation would capture it even worse because of low frame rate.
How about you increase the table height and feed it more data, and if you still cannot see the problem, give me URL of the bigger table and i send you back gif animation and flame graph of what i'm seeing on my end?
henrify
on 21 Jul 2017
Here's a big table (customize it with the options on the left side): https://3395-71939872-gh.circle-artifacts.com/0/home/ubuntu/blueprint/packages/table/preview/index.html
Try to repro and send out that GIF + flame graph! Thank you 👍
llorca
on 22 Jul 2017
@llorca Great, the problem repros 100% on that.
Gif below, and the i've attached the flame graph as original .json profile so you can dive in.
commodore-64-listing-floppy-drive-contents.zip
henrify
on 22 Jul 2017
Thanks, that's helpful. What you're seeing and experiencing here is exactly what's expected: our batcher renders 20 cells at every frame.
The point of the batcher is to improve overall performance by keeping the table responsive & scrollable (rest of the UI too) even when your table contains heavy, complex cells. Before we had the batcher, you would barely be able to scroll a large table rendering complex cells.
We plan on parametrizing some values that should help you customize this behavior, and render a lot more cells per frame if you desire so. I created a specific issue to track this, you can follow along there: https://github.com/palantir/blueprint/issues/1374
llorca
on 22 Jul 2017
Thanks. I get the overall design goal, but I strongly disagree with the implementation approach:
It seems that the only thing you achieve with batching is displaying couple of rows at the top of table while scrolling, but the user cannot anyway read the rows, because they are changing all the time.
The cost of displaying those unreadable rows at the top is that the total rendering time of the table is 5-10x slower AND it looks visually broken with number of different visual glitches that depend on what you are doing and how fast you are scrolling.
If the table renders too slow during scrolling, why don't you just disable the rendering and when scrolling stops the entire table is displayed in single fast render?
That approach would allow keeping large tables responsive, the UI free of visual glitches, and then table rendering at full speed when the scrolling stops. Overall seems far superior UX.
henrify
on 22 Jul 2017
Another idea is, instead of a prop useBatchRendering?: boolean;, to add a renderOptimizationMode?: RenderOptimizationMode; prop (working title) that accepts values like:
RenderOptimizationMode.BATCH: render as many new cells as possible per frame, and no more (this is what we currently have, and this scheme also has the strongest guarantee against bringing the UI to a crawl)RenderOptimizationMode.DEBOUNCE: debounce scrolling, hiding cells on scroll start and rendering cells all at once after the scroll event finishes (this has a risk of locking the UI if the cells are small/numerous/complex/have truncated content, e.g.)RenderOptimizationMode.NONE: no optimizations, just render everything (useful for smaller tables, but can easily bring the UI to a crawl on larger tables)
(Maybe also a RenderOptimizationMode.THROTTLE for throttling scrolling).
 cmslewis
on 22 Jul 2017
cmslewis
on 22 Jul 2017
@cmslewis Sounds awesome. Further ideas:
Instead of batch size, better control prop could be "max batch duration", as that would automatically account for performance differences between clients, and also eliminate need of tuning batch size per-table.
Another possible mode is REDUCE_RENDERS, which would redraw the enitre table sometimes during scrolling, but not on every mouse scroll event. I believe that this mode would be optimal for our use: the only problem we currently have is that with free-spinning scroll wheels the scrolling can continue after user has abrubtly stopped the scroll wheel from spinning. We could still do e.g. 10 frames per second, but not quite as many as the free spinning wheels at full speed generate.
The DEBOUNCE mode could still use "after scroll" redraw batching, with large default batch size, which would eliminate the UI lockup risk. And if initial blanking out of every cell has risk of being slow, you could just slap single blank div on top of the table body.
[edit] Or is the THROTTLE mode same as what i meant by REDUCE_RENDERS?
henrify
on 23 Jul 2017
To your [edit]: yep, that's what I meant!
FYI I'm currently in the midst of a huge internal refactor to get the new frozen columns/rows feature working, then we have Hack Week here at Palantir, so tangible progress on this issue is going to be at least a couple weeks out.
cmslewis
on 23 Jul 2017
Perfect. In that case I'll have a Throttle, cooked well done, without Batching, and a Diet Coke please.
Thanks everybody for fast replies & feel free to close this issue.
henrify
on 25 Jul 2017
Related issues
 vilav
·
3Comments
vilav
·
3Comments
 brsanthu
·
3Comments
brsanthu
·
3Comments
 ghost
·
3Comments
ghost
·
3Comments
 ernestofreyreg
·
3Comments
ernestofreyreg
·
3Comments
 tomzaku
·
3Comments
tomzaku
·
3Comments
Most helpful comment
Another idea is, instead of a prop
useBatchRendering?: boolean;, to add arenderOptimizationMode?: RenderOptimizationMode;prop (working title) that accepts values like:RenderOptimizationMode.BATCH: render as many new cells as possible per frame, and no more (this is what we currently have, and this scheme also has the strongest guarantee against bringing the UI to a crawl)RenderOptimizationMode.DEBOUNCE: debounce scrolling, hiding cells on scroll start and rendering cells all at once after the scroll event finishes (this has a risk of locking the UI if the cells are small/numerous/complex/have truncated content, e.g.)RenderOptimizationMode.NONE: no optimizations, just render everything (useful for smaller tables, but can easily bring the UI to a crawl on larger tables)(Maybe also a
RenderOptimizationMode.THROTTLEfor throttling scrolling).