First of all, thank you again for making these great looking Blazor components.
Unfortunately, I have again big doubts about the performance - I don't know whether the problem is in Blazorise, Blazor or WebAssembly.
I performed a test consisting of opening the following five pages in "UI Elements" menu one by one: Buttons, Modals, Progress bars, Typography, and Collapse. I tested this in Google Chrome on a Dell Latitude 5580 laptop.
I had to wait about one second for each of these pages, even though they haven't downloaded anything from the Internet (I checked it in Developers Tools (F12) in the "Network" tab).
I checked in the "Performance > Summary" in Developers Tools, that clicking on these 5 menu items resulted in the following CPU load:
Loading: 71 ms
Scripting: 4430 ms
Rendering: 111 ms
Painting: 46 ms
System: 111 ms
The one second CPU computing to load such simple looking page seems like a lot. This is quite noticeable when navigating. Where is the problem: in Blazorise, Blazor or WebAssembly? And can it be fixed?
 iwis
iwis
All 16 comments
There is definitely some room for optimizations, I can confess that. For example, the most critical parts are:
- Duplicate rendering of components that are overridden by the providers.
- Fluent builders(ColumnsSize, Margin, Padding, etc.) regenerate on every re-render.
For the first problem, I had to wait for .Net 5 and the new IComponentActivator that I helped to create. So this problem will soon finally be done. The second problem also needs some optimizations, mainly by doing smarted catching of already used combinations. Both of these problems are long known and will be taken care of sooner or later.
The metrics you posted seem fairly OK, time-wise, except for the scripting part. Over 4 seconds is really long and I have no idea why it happens to you. I never had that problem and I have done some complicated pages.
So all-in-all, optimizations are coming but for now, it's not my main concern. I'm more focused on a clean API and to finally bring Blazorise to v1.0. And hopefully, by that time all of these issues will go away.
 stsrki
on 25 Sep 2020
stsrki
on 25 Sep 2020
Thank you for the reply!
I attached a file with the recorded data from the test, which can be loaded in Google Chrome Developers Tools by pressing "Performance" > "Load profile ..." icon (after unzipping). Maybe it can be helpful.
The file: Profile-20200925T231512.zip
I don't understand what you are writing about because I haven't used Blazor yet - I only check if it is something ready to learn and use ;) I am also waiting for .Net 5. I don't know if it will be enough to make everything ok, or we will have to wait for something from WebAssembly or Blazor, for example WebAssembly garbage collection, or ahead-of-time (AOT) compilation.
I hope Blazorise 1.0 will be a big thing! Maybe finally we will be able to write backend and frontend in a language other than JavaScript/TypeScript! Or maybe it is not so simple? ...
Edit:
In https://github.com/dotnet/aspnetcore/issues/5466 issue people are also reporting problems with loading time of Blazor pages.
iwis
on 25 Sep 2020
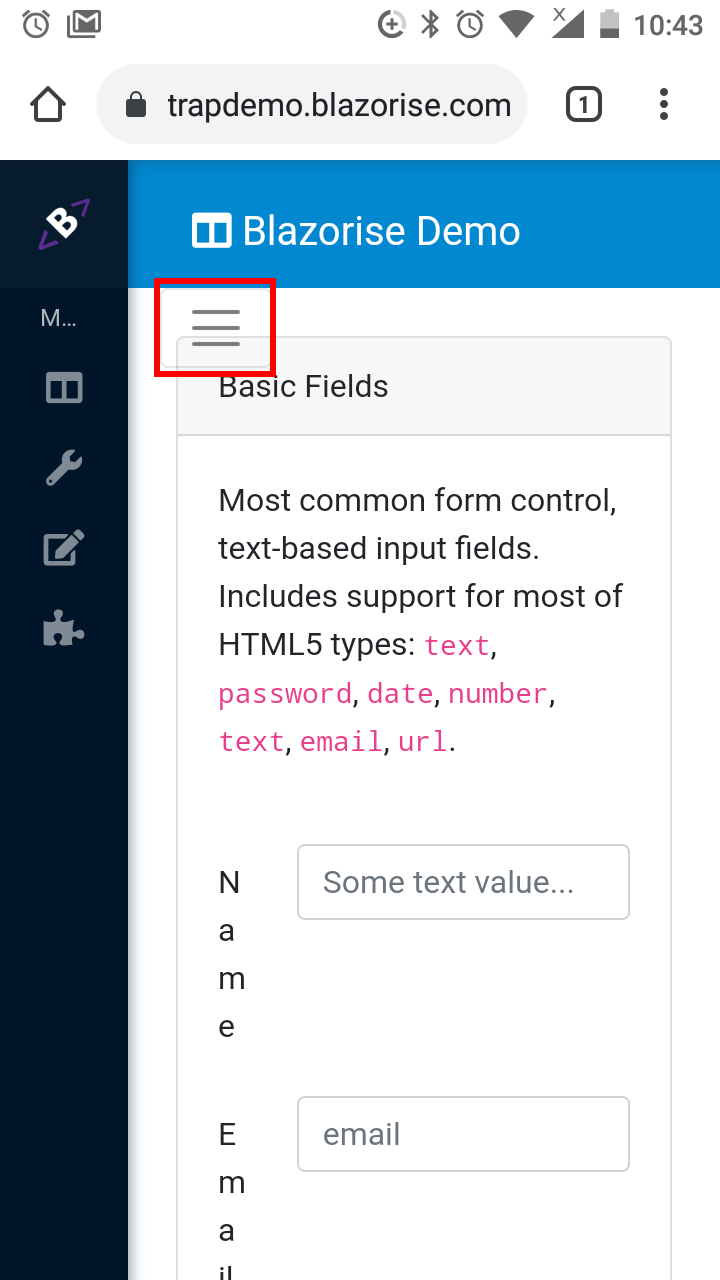
@stsrki After trying the demos on my mobile I think you need to have a loading indicator that pops up, perhaps full page with an overlay?
When a page is loading, it freezes and you can continue to click... Then all of a sudden all of your click events fire.
So I opened a page, the page froze, and then I clicked on the menu to open it, then the menu opened after it had finished loading, but if you had an overlay that would prevent any clicks.
Perhaps you could figure out a way to make this a component?
Then developers could add their own logo inside a loading circle for eg.
<LoadingPanel ImageUrl="" LoadingText="">
... Slow loading components ...
</LoadingPanel>
 LukeTOBrien
on 6 Oct 2020
LukeTOBrien
on 6 Oct 2020
@MitchellNZ already had a similar component in mind but I think the one for the entire layout could also be good to have.
@LukeTOBrien Can you tell us what were you clicking? So we can reproduce it.
stsrki
on 6 Oct 2020
Choose any page and then open the menu 👇
It freeze and then suddenly pops out.
Also to mention that for my app I am using JS interop and the Window.matchMedia to detect if the user is on a mobile device, so if they are on mobile you can redirect to a page designed spcificly for mobile:
Inside my index.razor,cs:
        protected override async Task OnInitializedAsync()
        {
            TransferService.IsMobile = await Js.IsMobile();
            if (TransferService.IsMobile)
            {
                NavigationManager.NavigateTo("/m-startup");
            }
            else
            {
                NavigationManager.NavigateTo("/startup");
            }
        }
I also use HammerJS to detect the swipe gesture on mobile, so you could add swipe open/close to your menu component. 😉
LukeTOBrien
on 6 Oct 2020
The floating button problem should be fixed in the newest version. I believe @MitchellNZ can confirm this?! But it's still not online so it cannot be seen in practice.
As of your suggestion for other libraries. I tend to use only native Blazor in the core Blazorise, but maybe it can be done for one of the extensions.
stsrki
on 6 Oct 2020
@stsrki @LukeTOBrien I have added a loading overlay to the root Layout component in 0.9.2 (see #1084).
But thank you for reminding me to add docs! 👍
As for the floating button issue, it should also be fixed in 0.9.2 (see #1042).
 MitchellNZ
on 7 Oct 2020
MitchellNZ
on 7 Oct 2020
Thank you @MitchellNZ for reminding me of #1084, I forgot about that one :)
stsrki
on 7 Oct 2020
I tried this solution https://blog.mistermagoo.dev/quick-helper-for-blazor-performance-ckg790tsi02fz9cs1d6zze5ug from @SQL-MisterMagoo to see what are the bottleneck in Blazorise. I found that most of the re-rendering comes from Bar item components.
@MitchellNZ I suppose this is the reason because we have a lot of child-to-parent relationships needed to make it work properly. For the next milestone (0.9.3), I will implement .Net 5 IComponentActivator and see how it behaves after that. Then we can start seeing into some optimizations.
stsrki
on 13 Oct 2020
@stsrki Yes, I think IComponentActivator will help the Bar a lot!
Another thing I've been thinking about for helping performance on the Bar is; creating a service to manage some of the nested CascadingParameters etc.
MitchellNZ
on 13 Oct 2020
@MitchellNZ :) I was thinking of doing the exact same thing this afternoon, create a service for Bar component(s). I guess we're both on the same track haha
stsrki
on 13 Oct 2020
@stsrki If you are looking for performance gains, you should look at using IsFixed on CascadingValues where the Value never changes, like here
https://github.com/stsrki/Blazorise/blob/60fb822227dba17c8b675246e6cdcd019f566f86/Source/Blazorise/Bar.razor#L4
For reference: https://docs.microsoft.com/en-us/dotnet/api/microsoft.aspnetcore.components.cascadingvalue-1.isfixed?view=aspnetcore-3.1
 SQL-MisterMagoo
on 14 Oct 2020
SQL-MisterMagoo
on 14 Oct 2020
@SQL-MisterMagoo Being it a reference <CascadingValue Value=this>, IsFixed makes sense in this case. Not sure how much speed gain it will give us but we'll try.
stsrki
on 14 Oct 2020
@stsrki,
Do the Buttons, Modals, Progress bars, Typography, and Collapse pages have now roughly the same number of components as when I was testing them in September? If yes, then Blazorise 0.9.2 works about 2-3 times faster than Blazorise 0.9.1. I think that now Blazorise is fast enough to be used without noticing that there is something wrong with it.
Congratulations! It is a big step forward considering nobody knew if Blazor WebAssembly will ever be usable (It should be even faster to be more nice, especially on older smartphones).
Currently, the total time of opening these 5 web pages in Blazorise 0.9.2 is:
Loading:     10 ms
Scripting: 1620 ms
Rendering:  142 ms
Painting:    67 ms
System:     123 ms
so on average about 390 ms of CPU activity per one web page.
For Blazorise 0.9.1 in September it was about 2.5 times longer:
Loading:     71 ms
Scripting: 4430 ms
Rendering:  111 ms
Painting:    46 ms
System:     111 ms
i.e. on average about 950 ms of CPU activity per one web page.
I also need to add that I now recall I reduced performance of my CPU last year in order to mute my laptop fan. After switching from "Quiet" to "Optimized" in "Dell Command | Power Manager", the time of opening the web pages is reduced additionally by several dozen percent. I don't write this time here, because I have quite fast laptop, and we should try to make Blazor/Blazorise work quickly not only on the fastest computers.
iwis
on 13 Nov 2020
I would like to take credit for this but it's all coming from Blazor team and optimizations done in Net 5 :)
For the next milestone I plan to optimize Blazorise with new component activator which will also speed it a little.
stsrki
on 14 Nov 2020
I will close this now. Component activator is already implemented in the latest preview and it's now much faster, especially since .Net 5 was a lot faster.
From now the biggest performance improvements can be mostly done by the Blazor team. All I can do are some small optimizations on utilities and fluent builder and that I will do anyway.
stsrki
on 1 Dec 2020
Related issues
 satwo
·
5Comments
satwo
·
5Comments
 sroy2020
·
5Comments
sroy2020
·
5Comments
 DDDenisSobek
·
4Comments
stsrki
·
3Comments
DDDenisSobek
·
4Comments
stsrki
·
3Comments
 imtrobin
·
4Comments
imtrobin
·
4Comments
Most helpful comment
I tried this solution https://blog.mistermagoo.dev/quick-helper-for-blazor-performance-ckg790tsi02fz9cs1d6zze5ug from @SQL-MisterMagoo to see what are the bottleneck in Blazorise. I found that most of the re-rendering comes from Bar item components.
@MitchellNZ I suppose this is the reason because we have a lot of child-to-parent relationships needed to make it work properly. For the next milestone (0.9.3), I will implement .Net 5
IComponentActivatorand see how it behaves after that. Then we can start seeing into some optimizations.