Binary-bot: How to get graph data of the balls?
strategy
 drezende89
All 3 comments
Eu acho que eles são feitos usando o movimento "zig zag". nós não temos isso. você poderia tentar usar "hma" + histograma macd
 ghost
on 5 Apr 2019
ghost
on 5 Apr 2019
👍1
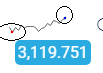
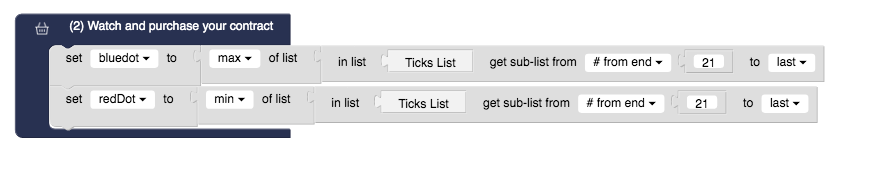
te red dot is the lowest tick in latest 21 ticks. Blue dot is the highest of the last 21 ticks. You can get them with the blocks below. This graph is created using the last 21 ticks of the selected market.
 binary-ex-machina
on 8 Apr 2019
binary-ex-machina
on 8 Apr 2019
👍2
te red dot is the lowest tick in latest 21 ticks. Blue dot is the highest of the last 21 ticks. You can get them with the blocks below. This graph is created using the last 21 ticks of the selected market.
thank you very much @binary-ex-machina
drezende89
on 9 Apr 2019
Was this page helpful?
0 / 5 - 0 ratings
Related issues
 navneetsinh
·
6Comments
navneetsinh
·
6Comments
 willsilvabc
·
5Comments
willsilvabc
·
5Comments
 virtusasys
·
6Comments
virtusasys
·
6Comments
 Fruitfella
·
3Comments
Fruitfella
·
3Comments
 not-sure-bot
·
6Comments
not-sure-bot
·
6Comments
Most helpful comment
te red dot is the lowest tick in latest 21 ticks. Blue dot is the highest of the last 21 ticks. You can get them with the blocks below. This graph is created using the last 21 ticks of the selected market.