Binary-bot: RSI value in BOT and in the Webtrader Chart not matching
Hello Team,
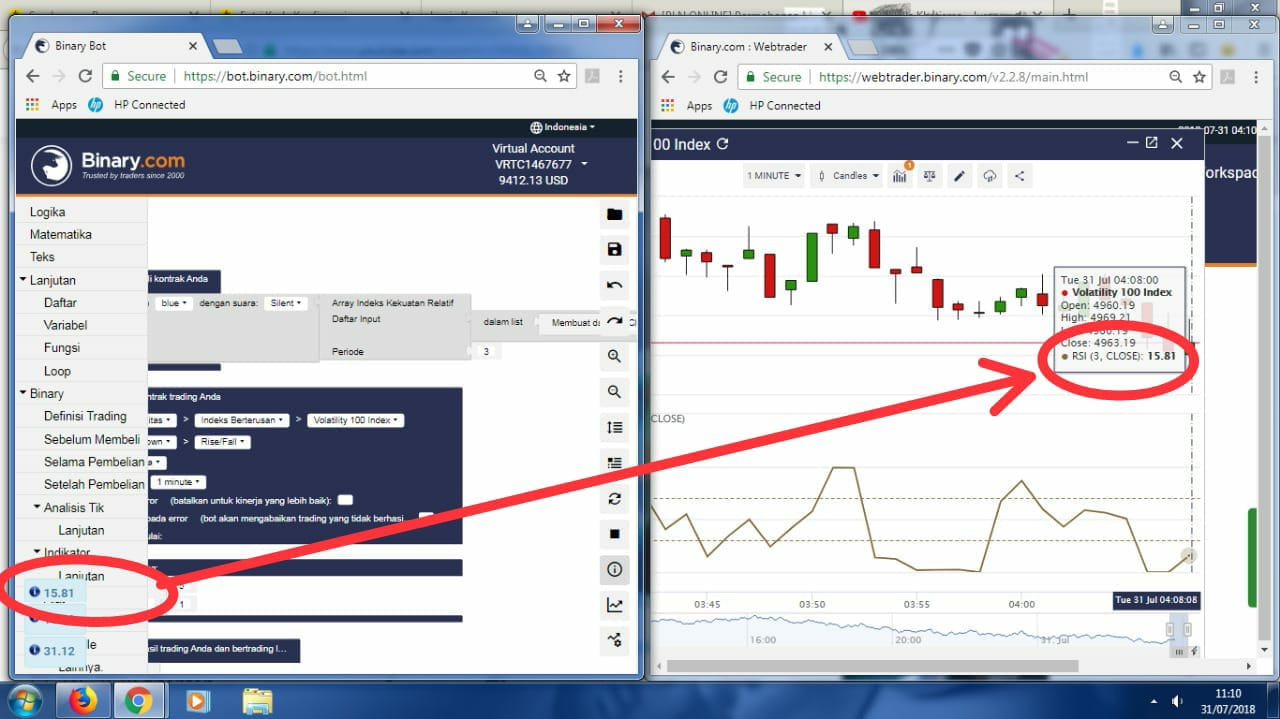
I was trying to implement RSI in one of my BOTs, however when I crosschecked - for the same settings the RSI values obtained for 1 minute candle in the BOT never matched with the RSI values I was seeing on the WebTrader Chart. However the close price of the candle and Bollinger Band values were accurate. Below is the attached screenshot of the same.

Later I tried creating a BOT that obtains Bollinger Band (12,2) upper and lower values, the Close values and RSI(3) values of the PREVIOUS Candle(since it is already closed and finalized unlike the running candle). The issue is seen there are well, Bollinger Band values and Candle Close values are accurate but RSI is not.
I guess the RSI calculation in the BOT is different from the RSI calculation on the Webtrader Chart.
I would like to know how could I match them both and obtain the values as seen on the Webtrader Chart.
I have attached the BOT here for reference.
Thank you and awaiting response.
Regards,
Gopi B C
 gopibc
All 10 comments
The indicator value on the bot is more suitable on the tradingview chart. Could be how to calibrate it differently, to produce a value that is also different
 wijanarkokns
on 30 Jul 2018
wijanarkokns
on 30 Jul 2018
I agree, but my point of view is, if the Close Value of the candles are matching, on the BOT as well as the WebTrader, and Bollinger Band values derived out of Close Values are also matching both on BOT and WebTrader - why should not only RSI values match, as we know even that is calculated out of Close Values of the candles. If Close Values, which is a dataset for both BOT and Webtrader are common and matching, then RSI would not match only because the underlying calculations are different or coded differently. I just want to know how to either match them or correlate them to avoid errors in my analysis and implementation of the same when I am switching between manually trading and BOT.
gopibc
on 30 Jul 2018
https://stockcharts.com/school/doku.php?id=chart_school:technical_indicators:relative_strength_index_rsiif you can make rsi manually. there may be an answer there. and calibration more precisely or closer to the value of webtrader rsi can be found.
wijanarkokns
on 30 Jul 2018
In fact I have tried several RSI calculations by coding it manually in the BOT and also in excel file as well. But I am not getting to match WebTrader and BOT. I mainly need to understand how to fix RSI calculation within the BOT as it appears in Webtrader - if not by in-built RSI function at least by manually calculating then within the BOT.
gopibc
on 30 Jul 2018

wijanarkokns
on 31 Jul 2018
The value of RSI on webtrader can already be applied to the bot. You only need to use a close-down list of candles that have been cropped. If RSI period 3 = >> input list close from the end of the ( period + 1 ) to thelast end.
wijanarkokns
on 31 Jul 2018
wijanarkokns
on 31 Jul 2018

Use the RSI array, the value generated does not need to be re-calibrated. And crop the close list as pict.
wijanarkokns
on 31 Jul 2018
Awesome, thank you so much @wijanarkokns
gopibc
on 31 Jul 2018

u'r wlcme .., @gopibc
wijanarkokns
on 31 Jul 2018
Related issues
 csajkas
·
7Comments
csajkas
·
7Comments
 nextnaro
·
6Comments
nextnaro
·
6Comments
 binarybotbegginer
·
6Comments
binarybotbegginer
·
6Comments
 Fruitfella
·
3Comments
Fruitfella
·
3Comments
 navneetsinh
·
6Comments
navneetsinh
·
6Comments