Billboard.js: is it possible to use custom value ticks?
Description
Hello and thanks for this useful dev!
would it be possible to add support for custom value ticks, so we can present graphs such as:
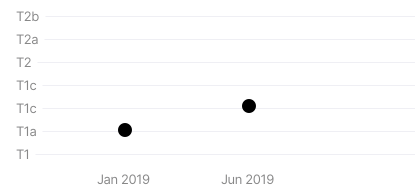
possible data1 values would then be: ["data1", "T1a","T1c"]
Cheers
DT
question
 doubletuna
All 3 comments
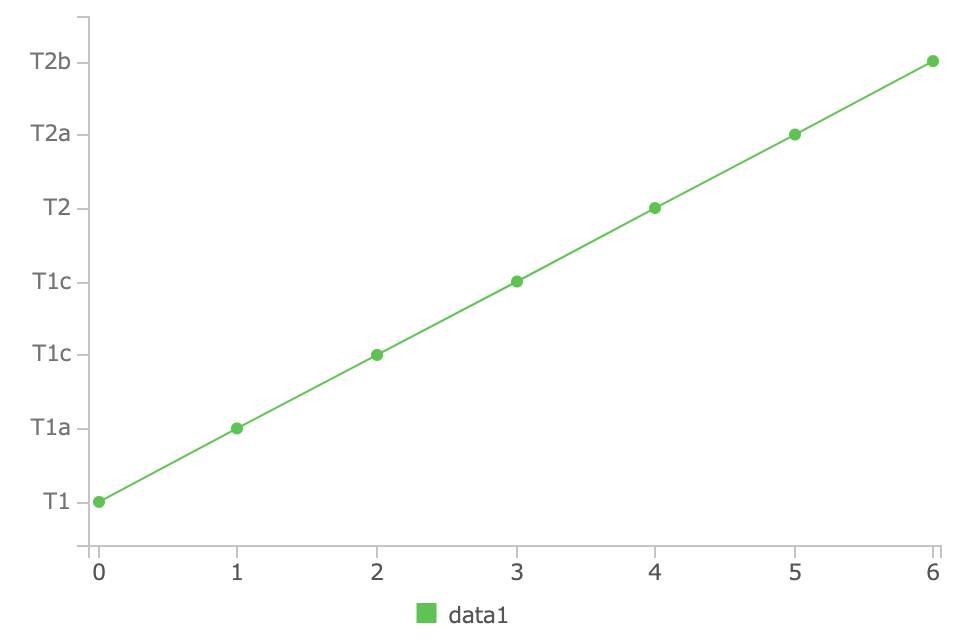
Hi @doubletuna, you can with the combination of the data value and the axis' tick options.
Checkout the example:
 netil
on 3 Sep 2019
netil
on 3 Sep 2019
👍1
@netil awesome! works like a charm
cheers!
doubletuna
on 4 Sep 2019
🎉1
Hello @netil
could you please assist with adding a time series as ticks? (series of scattered dates instead of 0,1,2,3,4,5.. )
cheers
DT
doubletuna
on 24 Sep 2019
Was this page helpful?
0 / 5 - 0 ratings
Related issues
 SoYoung210
·
5Comments
SoYoung210
·
5Comments
 programmiana
·
5Comments
programmiana
·
5Comments
 eweap
·
5Comments
eweap
·
5Comments
 elielr01
·
3Comments
elielr01
·
3Comments
 bogdan-iuga
·
3Comments
bogdan-iuga
·
3Comments