Billboard.js: Can I customize offset of Y axis?
Description
I want to keep the interval of each step of Y axis same. At the same time keeping range of values in line chart of billboard.
Designer's Requirements
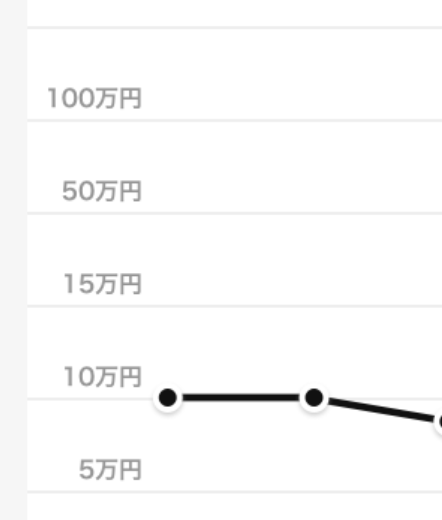
Current view

Steps to check or reproduce
- values:
[1, 5, 10, 50, 100]
axis: {
  y: {
    min: [1, 5, 10, 50, 100][0],
    max: [1, 5, 10, 50, 100][4],
    tick: {
      values: [1, 5, 10, 50, 100],
    },
  },
},
 JaeYeopHan
All 2 comments
Hi @JaeYeopHan, you can do by displaying different numbers on each of y axis tick.
axis: {
    y: {
        min: 0,
        max: 100,
        tick: {
            values: [0, 20, 40, 60, 80, 100],
            format: x => ({0: 0, 20: 5, 40: 10, 60: 15, 80: 50, 100: 100}[x])
        }
    }
}
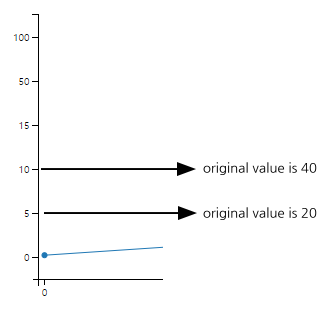
But, as you've been noticed here, this is kinda against on visualizing data in incorrect scale.
The data are visualized according the area and they're scaled based on the amount of the space.
So, in a correct way, this is like:
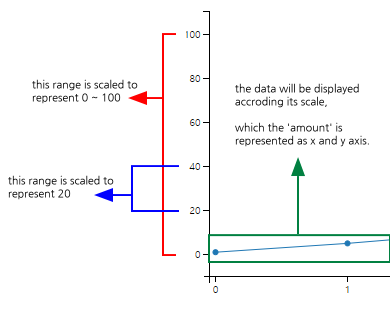
I think this is something strongly for design related needs, which is breaking the correct visualization.
I don't recommend approaching as this way, because simply is not correct way and it is letting to misunderstand the real data.
 netil
on 2 Apr 2019
netil
on 2 Apr 2019
Thank you for quick response! Very useful suggestion. It would be best to consult with the designer and make adjustments.
JaeYeopHan
on 2 Apr 2019
Related issues
 serzhiio
·
4Comments
serzhiio
·
4Comments
 drazik
·
4Comments
drazik
·
4Comments
 nwpappas
·
3Comments
nwpappas
·
3Comments
 AyshvaryaLaxmiK
·
5Comments
AyshvaryaLaxmiK
·
5Comments
 bogdan-iuga
·
3Comments
bogdan-iuga
·
3Comments
Most helpful comment
Hi @JaeYeopHan, you can do by displaying different numbers on each of y axis tick.
But, as you've been noticed here, this is kinda against on visualizing data in incorrect scale.
The data are visualized according the area and they're scaled based on the amount of the space.
So, in a correct way, this is like:
I think this is something strongly for
designrelated needs, which is breaking the correct visualization.I don't recommend approaching as this way, because simply is not
correctway and it is letting to misunderstand therealdata.