Billboard.js: Normalized (100%) Stacked Chart
Carrying this issue over from C3.js:
https://github.com/c3js/c3/issues/142
Here's an example in D3:
https://bl.ocks.org/mbostock/3886394
 ataft
ataft
All 13 comments
Hi @ataft for suggesting.
This seems to be an old request from C3.js.
The basic implementation looks quite simple, but integrating with the current interface is not that easy. It should be considering how to integrate(this should be part of 'bar' type option or as separate type, etc.).
I'll be considering this. If you have any comments will be appreciated :)
 netil
on 25 Oct 2018
netil
on 25 Oct 2018
Great, thanks. Here are a few comments:
- You can stack bar, area, and maybe even line charts. Many libraries present "stacked bar" and "bar" as separate chart types, but I think this is a mistake. Highcharts deals with this property in the chart config setting with
plotOptions.[bar,area,column,line].stacking = ['normal','percent',null] - It should be easy to show values as a percent (maybe even default)
- What people are calling a "bar" chart is really a "column" chart, but I see that BB allows for real bar charts with the
axis.rotatedsetting. I've been wondering for a while now where the true "bar" type was, but then stumbled upon this setting, so maybe it makes sense to have both "column" and "bar" types?
Hopefully this helps a little. I don't particularly like the way BB deals with stacking as "groups" and would prefer that it just have a general stacking setting, but that's probably not a good switch to make at this point. My initial thought is to have this setting as data.stacking = ['normal','percent',null]. If a person used this setting, maybe they wouldn't have to even set the "groups"?
ataft
on 25 Oct 2018
@ataft, thanks for sharing opinions. I agree that the current approach for stacking is little bit unclear, but at this point is difficult having changes on that.
For start, I'll be considering adding some option to make bars to be represented in percentage rather than the values.
netil
on 1 Nov 2018
@ataft, to get to be noticed normalized feature is on working.

The interface will be simply enough as setting true or false.
data: {
    stack: {
    normalize: true
    }
Normalized stacking is done. Try with the nightly build
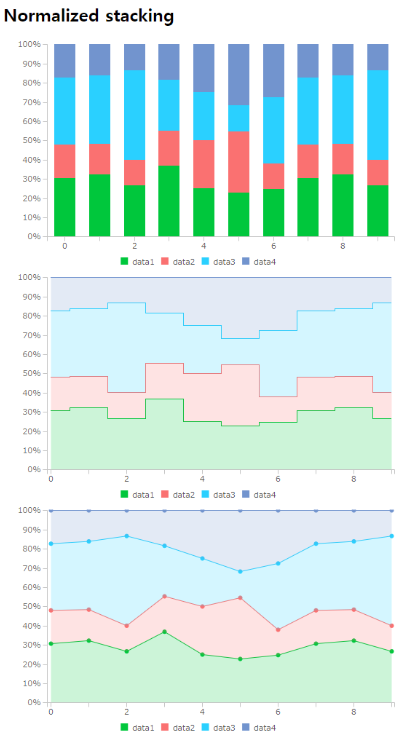
netil
on 8 Nov 2018
Awesome! I like how it show's % on the tooltip as well.
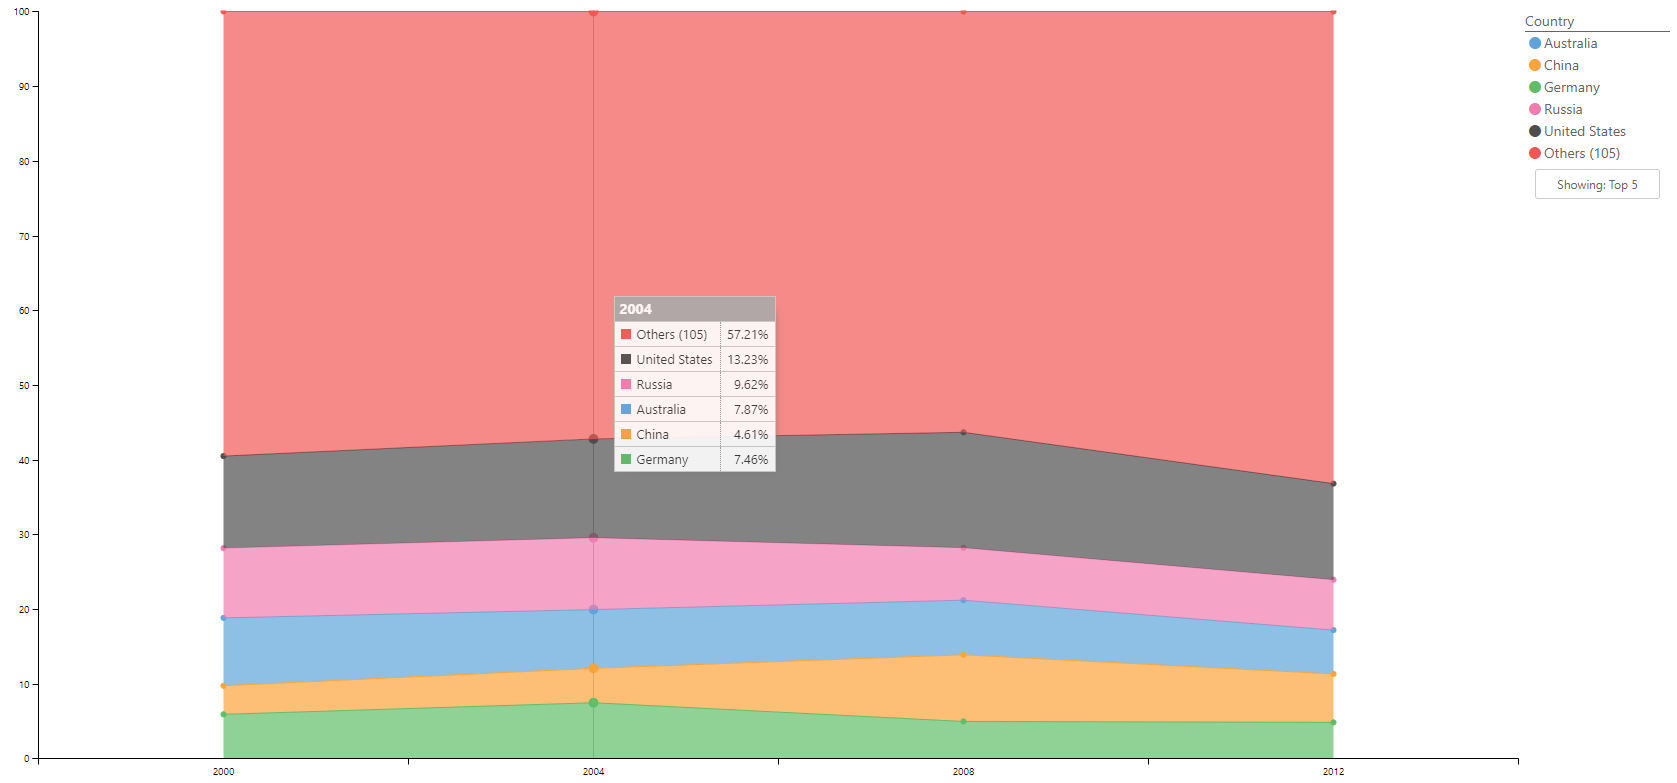
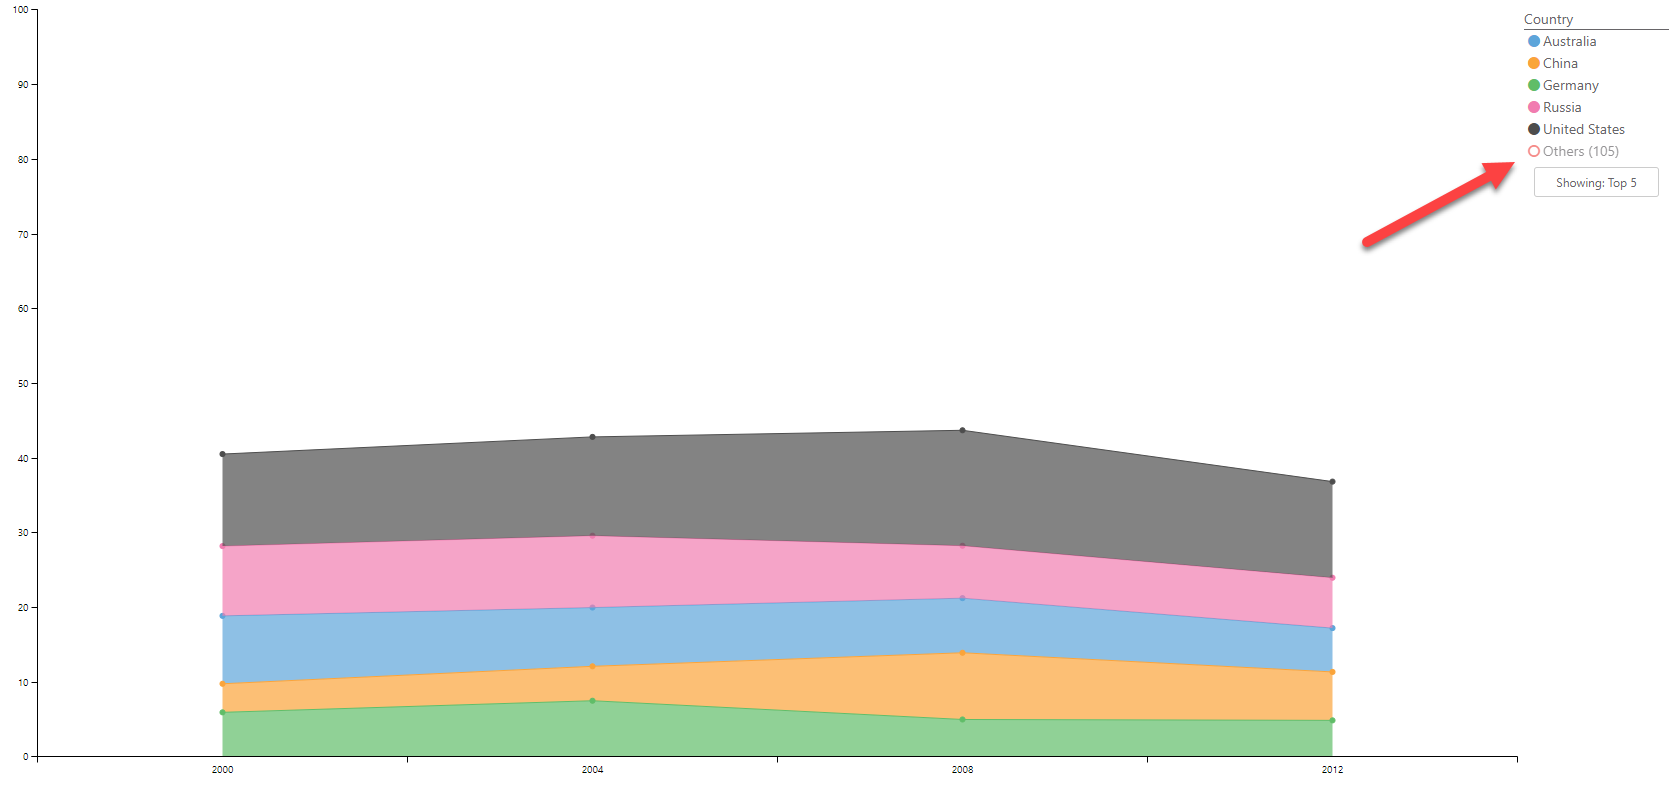
One issue is that it doesn't re-normalize when you toggle legend items. See what happens when I click a legend item:
ataft
on 8 Nov 2018
@ataft done(by #645). Checkout the nightly build.
netil
on 9 Nov 2018
That fix looks great. One more thing: when normalized, the y-scale cuts off the top item and values are not shown:
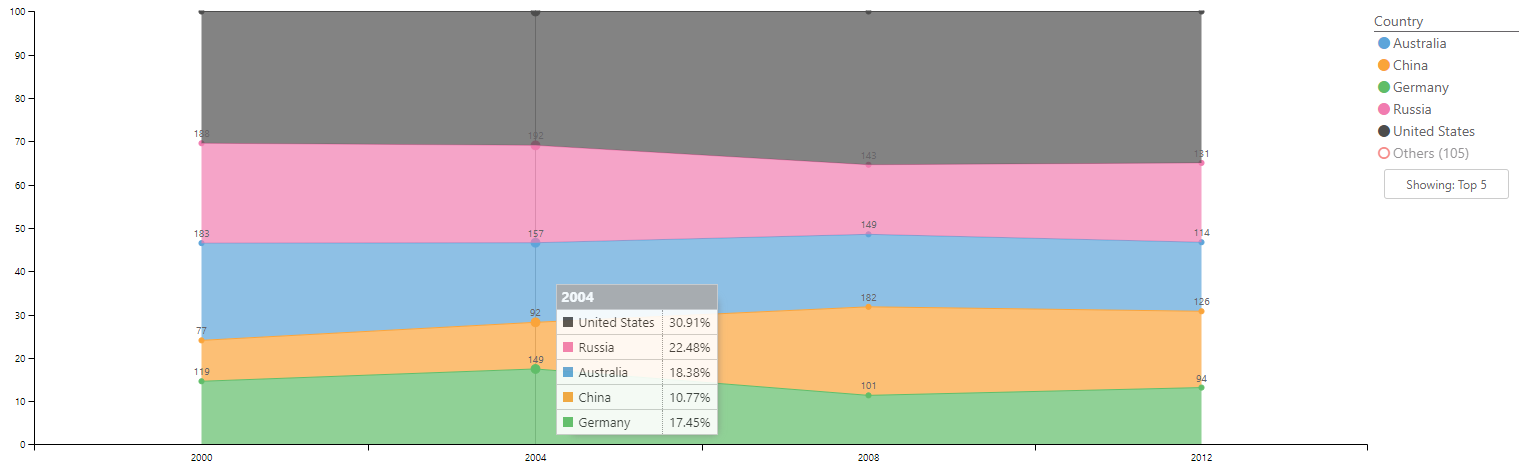
I'll continue to use and test, but thus far it looks great. Thanks!!!
ataft
on 9 Nov 2018
try with the below option.
data: {
    labels: {
        position: {
            y: 20
        }
    }
},
clipPath: false
I've been testing this and everything looks good except one (hopefully last) thing. An error is thrown if one of the groups doesn't have a data point, such as this chart:
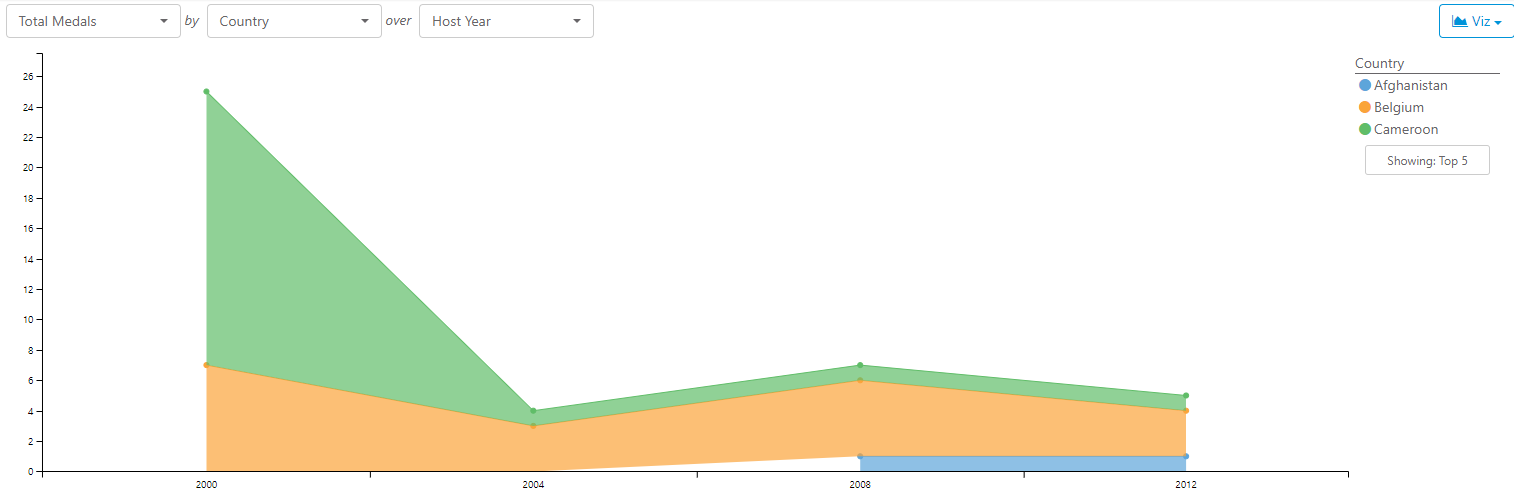
Here's the error from data.js: 797
Uncaught TypeError: Reduce of empty array with no initial value
    at Array.reduce (<anonymous>)
    at ChartInternal.getRatio (data.js:797)
    at shape.js:113
    at Array.map (<anonymous>)
    at shape.js:111
    at Array.forEach (<anonymous>)
    at shape.js:141
    at line.js:211
    at yValue (line.js:156)
    at line (d3.js:14375)
thanks @ataft for checking :) I missed on handling for null data.
Checkout the nightly.
netil
on 13 Nov 2018
Thanks, but that did not fix it. I realized that I had values in options.data.hide that didn't have data on the chart because I've created a custom legend. Thus, dataValues($$.hiddenTargetIds, false) is returning an empty array, so reduceis throwing an error. I've fixed the issue in my code and realistically this is my fault rather than billboard's, but perhaps it couldn't hurt to make sure that the dataValuesfunction array is not empty...
ataft
on 13 Nov 2018
@ataft done. I don't think is usual indicating non existing data for data.hide option, but to get prevented I added condition to check for hidden values.
netil
on 14 Nov 2018
Related issues
 madflow
·
4Comments
madflow
·
4Comments
 AyshvaryaLaxmiK
·
5Comments
AyshvaryaLaxmiK
·
5Comments
 drazik
·
4Comments
drazik
·
4Comments
 stevenmusumeche
·
3Comments
stevenmusumeche
·
3Comments
 eweap
·
5Comments
eweap
·
5Comments
Most helpful comment
@ataft, to get to be noticed
normalizedfeature is on working.The interface will be simply enough as setting true or false.