Bert-as-service: Process not showing up on nvidia-smi (not using GPU)
Prerequisites
Please fill in by replacing
[ ]with[x].
- [x] Are you running the latest
bert-as-service? - [x] Did you follow the installation and the usage instructions in
README.md? - [x] Did you check the FAQ list in
README.md? - [x] Did you perform a cursory search on existing issues?
System information
Some of this information can be collected via this script.
- OS Platform and Distribution (e.g., Linux Ubuntu 16.04): Ubuntu 16.04
- TensorFlow installed from (source or binary): pip3 installation
- TensorFlow version: 1.13.1
- Python version: 3.5
bert-as-serviceversion: 1.8.3- GPU model and memory: Titan X Pascal 12GB RAM (3 of these)
- CPU model and memory: Intel Core i7-5960X model 63, 16 GB RAM
Description
Please replace
YOUR_SERVER_ARGSandYOUR_CLIENT_ARGSaccordingly. You can also write your own description for reproducing the issue.
I'm using this command to start the server:
bert-serving-start -port=8001 -max_seq_len=NONE -pooling_strategy=NONE -max_batch_size=1024 -num_worker=3 -gpu_memory_fraction=0.9 -device_map 0 1 2 -verbose
and calling the server via:
bc = BertClient(port=8001, port_out=5556)
bc.encode(['insert sentence here'])
Then this issue shows up:
In nvidia-smi there are no processes listed either when running the server or sending its requests. The CPU however is running at full capacity. I noticed that the sentence encoding is taking a while (about 1 hr and 20 min for 20,000 sentences or so), and I would like to take full advantage of having three really powerful GPUs. Upon starting the server, it says that it's using the GPUs:
I:GRAPHOPT:[gra:opt:140]:freeze...
I:GRAPHOPT:[gra:opt:145]:write graph to a tmp file: /tmp/tmpfz6teik5
I:VENTILATOR:[__i:__i: 74]:optimized graph is stored at: /tmp/tmpfz6teik5
I:VENTILATOR:[__i:_ru:106]:bind all sockets
I:VENTILATOR:[__i:_ru:110]:open 8 ventilator-worker sockets
I:VENTILATOR:[__i:_ru:113]:start the sink
I:SINK:[__i:_ru:270]:ready
I:VENTILATOR:[__i:_ge:188]:get devices
I:VENTILATOR:[__i:_ge:221]:device map:
        worker  0 -> gpu  0
        worker  1 -> gpu  1
        worker  2 -> gpu  2
I:VENTILATOR:[__i:_ru:148]:new config request   req id: 1   client: b'17f9d78d-f670-48c2-a3a2-4866299dfee1'
I:WORKER-1:[__i:_ru:478]:use device gpu: 1, load graph from /tmp/tmpfz6teik5
I:WORKER-2:[__i:_ru:478]:use device gpu: 2, load graph from /tmp/tmpfz6teik5
I:WORKER-0:[__i:_ru:478]:use device gpu: 0, load graph from /tmp/tmpfz6teik5
WARNING:tensorflow:Using temporary folder as model directory: /tmp/tmpw1teoh_9
WARNING:tensorflow:Using temporary folder as model directory: /tmp/tmpxpf2k2zh
but nvidia-smi is not showing anything from Bert:
alsuhr@bigbox:~/Documents/real_nlvr/baselines$ nvidia-smi
Wed Feb 27 15:07:44 2019
+-----------------------------------------------------------------------------+
| NVIDIA-SMI 384.130                Driver Version: 384.130                   |
|-------------------------------+----------------------+----------------------+
| GPU  Name        Persistence-M| Bus-Id        Disp.A | Volatile Uncorr. ECC |
| Fan  Temp  Perf  Pwr:Usage/Cap|         Memory-Usage | GPU-Util  Compute M. |
|===============================+======================+======================|
|   0  TITAN X (Pascal)    Off  | 00000000:01:00.0  On |                  N/A |
| 25%   45C    P8    19W / 250W |    504MiB / 12186MiB |     15%      Default |
+-------------------------------+----------------------+----------------------+
|   1  TITAN X (Pascal)    Off  | 00000000:02:00.0 Off |                  N/A |
| 23%   34C    P8     9W / 250W |      2MiB / 12189MiB |      0%      Default |
+-------------------------------+----------------------+----------------------+
|   2  TITAN X (Pascal)    Off  | 00000000:03:00.0 Off |                  N/A |
| 23%   34C    P8    16W / 250W |      2MiB / 12189MiB |      0%      Default |
+-------------------------------+----------------------+----------------------+

+-----------------------------------------------------------------------------+
| Processes:                                                       GPU Memory |
|  GPU       PID   Type   Process name                             Usage      |
|=============================================================================|
|    0      1225      G   /usr/lib/xorg/Xorg                           277MiB |
|    0      2704      G   compiz                                       152MiB |
|    0     21605      G   /home/alsuhr/Documents/unity/Editor/Unity     72MiB |
+-----------------------------------------------------------------------------+
Instead, it looks like it's running on CPU (output from top):
Tasks: 403 total,   2 running, 291 sleeping,   0 stopped,   4 zombie
%Cpu(s):  1.8 us,  0.7 sy,  1.2 ni, 96.2 id,  0.0 wa,  0.0 hi,  0.0 si,  0.0 st
KiB Mem : 16329112 total,  5808852 free,  5041572 used,  5478688 buff/cache
KiB Swap: 50236408 total, 39798536 free, 10437872 used. 10678128 avail Mem

  PID USER      PR  NI    VIRT    RES    SHR S  %CPU %MEM     TIME+ COMMAND
 4100 alsuhr    20   0 7045480 1.300g  34244 S 370.6  8.3  29:40.97 bert-serving-st
 4102 alsuhr    20   0 7045500 1.301g  35240 S 347.1  8.4  29:52.74 bert-serving-st
 4097 alsuhr    20   0 7045460 1.292g  34052 S 288.2  8.3  29:42.03 bert-serving-st
21262 alsuhr    30  10  712908   5624   2188 S  23.5  0.0 778:42.22 update-manager
 alsuhr-c
All 15 comments
hmm... never had this before. 🤔
 hanxiao
on 1 Mar 2019
hanxiao
on 1 Mar 2019
As an update, I couldn't get it to run on GPU still, but 20,000 sentences only took about 20min in the end on CPU.
alsuhr-c
on 1 Mar 2019
I have the same question and I update my nvidia driver from version 390 to 396, then it runs on my GPU.
 shokosanma
on 5 Mar 2019
shokosanma
on 5 Mar 2019
I had the same issue. Uninstalling tensorflow and installing tensorflow-gpu fixed this for me.
 swubb
on 5 Mar 2019
swubb
on 5 Mar 2019
I have the same problem using Amazon's Deep Learning AMI.
From the same environment, I run:
import tensorflow as tf
with tf.device('/gpu:0'):
    a = tf.constant([1.0, 2.0, 3.0, 4.0, 5.0, 6.0], shape=[2, 3], name='a')
    b = tf.constant([1.0, 2.0, 3.0, 4.0, 5.0, 6.0], shape=[3, 2], name='b')
    c = tf.matmul(a, b)

with tf.Session() as sess:
    print (sess.run(c))
The graph computes and I see a python3 process appearing in nvidia-smi
However, when I run
bert-serving-start -model_dir multi_cased_L-12_H-768_A-12 -max_seq_len 64
The server runs, but on CPU only (same observations as alsuhr-c above wrt nvidia-smi and top)
The server mentions:
I:VENTILATOR:[__i:_ge:221]:device map:
worker 0 -> gpu 0
bertbert-serving-start -version shows:
bert-serving-start 1.8.3
 achachet
on 12 Mar 2019
achachet
on 12 Mar 2019
does adding bert-serving-start ... -prefetch_size 0 help?
hanxiao
on 13 Mar 2019
I stumbled on this issue almost an hour ago, and sadly none of the solutions above worked for me.
So I started diagnosing the problem on my own and here is the fix I found, as well as the explanation to it (hopefully it will help other people in my situation). 😊
It really was the root cause in my case, since undoing the fix caused the server to fallback to CPU, and redoing it re-enabled GPU usage by the server each time.
TD;LR
sudo nvidia-smi -pm 1
Low-level stuff
The NVIDIA kernel driver has (among many other options) two modes: persistent and non-persistent.
Roughly speaking this comes down to a trade-off: non-persistent mode means the GPU will try to remain idle as long as possible (to save battery etc.) and it will fire up on connections (loading the driver application, triggering ECC scrubbing and so on), which can take many seconds.
On the other hand, the persistent mode will trigger it all once and keep the driver application loaded and ready for connections (at the expense of greater battery usage).
[cf. [driver-persistence](https://docs.nvidia.com/deploy/driver-persistence/index.html)]
This also explains the strangely high volatile GPU-Util in "nvidia-smi" (for me it was consistently 90-99%) in non-persistent mode, even with no other programs using the GPU (!): the program nvidia-smi itself is querying the GPU, hence "activating" it and causing the spikes aforementioned. By the way, this was the event that caught my attention and led to this solution.
It's funny how this reminded me of the observer effect in physics: the observation itself is changing the phenomenon, but I digress...
[reference: [this discussion](https://devtalk.nvidia.com/default/topic/539632/k20-with-high-utilization-but-no-compute-processes-/)]
So I thought: doesn't the BERT server check for GPU availability before allocation? If it does, and if the GPU is idle (i.e. if the driver is configured not to persist), it will trigger the driver application to wake up and the GPU to spike like crazy (for some seconds), and by doing this, the GPU makes itself unavailable to clients demanding a minimum level of availability.
And indeed, this line of code requires the GPU to have a maximum load of 90% (as well as a maximum memory usage of 90%). So in the event of temporary unavailability, it will return an empty list (I tested), even when all else seems good (GPU is there, CUDA driver configured, tensorflow-gpu installed etc.).
So the command line in the TL;DR above, which sets persistence mode in the GPUs, was the only fix for me, since it will cause the GPU to be much more stable, and thus bypassing the "spikes on connection" that makes it so busy it cannot connect.
Hope it helps!
 danilo-augusto
on 16 Mar 2019
danilo-augusto
on 16 Mar 2019
@danilo-augusto Wow, thanks a lot for the detailed diagnosis. Really appreciated!
238
hanxiao
on 16 Mar 2019
This also happens to me. @danilo-augusto solution not working for me. The server only uses cpu although it says it uses gpu in the server log
 fuzihang
on 9 Aug 2019
fuzihang
on 9 Aug 2019
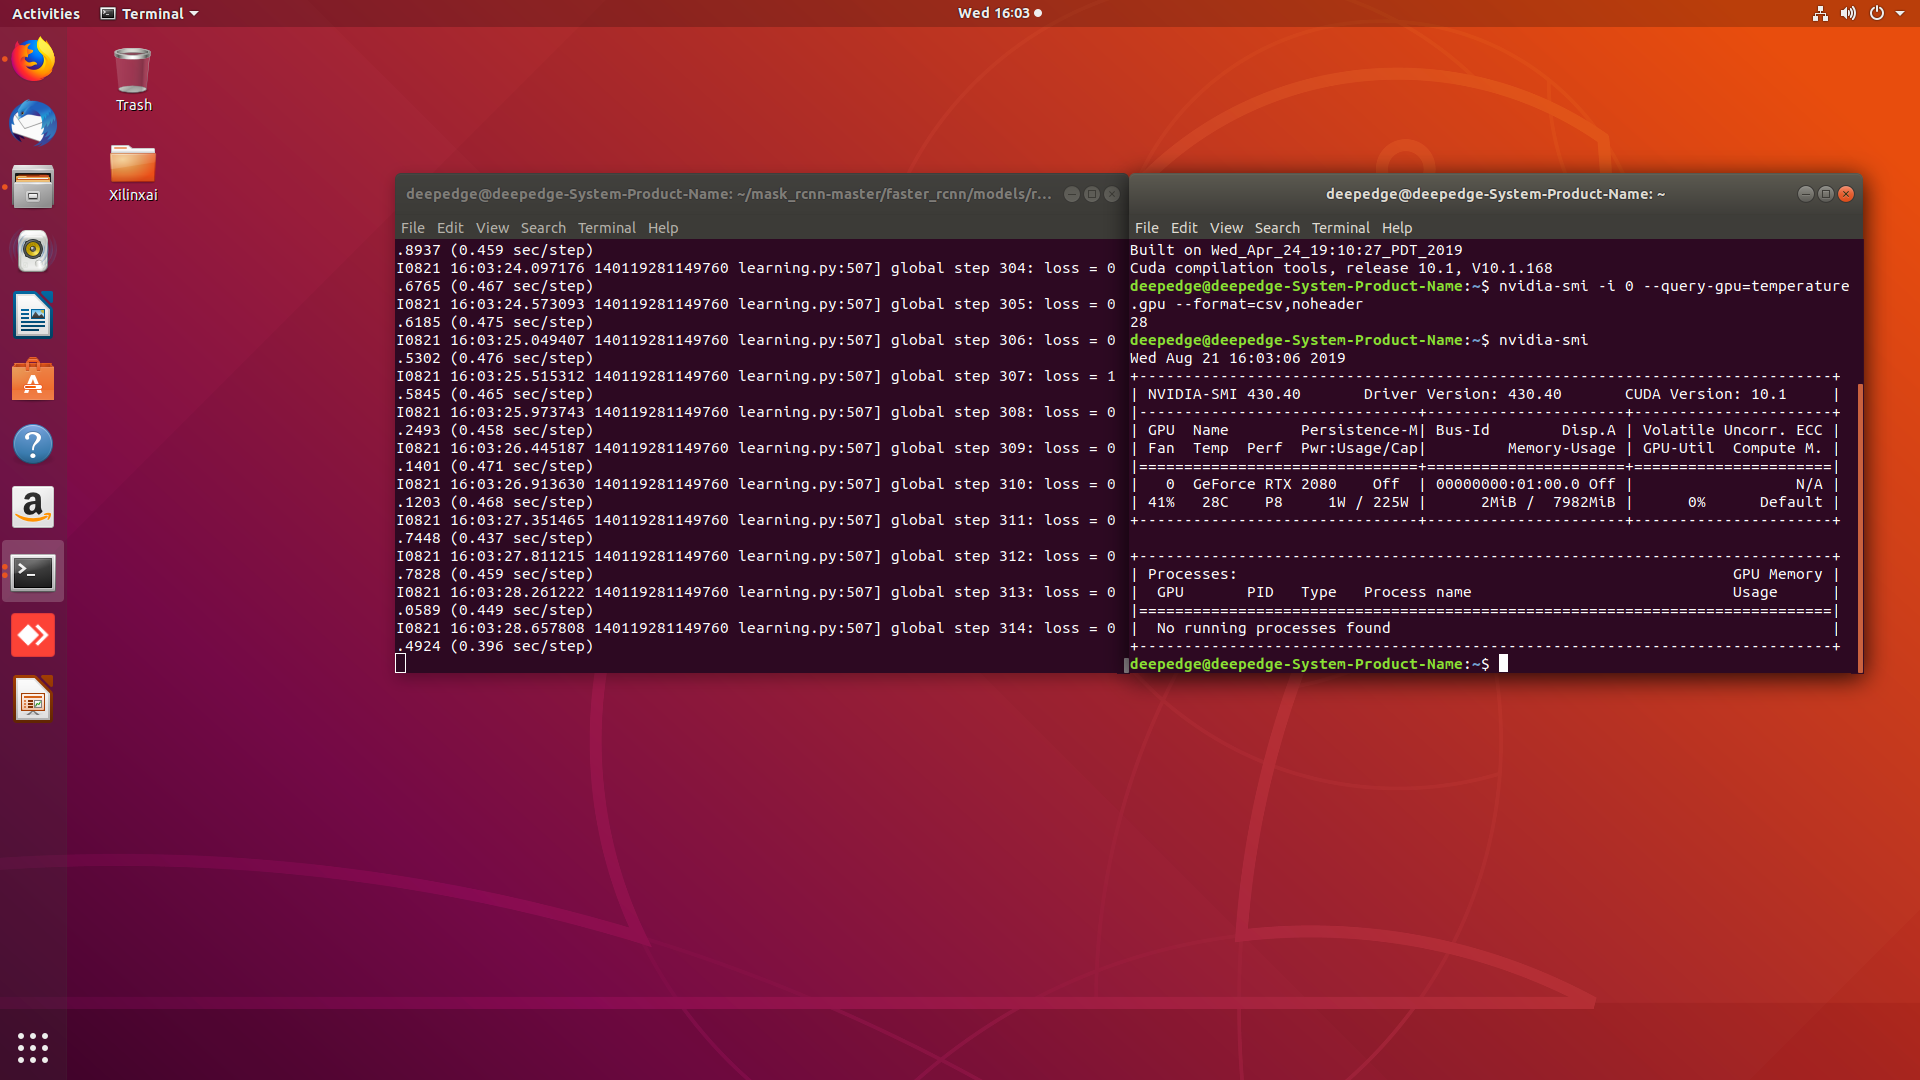
nvidia-smi not showing any running process while training the model

 angyee
on 21 Aug 2019
angyee
on 21 Aug 2019
I had the same issue. Uninstalling tensorflow and installing tensorflow-gpu fixed this for me.
nvidia-smi not showing any running process while training the model
angyee
on 21 Aug 2019
I stumbled on this issue almost an hour ago, and sadly none of the solutions above worked for me.
So I started diagnosing the problem on my own and here is the fix I found, as well as the explanation to it (hopefully it will help other people in my situation). blush
It really was the root cause in my case, since undoing the fix caused the server to fallback to CPU, and redoing it re-enabled GPU usage by the server each time.
TD;LR
sudo nvidia-smi -pm 1Low-level stuff
The NVIDIA kernel driver has (among many other options) two modes: persistent and non-persistent.
Roughly speaking this comes down to a trade-off: non-persistent mode means the GPU will try to remain idle as long as possible (to save battery etc.) and it will fire up on connections (loading the driver application, triggering ECC scrubbing and so on), which can take many seconds.
On the other hand, the persistent mode will trigger it all once and keep the driver application loaded and ready for connections (at the expense of greater battery usage).
[cf. [driver-persistence](https://docs.nvidia.com/deploy/driver-persistence/index.html)]This also explains the strangely high volatile GPU-Util in "nvidia-smi" (for me it was consistently 90-99%) in non-persistent mode, even with no other programs using the GPU (!): the program
nvidia-smiitself is querying the GPU, hence "activating" it and causing the spikes aforementioned. By the way, this was the event that caught my attention and led to this solution.
It's funny how this reminded me of the observer effect in physics: the observation itself is changing the phenomenon, but I digress...
[reference: [this discussion](https://devtalk.nvidia.com/default/topic/539632/k20-with-high-utilization-but-no-compute-processes-/)]So I thought: doesn't the BERT server check for GPU availability before allocation? If it does, and if the GPU is idle (i.e. if the driver is configured not to persist), it will trigger the driver application to wake up and the GPU to spike like crazy (for some seconds), and by doing this, the GPU makes itself unavailable to clients demanding a minimum level of availability.
And indeed, this line of code requires the GPU to have a maximum load of 90% (as well as a maximum memory usage of 90%). So in the event of temporary unavailability, it will return an empty list (I tested), even when all else seems good (GPU is there, CUDA driver configured, tensorflow-gpu installed etc.).So the command line in the TL;DR above, which sets persistence mode in the GPUs, was the only fix for me, since it will cause the GPU to be much more stable, and thus bypassing the "spikes on connection" that makes it so busy it cannot connect.
Hope it helps!
nvidia-smi not showing any running process while training the model
@swubb @hanxiao @shokosanma
angyee
on 21 Aug 2019
still the same problem
Did anyone solve this?
 arti32lehtonen
on 17 Jan 2020
arti32lehtonen
on 17 Jan 2020
I'm also having the same problem, I'm seeing that bert-as-a-service assigns a worker to a GPU, but nvidia-smi register's no workloads
I'm running in GKE so I'm not sure how to set persistence mode there
 mlegore
on 25 Jan 2020
mlegore
on 25 Jan 2020
First thanks to @swubb for the first two steps.
Then, I followed this guide. Running these commands from command line from ubuntu 19.10.
pip uninstall tensorflow
pip install tensorflow-gpu
sudo apt install nvidia-driver-390
sudo reboot
then everything worked with the option -device_map=0 -num_worker=1 it finds the nvidia geforce gpu and it uses it as desired. Remember to remove -cpu options when running bert server.
 SimoneLeonardiRD
on 14 Apr 2020
SimoneLeonardiRD
on 14 Apr 2020
Related issues
 JulianGerhard21
·
4Comments
JulianGerhard21
·
4Comments
 kapilkd13
·
4Comments
kapilkd13
·
4Comments
 un-lock-me
·
3Comments
un-lock-me
·
3Comments
 shashi-netra
·
3Comments
shashi-netra
·
3Comments
 loretoparisi
·
6Comments
loretoparisi
·
6Comments
Most helpful comment
I stumbled on this issue almost an hour ago, and sadly none of the solutions above worked for me.
So I started diagnosing the problem on my own and here is the fix I found, as well as the explanation to it (hopefully it will help other people in my situation). 😊
It really was the root cause in my case, since undoing the fix caused the server to fallback to CPU, and redoing it re-enabled GPU usage by the server each time.
TD;LR
sudo nvidia-smi -pm 1Low-level stuff
The NVIDIA kernel driver has (among many other options) two modes: persistent and non-persistent.
Roughly speaking this comes down to a trade-off: non-persistent mode means the GPU will try to remain idle as long as possible (to save battery etc.) and it will fire up on connections (loading the driver application, triggering ECC scrubbing and so on), which can take many seconds.
On the other hand, the persistent mode will trigger it all once and keep the driver application loaded and ready for connections (at the expense of greater battery usage).
[cf. [driver-persistence](https://docs.nvidia.com/deploy/driver-persistence/index.html)]
This also explains the strangely high volatile GPU-Util in "nvidia-smi" (for me it was consistently 90-99%) in non-persistent mode, even with no other programs using the GPU (!): the program
nvidia-smiitself is querying the GPU, hence "activating" it and causing the spikes aforementioned. By the way, this was the event that caught my attention and led to this solution.It's funny how this reminded me of the observer effect in physics: the observation itself is changing the phenomenon, but I digress...
[reference: [this discussion](https://devtalk.nvidia.com/default/topic/539632/k20-with-high-utilization-but-no-compute-processes-/)]
So I thought: doesn't the BERT server check for GPU availability before allocation? If it does, and if the GPU is idle (i.e. if the driver is configured not to persist), it will trigger the driver application to wake up and the GPU to spike like crazy (for some seconds), and by doing this, the GPU makes itself unavailable to clients demanding a minimum level of availability.
And indeed, this line of code requires the GPU to have a maximum load of 90% (as well as a maximum memory usage of 90%). So in the event of temporary unavailability, it will return an empty list (I tested), even when all else seems good (GPU is there, CUDA driver configured, tensorflow-gpu installed etc.).
So the command line in the TL;DR above, which sets persistence mode in the GPUs, was the only fix for me, since it will cause the GPU to be much more stable, and thus bypassing the "spikes on connection" that makes it so busy it cannot connect.
Hope it helps!