Benchmarkdotnet: NativeMemoryProfiler reports false positive leak
Hello all,
Thank you for the work on the project, it is much appreciated!
I am reporting an issue we are experiencing with the NativeMemoryProfiler of BenchmarkDotNet. It detects small but constant native memory leaks that seem to be false positives.
The attached reproducer showcases the issue. The benchmark only instantiates a mock object and computes a SHA256 (to avoid spending too little time in the benchmark). The resulting detected native memory leak is 0.06KB on my machine.
I believe the mocking library we use does not do weird things with native memory, so this gives me a strong feeling that this could be a false positive. Please note that this also happens with an industrial library we use in our software and which is heavily tested for memory leaks. While the library is using native memory, we are confident that the provider extensively tested it for any leak, which is another evidence that this could be a false positive. Unfortunately I cannot provide this library for inspection.
I am available for clarifications, should the need arise.
Version of BenchmarkDotNet: 0.12.1
Version of the Windows Diagnostics nuget: 0.12.1
Version of .net: core 3.1
Minimal reproducer: MemoryProfilerReproducer.zip
 jjolidon
All 7 comments
@WojciechNagorski could you please take a look?
 adamsitnik
on 17 Apr 2020
adamsitnik
on 17 Apr 2020
I started my investigation.
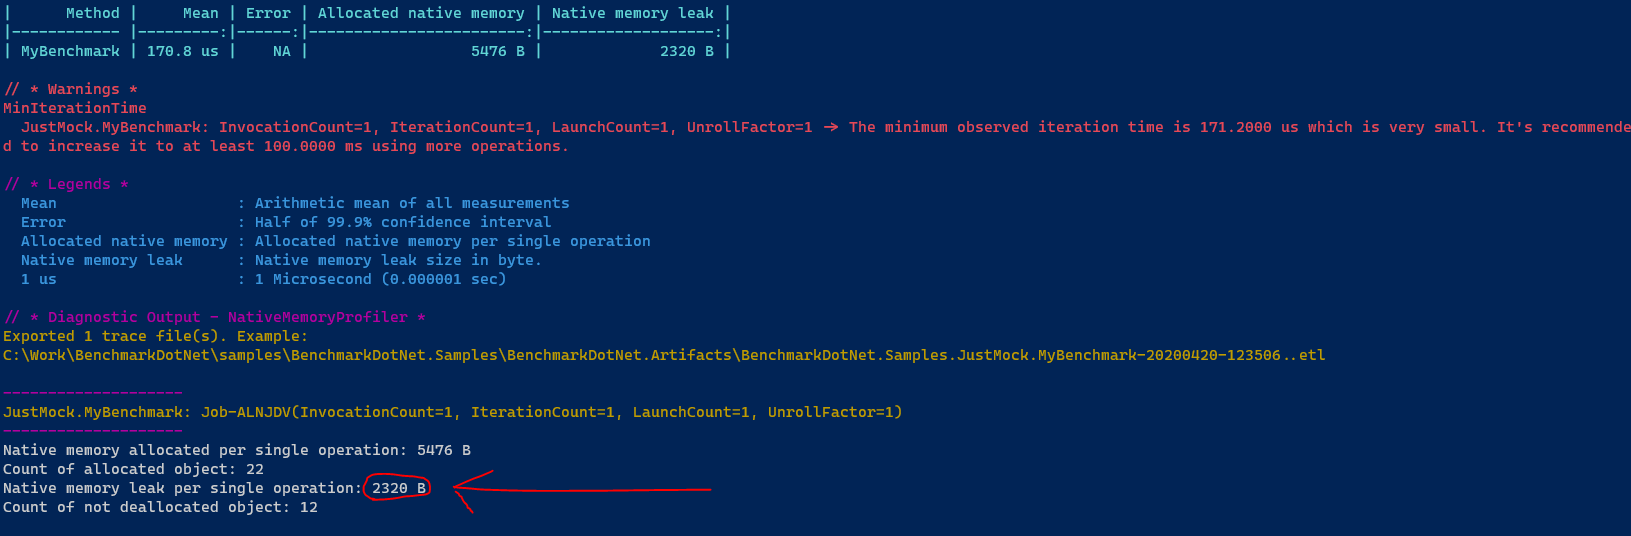
I run my repro (based on @jjolidon's report) using the following command because I wanted to run a benchmarked method only once.
dotnet run -c Release -f netcoreapp3.1 -- --filter *Just* --launchCount 1 --iterationCount 1 --invocationCount 1 --unrollFactor 1
And I got (2320 B memory leak)
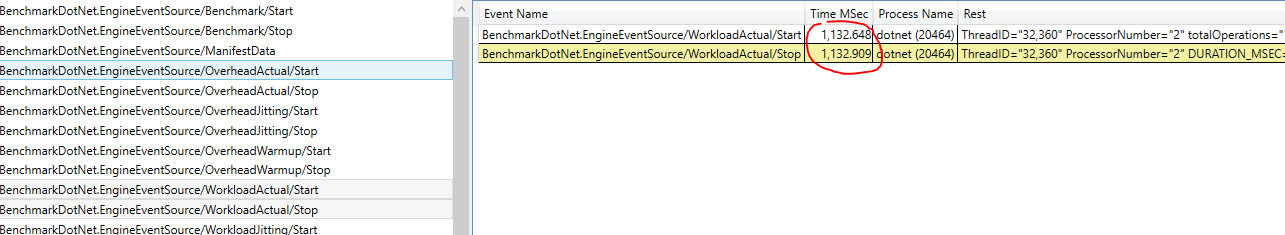
Then I use Perfview to analyze a trace file:
@adamsitnik Maybe you know what it is? If not I need more time to understand this problem.
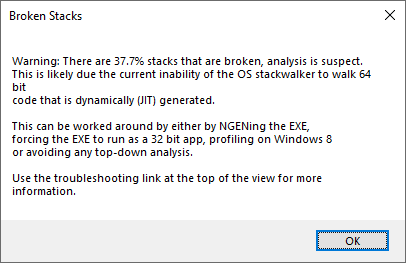
After I open "Net Os Heap Alloc Stacks" I got a message:
 WojciechNagorski
on 20 Apr 2020
WojciechNagorski
on 20 Apr 2020
It is a minimal repro:
```c#
using System.Diagnostics;
using BenchmarkDotNet.Attributes;
using BenchmarkDotNet.Diagnostics.Windows.Configs;
namespace BenchmarkDotNet.Samples
{
[NativeMemoryProfiler]
public class JustMock
{

    [Benchmark]
    public string MyBenchmark()
    {
        var stackTrace = new StackTrace();

        return stackTrace.GetType().Name ;
    }
}
}
The result:
JustMock.MyBenchmark: Job-SNEMBI(InvocationCount=1, IterationCount=1, LaunchCount=1, UnrollFactor=1)
Native memory allocated per single operation: 3544 B
Count of allocated object: 19
Native memory leak per single operation: 2320 B
Count of not deallocated object: 12
```
WojciechNagorski
on 21 Apr 2020
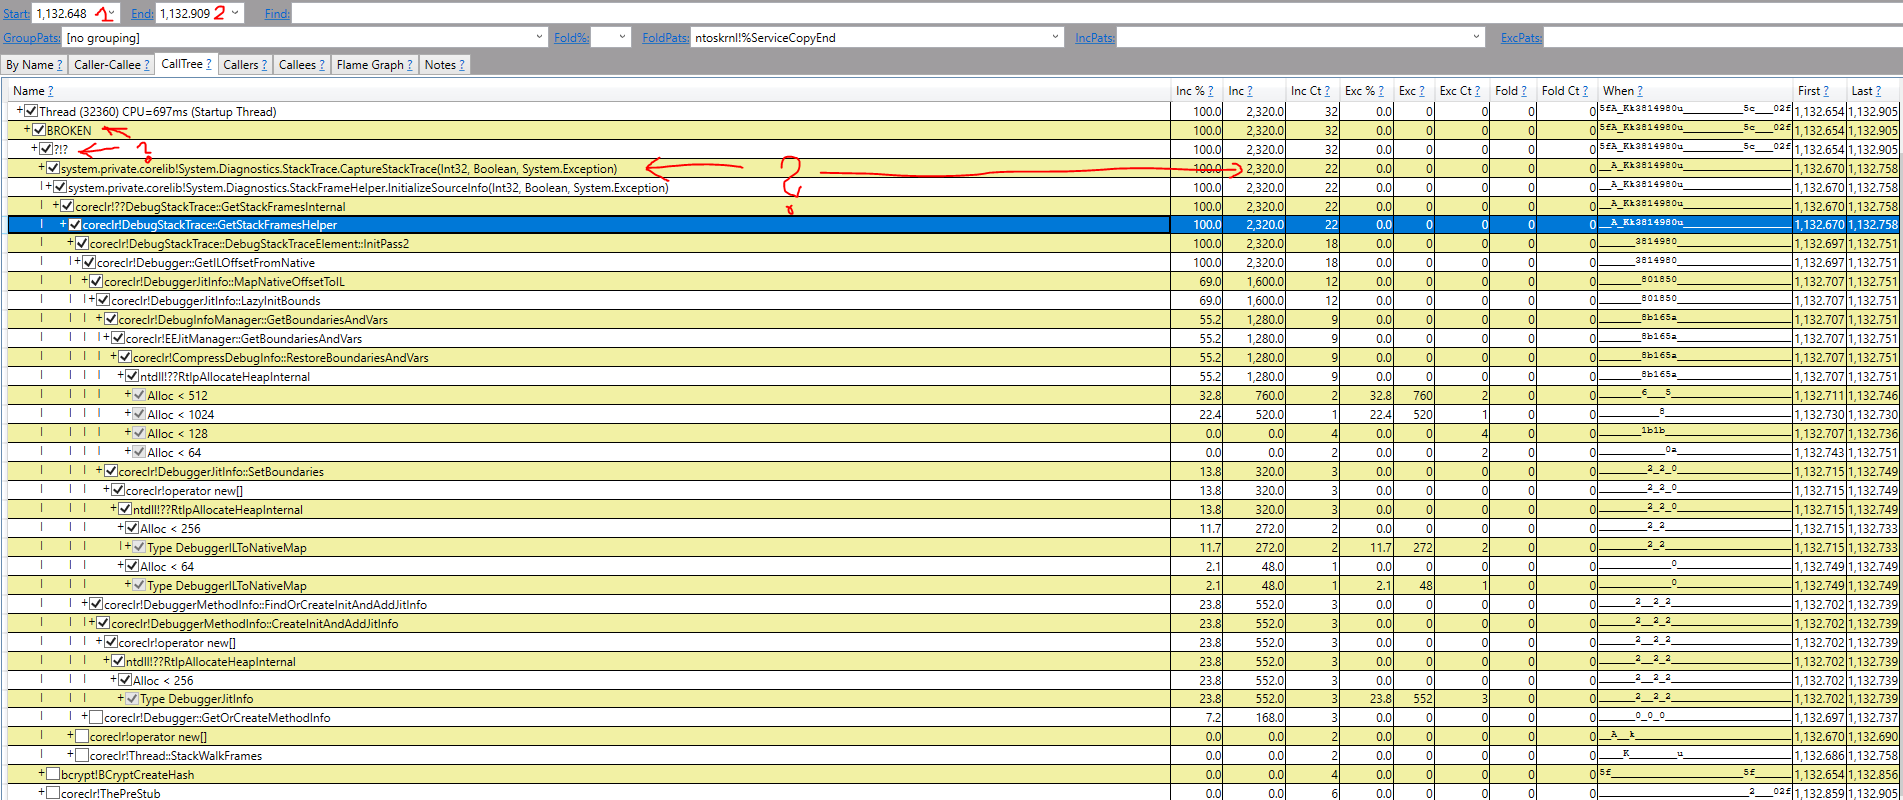
After adding additional providers, I received a readable tracking file:
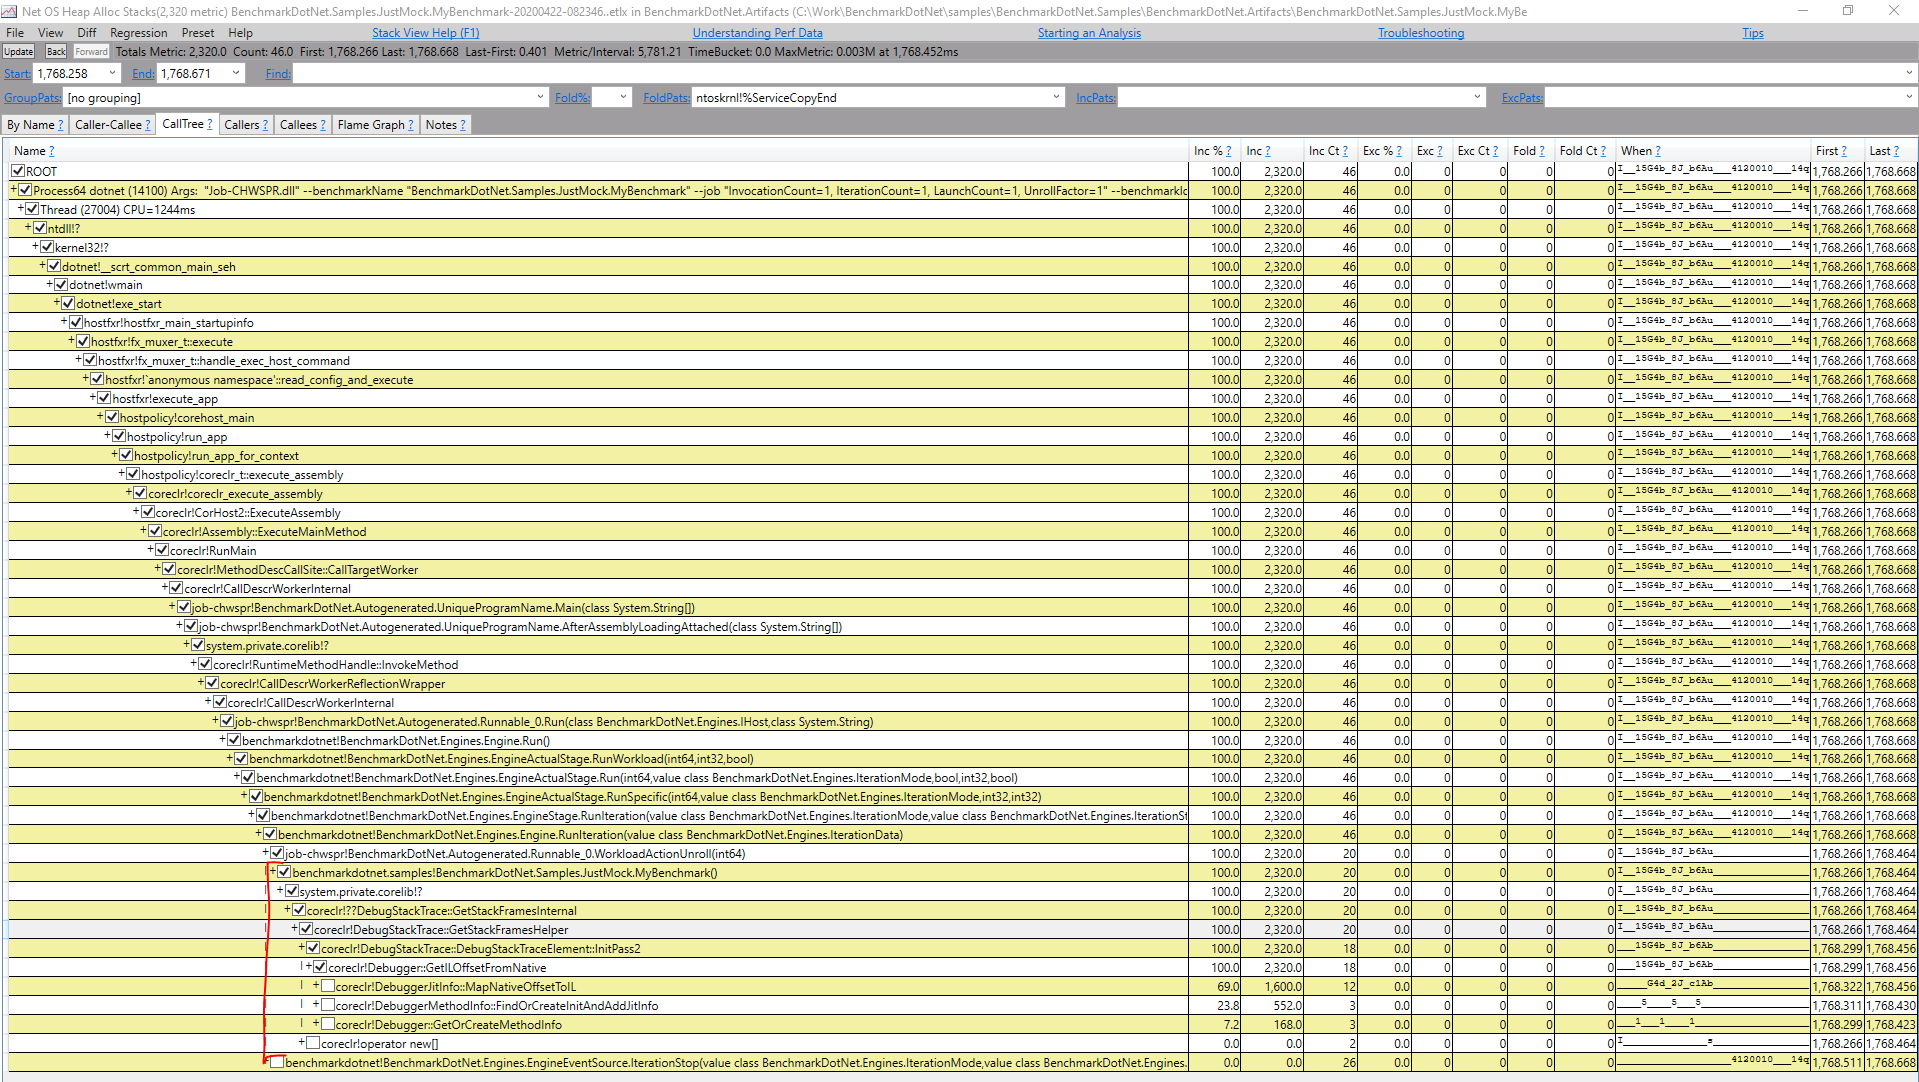
But the memory leak is still there.
WojciechNagorski
on 22 Apr 2020
I have a fix for .Net Framework. .Net Core has different behavior, but I know where a problem is and how to fix it. But I have to find free time to implement a fix.
WojciechNagorski
on 30 Apr 2020
The following code present starting action:
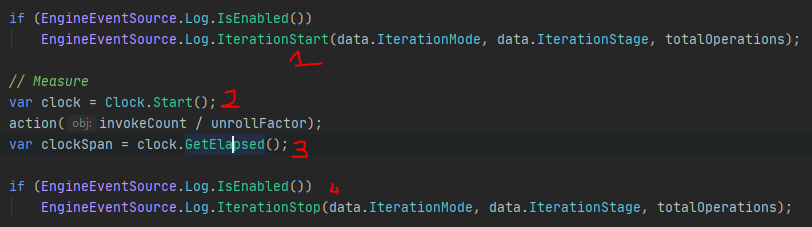
And my calculations take a jitting of method (with their native allocations) between Start and Stop:


WojciechNagorski
on 30 Apr 2020
I have a fix for .Net Framework. .Net Core has different behavior, but I know where a problem is and how to fix it
Great news!
adamsitnik
on 30 Apr 2020
Related issues
 Turnerj
·
4Comments
Turnerj
·
4Comments
 AndreyAkinshin
·
4Comments
AndreyAkinshin
·
4Comments
 Vermistuk
·
4Comments
AndreyAkinshin
·
4Comments
Vermistuk
·
4Comments
AndreyAkinshin
·
4Comments
 BlueRaja
·
4Comments
BlueRaja
·
4Comments
Most helpful comment
The following code present starting action:

And my calculations take a jitting of method (with their native allocations) between


StartandStop: