Beats: Dashboards display partially when using custom index (other than metricbeat*)
Kibana version: 7.8.1
Elasticsearch version: 7.8.1
Server OS version: Ubuntu 18.04.4 LTS
Browser version: Firefox 77.0.1 (64 bits)
Original install method (e.g. download page, yum, from source, etc.): aptitude install kibana from artifacts.elastic.co repository.
Describe the bug:
I am using custom index name to store metrics instead of the default metricbeat index. I've installed Kibana dashboards using metricbeat setup.
After that, some visualizations in Kibana dashboards do not display while the most of the other visualizations in the same dashboard work fine.
Steps to reproduce:
- Install metricbeat, then send system (or apache) metrics to the index named
customindex. Ensure metrics data are received in thecustomindexindex. - Configure Kibana Index Patterns to use data from the
customindexindex. Now you have metrics data from the custom index. - On the metricbeat instance, do the following :
metricbeat setup. - In Kibana, go to Kibana > Dashboards , and click on
[Metricbeat System] Overview ECSto see that dashboard.
Expected behavior:
All vizualisations in the dashboard are displaying correctly.
Screenshots (if relevant):
Errors in browser console (if relevant):
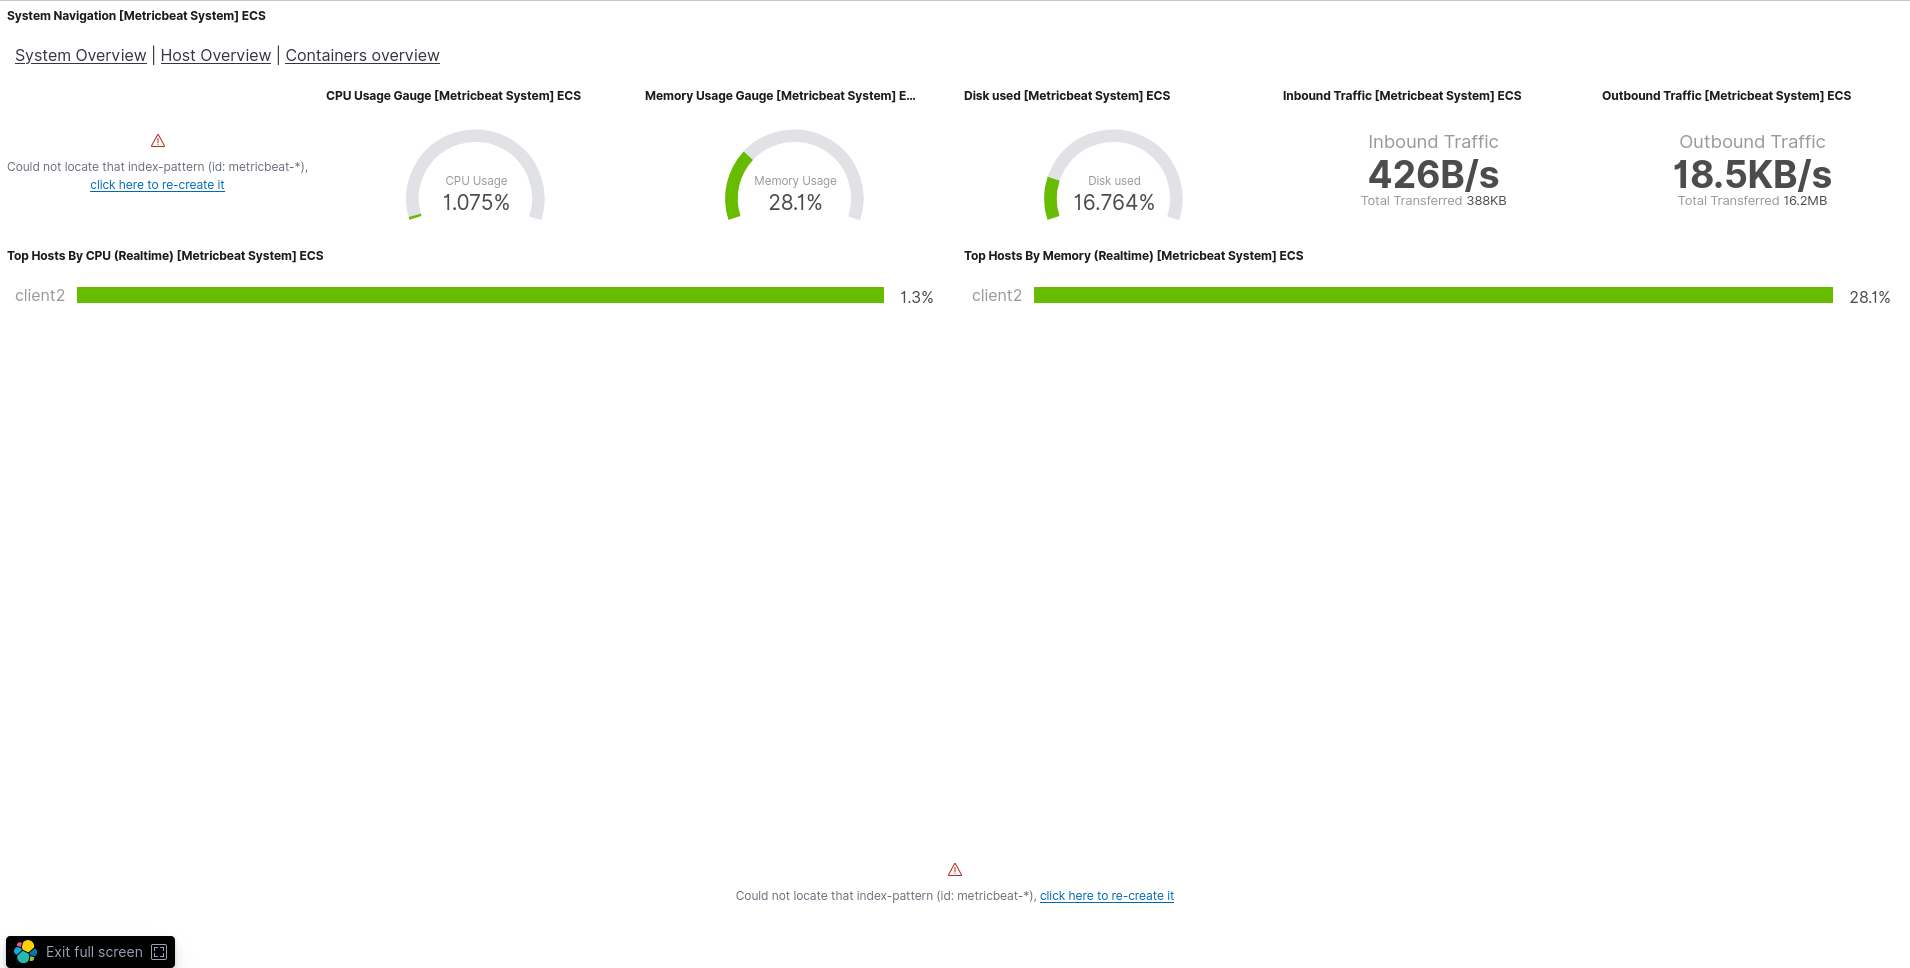
- Error: "Could not locate that index-pattern (id: metricbeat-*), click here to re-create it"
This is a normal error and that's probably the reason of the bug, because I'm not usingmetricbeatindices.
Any additional context:
I have the same behavior on other dashboards, such as [Metricbeat Apache] Overview ECS
Thank a lot guys.
Regards,
 Xat59
Xat59
All 19 comments
This is to be expected. The OOTB/sample dashboards/visualisations only work with the standard/default index pattern. which in this case is metricbeat-*. You will have to update/clone the sample dashboards and update the index pattern accordingly.
 hendry-lim
on 19 Aug 2020
hendry-lim
on 19 Aug 2020
@hendry-lim thank you for the response. Why are all other visualizations working well. Only 1 or 2 per dashboards do not .
Plus, I tried to replace every metricbeat-* by customindex* in all .json files from /usr/share/metricbeat/kibana/7/dashboards/ , then run again this command : metricbeat setup .
After that, I get this error : Could not locate that index-pattern (id: customindex*) .
Did I miss something ?
Xat59
on 19 Aug 2020
Those are classic visualisations. They are bounded by the index pattern ID, which by default is metricbeat-*. Based on your screenshot, those visualisations that are displaying correctly are TSVB visualisations.
hendry-lim
on 19 Aug 2020
@hendry-lim I'm ok with the fact that visualization are bounded by default to the metricbeat-* index pattern.
That does not explain why some visualizations are working even with a custom index pattern.
Plus, if I change all the *.json files to my custom index pattern and re-run metricbeat setup --dashboards , everything works well , except the same ones visualizations.
This seems to be a bug, really.
Xat59
on 19 Aug 2020
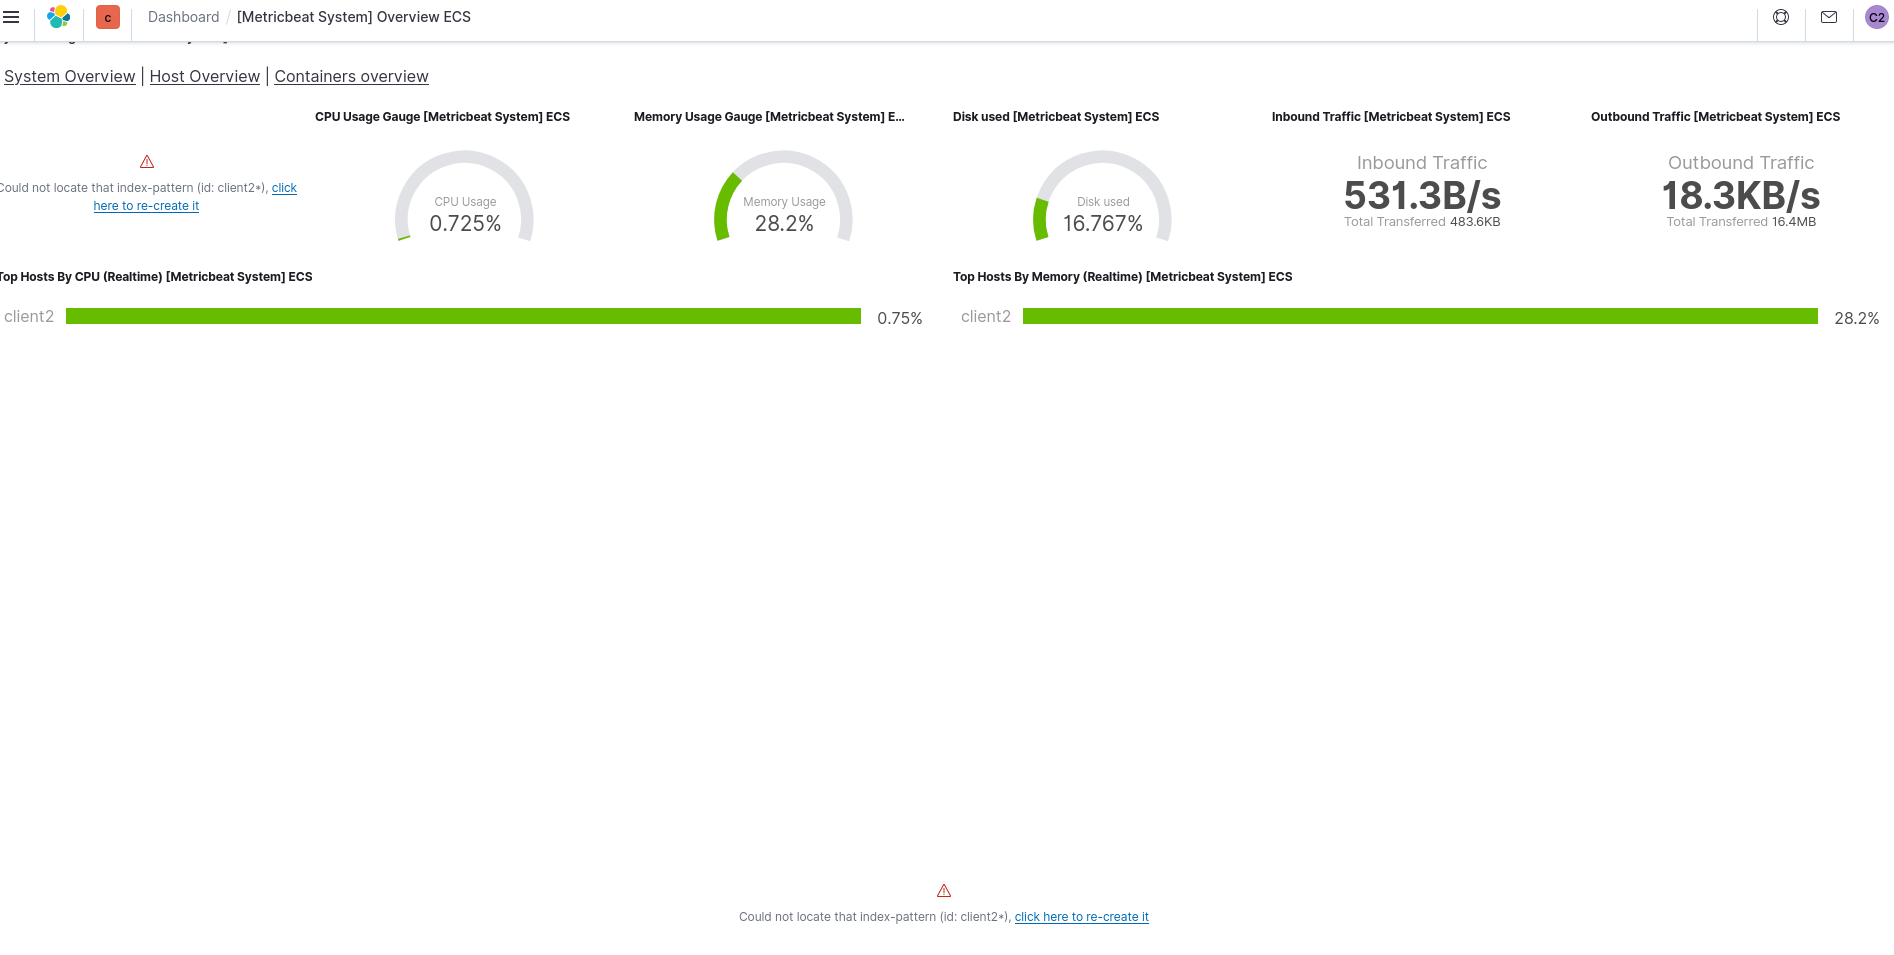
If you refer to your latest screenshot, the classic visualisations are referring to index pattern ID client2* instead of metricbeat-*. Does your index pattern have the same ID? Please note that the index pattern ID may/may not be the same as the index pattern.
hendry-lim
on 19 Aug 2020
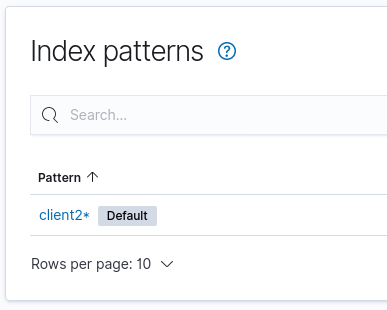
@hendry-lim yeah my index pattern id is client2*:
Xat59
on 19 Aug 2020
That is not the index pattern ID. That is the actual index pattern. Click on the index pattern, and observe your browser address bar. There is a string at the end of the path, which by default looks like a UUID.

hendry-lim
on 19 Aug 2020
Ok thank you for that info. My index pattern id for client2* is 3a2deed0-e219-11ea-81ca-4bbd6f14d1a9
So if I understand well, I have to replace some data in *.json files , then reinstall dashboards with metricbeat setup --dashboards.
For some data I have to replace metricbeat-* by client2*, and sometimes I have to replace metricbeat-* by my index pattern id 3a2deed0-e219-11ea-81ca-4bbd6f14d1a9.
What do you think about it ?
Xat59
on 19 Aug 2020
You can delete and re-create your index pattern with ID client2*.
hendry-lim
on 19 Aug 2020
Can I create an index pattern with a custom ID ? I do not find it.
Xat59
on 19 Aug 2020
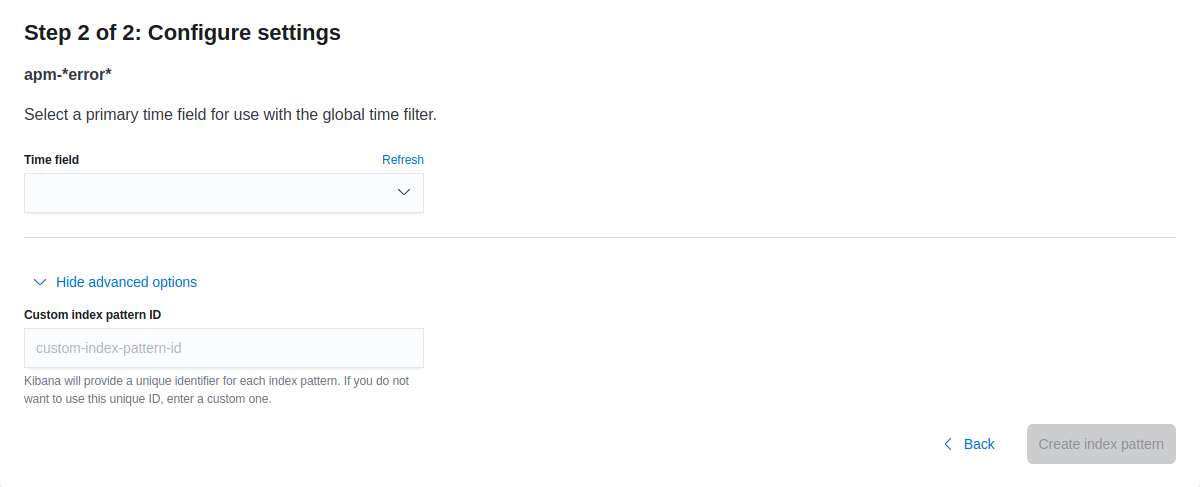
hendry-lim
on 19 Aug 2020
Alright ! 👍
So, metricbeat setup command configure the Kibana index pattern . Any way to configure it with a custom ID when running the metricbeat setup command ?
Here is my metricbeat.yml configuration for client2 :
interfaces:
  device: any
metricbeat.config.modules:
  path: ${path.config}/modules.d/*.yml
  reload_enabled: 'false'
metricbeat.modules:
- enabled: 'true'
  module: system
setup.dashboards.index: client2
setup.ilm.enabled: 'true'
setup.ilm.pattern: '{now/d}-000001'
setup.ilm.policy_name: client2
setup.ilm.rollover_alias: client2
setup.kibana:
  host: http://192.168.0.35:5601
  space.id: client2
setup.template.name: client2
setup.template.pattern: client2*

output:
  elasticsearch:
    hosts:
    - 192.168.0.35:9200
    index: client2
    password: ${ES_PWD}
    username: client2

logging:
  files:
    rotateeverybytes: 10485760
Not that I know of. The index pattern object is in the visualisation/dashboard JSON file.
hendry-lim
on 19 Aug 2020
Ok so my choice to resolve that problem is to replace metricbeat-* by index pattern id in all *.json files. Then re-run metricbeat setup --dashboards .
Doing that job could be a feature. When running metricbeat setup, retrieve the index pattern ID and replace every occurence of metricbeat-* by the ID.
Anyway, thank you @hendry-lim !
Xat59
on 19 Aug 2020
Yup, I feel your pain, because I am also facing a similar issue with dashboards from the Elastic Agent packages clashing with existing Beats dashboards, which unfortunately afaik, there is no easy workaround.
hendry-lim
on 19 Aug 2020
Anyway, that's really strange because some visualizations work by default without the need to replace something in *.json files. But for some, I have to replace metricbeat-* by the index-pattern ID.
Xat59
on 19 Aug 2020
They work differently. The TSVB has its index pattern in each visualisation, while classic visualisations refer to the index pattern by ID.
hendry-lim
on 19 Aug 2020
Pinging @elastic/integrations-services (Team:Services)
 elasticmachine
on 21 Aug 2020
elasticmachine
on 21 Aug 2020
Is there any ETA on a fix for this?
 bevano8
on 30 Sep 2020
bevano8
on 30 Sep 2020
Related issues
 kemra102
·
3Comments
kemra102
·
3Comments
 andrewkroh
·
3Comments
andrewkroh
·
3Comments
 ycombinator
·
3Comments
ycombinator
·
3Comments
 TomaszKlosinski
·
3Comments
TomaszKlosinski
·
3Comments
 marian-craciunescu
·
3Comments
marian-craciunescu
·
3Comments
Most helpful comment
Ok so my choice to resolve that problem is to replace
metricbeat-*by index pattern id in all *.json files. Then re-runmetricbeat setup --dashboards.Doing that job could be a feature. When running
metricbeat setup, retrieve the index pattern ID and replace every occurence ofmetricbeat-*by the ID.Anyway, thank you @hendry-lim !