Beats: [BUG] MetricBeat Very High Resource Usage
How it occurred:
1) I installed the 7.9 BC5 Agent with a default policy on an idle Windows 10 1909 VM with 6 cores and 6GB of RAM
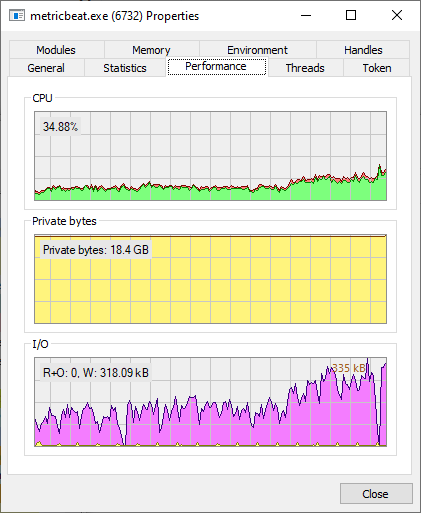
2) It ran MetricBeat. MetricBeat jumped to 18GB of RAM and maxed out several of the CPU cores. Because my VM only had 6GB, this means it had to page at least 12GB to disk.
Version metricbeat-7.9.0-SNAPSHOT-windows-x86_64.zip.sha512:
a94a0ecceb0bd7e073d7c5eac8dc19c6739b4f176bfb35a5bd2a0964909e4147bb3a229a45411b344cb54842f4217730a608bc0a9fbf97dfa1db86f8f5450971 metricbeat-7.9.0-SNAPSHOT-windows-x86_64.zip
I saved a full memory dump of the process. Ping me in Slack and I'll send it to you. I also have the exact metricbeat-7.9.0-SNAPSHOT-windows-x86_64.zip if you need it.
 gabriellandau
All 7 comments
Pinging @elastic/integrations-services (Team:Services)
 elasticmachine
on 4 Sep 2020
elasticmachine
on 4 Sep 2020
Hi @gabriellandau ! Sorry for the late response, it seems some of the bots did not trigger and we lost this one in the triage. Did you find the same issue with any of the later 7.9 BCs or 7.9.1? Thanks
 andresrc
on 4 Sep 2020
andresrc
on 4 Sep 2020
I haven't been looking for the issue. @narph reached out to me a few weeks back, and I provided her with a memory dump. Hopefully the memory dump will indicate the source of the growth.
gabriellandau
on 4 Sep 2020
What is the current status of this problem? Can we expect it to exist in V7.9.2 as well?
 MorrieAtElastic
on 1 Oct 2020
MorrieAtElastic
on 1 Oct 2020
What modules were being used in this case?
 jsoriano
on 3 Nov 2020
jsoriano
on 3 Nov 2020
Commenting to note that it seems like so far no one has been able to open the heap dump in question -- when I tried (using GoLand which claims to be able to open windows heap dumps on all platforms) it thinks for half an hour then gives a "debugger disconnected" error with the following output:
/Applications/GoLand.app/Contents/plugins/go/lib/dlv/mac/dlv --listen=0.0.0.0:58551 --headless=true --api-version=2 --check-go-version=false --only-same-user=false core /Users/fae/Downloads/metricbeat-7.9.0-SNAPSHOT-windows-x86_64/metricbeat.exe /Users/fae/Downloads/metricbeat.DMP --
API server listening at: [::]:58551
decoding dwarf section info at offset 0x0: too short

Debugger finished with exit code 1
 faec
on 4 Nov 2020
faec
on 4 Nov 2020
We have not been able to reproduce this issue in any release version. The memory increases we have reproduced have always been related to growing queues due to a combination of back-pressure from the output and big events.
Please reopen if you are able to reproduce it with a release version and can generate and updated memory dump.
Thanks
andresrc
on 25 Nov 2020
Related issues
 musayev-io
·
3Comments
musayev-io
·
3Comments
 dedemorton
·
3Comments
dedemorton
·
3Comments
 andrewkroh
·
3Comments
andrewkroh
·
3Comments
 nicpenning
·
3Comments
nicpenning
·
3Comments
 ycombinator
·
3Comments
ycombinator
·
3Comments
Most helpful comment
What is the current status of this problem? Can we expect it to exist in V7.9.2 as well?