Beats: Possible auditbeat 7.8.0 memory leak if es host is unreachable
- Version: 7.8.0 (from
https://artifacts.elastic.co/packages/7.x/apt stable/main amd64) - Operating System:
Ubuntu 18.04.4 LTS - Steps to Reproduce:
I noticed excessive memory usage on one of our hosts. Turns out this started on the same date that auditbeat had been installed. Also it tunred out that the elasticsearch host was not reachable. The relevant auditbeat logs looked like these:
jul 01 00:00:36 INFO  [monitoring] log/log.go:145        Non-zero metrics in the last 30s {"monitoring": {"metrics": {"auditd":{"kernel_lost":7},"beat":{"cpu":...
jul 01 00:01:06 INFO  [monitoring] log/log.go:145        Non-zero metrics in the last 30s {"monitoring": {"metrics": {"beat":{"cpu":{"system":{"ticks":405060,"...
jul 01 00:01:08 INFO  [auditd]     auditd/audit_linux.go:364  kernel lost events: 4 (total: 172642)
jul 01 00:01:36 INFO  [monitoring] log/log.go:145        Non-zero metrics in the last 30s {"monitoring": {"metrics": {"auditd":{"kernel_lost":4},"beat":{"cpu":...
jul 01 00:02:06 INFO  [monitoring] log/log.go:145        Non-zero metrics in the last 30s {"monitoring": {"metrics": {"beat":{"cpu":{"system":{"ticks":405060,"...
jul 01 00:02:08 INFO  [auditd]     auditd/audit_linux.go:364  kernel lost events: 3 (total: 172645)
jul 01 00:02:34 ERROR [publisher_pipeline_output]        pipeline/output.go:106  Failed to connect to backoff(elasticsearch(https://es.log...:30920)): Get https..
jul 01 00:02:34 INFO  [publisher_pipeline_output]        pipeline/output.go:99   Attempting to reconnect to backoff(elasticsearch(https://es.log...:30920)) ..
  .. with 22431 reconnect attempt(s)
jul 01 00:02:34 INFO  [publisher]  pipeline/retry.go:196 retryer: send unwait-signal to consumer
jul 01 00:02:34 INFO  [publisher]  pipeline/retry.go:198  done
jul 01 00:02:34 INFO  [publisher]  pipeline/retry.go:173 retryer: send wait signal to consumer
jul 01 00:02:34 INFO  [publisher]  pipeline/retry.go:175  done
(repeat forever)
According to Zabbix, we lost about 2+GB of memory during period of 30+ days (and more than 22K reconnects).
We have just now fixed access to the ES node, so I hope the memory leak is gone. (If it isn't, then something else is going on.)
This might be something worth looking into. I'll report back if the unreachable host was _not_ the cause.
 wdoekes
All 11 comments
Hey @wdoekes,
Thanks for your report. We use to keep Github for confirmed bugs and enhancement requests, could you please open a topic on https://discuss.elastic.co/c/elastic-stack/beats/28 to continue with the investigation of this case?
I will close this on the meantime, till a possible bug is confirmed.
For this case, the used configuration, and a memory dump can help to diagnostic the problem.
 jsoriano
on 3 Jul 2020
jsoriano
on 3 Jul 2020
Thanks for the response, Jaime. I won't be going to the discuss board just yet, as the only interest I have in auditbeat right now, is that it shouldn't eat my memory. If that changes, I'll find the discuss board :+1:
wdoekes
on 6 Jul 2020
Thanks for the response, Jaime. I won't be going to the discuss board just yet, as the only interest I have in auditbeat right now, is that it shouldn't eat my memory. If that changes, I'll find the discuss board +1
Yeah, it shouldn't actually take all the memory. Could you share the configuration you are using? and a memory dump?
jsoriano
on 6 Jul 2020
I added --httpprof yesterday (18 hours ago). And copied the auditbeat to a similar server that did not have access to see if it was indeed easily reproducable.
See this screenshot, where ns1 _has_ access to elastic, and ns2 _does not_:
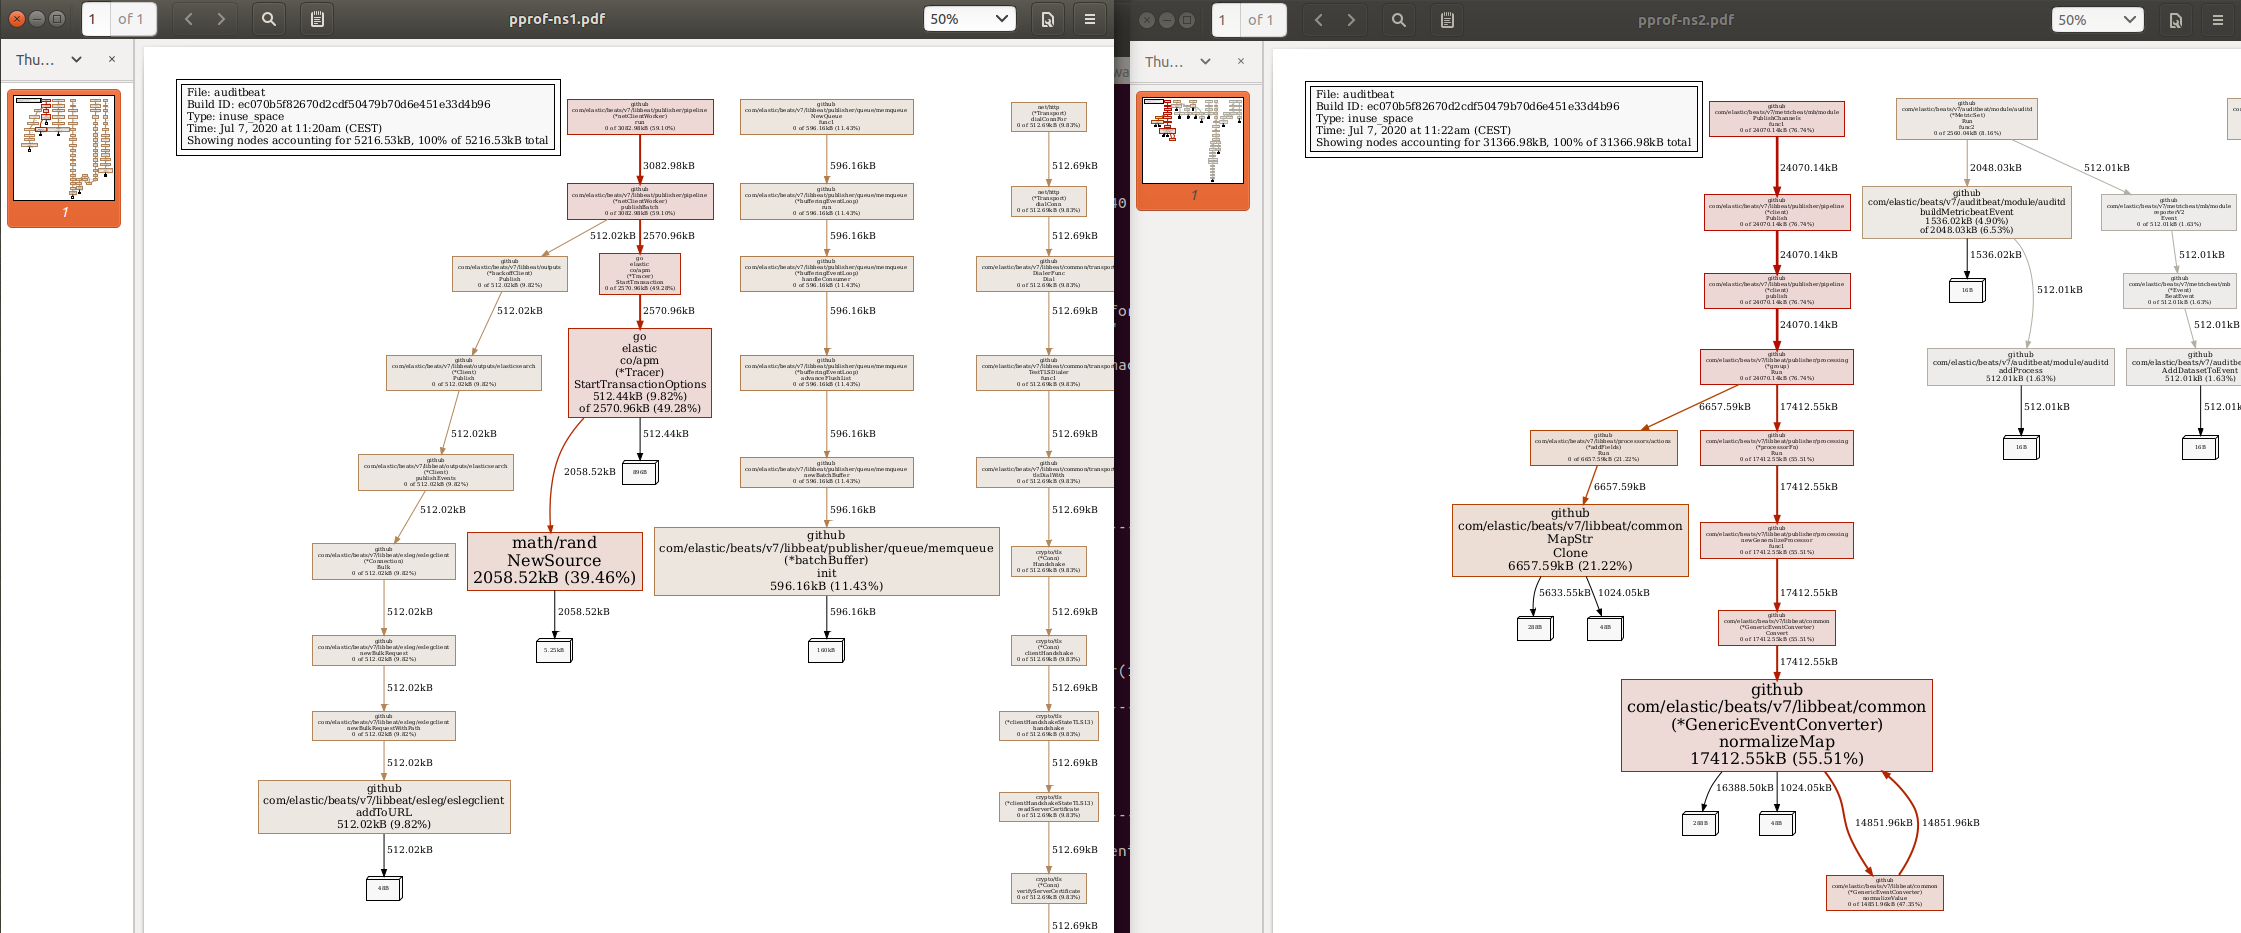
It looks like ns1 uses 5MB and ns2 (with connection failures) uses 31MB already.
As mentioned, auditbeat is taken from the elastic repo:
# apt-cache policy auditbeat
auditbeat:
  Installed: 7.8.0
  Candidate: 7.8.0
  Version table:
 *** 7.8.0 500
        500 https://artifacts.elastic.co/packages/7.x/apt stable/main amd64 Packages
        100 /var/lib/dpkg/status
Changed config consists of an replaced auditbeat.yml and /var/lib/auditbeat.keystore.
/etc/auditbeat# cat auditbeat.yml | sed -e '/^ *#/d;/^$/d;s/^ hosts: [[].*/ hosts: ["hidden:30920"]/'
auditbeat.modules:
- module: auditd
  audit_rule_files: [ '${path.config}/audit.rules.d/*.conf' ]
  audit_rules: |
    -w /etc/group -p wa -k identity
    -w /etc/passwd -p wa -k identity
    -w /etc/gshadow -p wa -k identity
- module: file_integrity
  paths:
  - /bin
  - /usr/bin
  - /sbin
  - /usr/sbin
  - /etc
- module: system
  datasets:
    - package # Installed, updated, and removed packages
  period: 2m # The frequency at which the datasets check for changes
- module: system
  datasets:
    - host    # General host information, e.g. uptime, IPs
    - login   # User logins, logouts, and system boots.
    - process # Started and stopped processes
    - user    # User information
  state.period: 12h
  user.detect_password_changes: true
  login.wtmp_file_pattern: /var/log/wtmp*
  login.btmp_file_pattern: /var/log/btmp*
setup.template.settings:
  index.number_of_shards: 1
output.elasticsearch:
  hosts: ["hidden:30920"]
  protocol: "https"
  username: ${ES_USER}
  password: ${ES_PWD}
processors:
  - add_host_metadata: ~
  - add_cloud_metadata: ~
  - add_docker_metadata: ~
Anything more I can get you?
wdoekes
on 7 Jul 2020
@wdoekes thanks for your analysis.
I have tried the scenario you mention and I could actually reproduce an increase of memory usage, but I think this can be expected, let me explain.
Beats have an internal memory queue, this queue is used to prepare batches to send events to outputs in a more efficient way. It also helps preserving events in case the output is not available during some time, to avoid data loss. You can read more about this queue here: https://www.elastic.co/guide/en/beats/auditbeat/7.8/configuring-internal-queue.html
I think that the memory increase you see is caused by the events stored on this internal queue.
I tried some things to speed-up the experiment:
- Reducing the maximum backoff delay, so retries happen much more frequently:
output.elasticsearch:
  ...
  backoff.init: 100ms
  backoff.max: 500ms
- Reducing the collection periods in auditbeat modules (
period: 10sandstate.period: 30s), so they generate many more events.
Retrying much faster doesn't increase the memory usage, this would discard any leak caused by these reconnection attempts.
Reducing the collection period by itself does increase the memory usage. But, on my experiment, this memory is released if Elasticsearch is recovered, so it seems that something is being stored in memory while Elasticsearch is down. This leads to the memory queue.
I tried then to reduce a lot the size of the memory queue, so it keeps less events, and then I saw that the memory doesn't increase. You can try that with the following config:
queue.mem:
  events: 32
  flush.min_events: 16
So I would discard a leak if the memory usage is corrected after Elasticsearch is up again. If long downtimes can be expected in your deployment, and the internal queue is taking a lot of memory, you can consider alternatives as spooling to disk.
In any case 2GB seems too much for an internal queue, there may be some area of improvement in how memory is managed on these cases, but I wonder if it worths optimizing for the case of having an output down for so long :slightly_smiling_face:
jsoriano
on 7 Jul 2020
Well. Thanks for looking into this this verbosely!
I think we can leave this closed seeing that you have a valid explanation for excess memory usage and have provided workarounds in case it is troublesome.
(Out of curiosity, I'll leave the second auditbeat running for a while longer, to see if memory buildup does accrue in unexpected places. If I notice anything unusual, I'll be back.)
wdoekes
on 7 Jul 2020
So. I decided to spend some more time on this, and I can come up with the following conclusions:
What I know
- auditbeat itself does _not_ leak memory
- auditbeat causes the kernel to allocate audit_queue memory
- while auditbeat is running, this memory keeps increasing (even though it shouldn't)
- this has caused severe system degradation on two virtual machines (VMs with 1 and 2 cpu cores)
What I don't know
- is the (unjust) memory consumption caused by bad (audit netlink) behaviour from auditbeat?
- or is it bad behaviour by the kernel?
- is the memory eventually freed? or lost forever?
How to reproduce
- as above
- it may be possible to speed things up by setting backlog_limit to (kernel default) 64 instead of the (auditbeat) default 8192 (_unrelated side-note: examples show 8196 instead of 8192_)
- now, trigger lots of audit events, for example by logging in continuously
Results, when I did lots of audit events between 11:17 and 12:07:
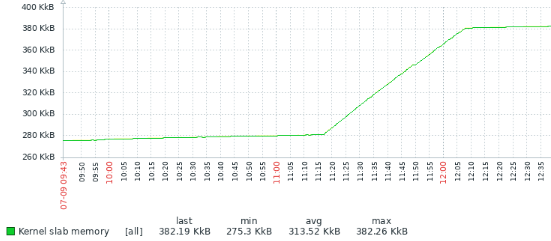
This can be seen in Slab: and SUnreclaim: in /proc/meminfo and in increased usage of kmalloc-2048 and kmalloc-256:
# diff -u /root/meminfo-1* | grep -E 'Slab|SUnreclaim|SReclaim'
-Slab:             282800 kB
+Slab:             379088 kB (+100MB)
-SReclaimable:     113300 kB
+SReclaimable:     114364 kB (no change)
-SUnreclaim:       169500 kB
+SUnreclaim:       264724 kB (+100MB)
and
# diff -u /root/slabinfo-1* | grep -E '^.kmalloc-(2048|1024|512|256)'
-kmalloc-2048       68272  68272   2048    8    4 : tunables    0    0    0 : slabdata   8534   8534      0
+kmalloc-2048      111264 111264   2048    8    4 : tunables    0    0    0 : slabdata  13908  13908      0
-kmalloc-1024        1026   1056   1024    8    2 : tunables    0    0    0 : slabdata    132    132      0
+kmalloc-1024        1066   1072   1024    8    2 : tunables    0    0    0 : slabdata    134    134      0
-kmalloc-512          689    776    512    8    1 : tunables    0    0    0 : slabdata     97     97      0
+kmalloc-512          700    776    512    8    1 : tunables    0    0    0 : slabdata     97     97      0
-kmalloc-256        68448  68448    256   16    1 : tunables    0    0    0 : slabdata   4278   4278      0
+kmalloc-256       111408 111408    256   16    1 : tunables    0    0    0 : slabdata   6963   6963      0
The kernel logs these:
Jul  9 12:25:01 ns2 kernel: [75129.743577] audit: audit_backlog=111763 > audit_backlog_limit=8192
Jul  9 12:25:01 ns2 kernel: [75129.743580] audit: audit_lost=16714 audit_rate_limit=0 audit_backlog_limit=8192
The backlog went up by about 42K (=100MB). (In my original situation, I was at audit_backlog=964464. So, 964464÷42000×100=2GB, perfect match.)
And that's the interesting bit: the backlog of 111763 should never get much higher than 8192.
So, it appears that the kernel is allocating audit events when it shouldn't.
The following source code -- Ubunut/Bionic kernel 4.15.0-108 -- manages this:
struct audit_buffer *audit_log_start(struct audit_context *ctx, gfp_t gfp_mask,
             int type)
{
...
        if (audit_rate_check() && printk_ratelimit())
          pr_warn("audit_backlog=%d > audit_backlog_limit=%d\n",
            skb_queue_len(&audit_queue),
            audit_backlog_limit);
        audit_log_lost("backlog limit exceeded");
        return NULL;
...

void audit_log_end(struct audit_buffer *ab)
{
...
    /* queue the netlink packet and poke the kauditd thread */
    skb_queue_tail(&audit_queue, skb);
If there is no allocated audit_buffer, then it cannot be appended to audit_queue.
_So, audit_queue should never really grow beyond 8192 items._ But it does...
Here's where I'm not sure what happens. There are three cases I can think of that would cause audit_queue to be enlarged without checking the queue size:
  /* NOTE: don't ever fail/sleep on these two conditions:
   * 1. auditd generated record - since we need auditd to drain the
   *    queue; also, when we are checking for auditd, compare PIDs using
   *    task_tgid_vnr() since auditd_pid is set in audit_receive_msg()
   *    using a PID anchored in the caller's namespace
   * 2. generator holding the audit_cmd_mutex - we don't want to block
   *    while holding the mutex */
  if (!(auditd_test_task(current) ||
        (current == __mutex_owner(&audit_cmd_mutex)))) {
and, number 3, if dequeueing -- but failing -- made the queue small enough for someone else to add new records in the mean time:
static int kauditd_send_queue(struct sock *sk, u32 portid,
            struct sk_buff_head *queue,
            unsigned int retry_limit,
            void (*skb_hook)(struct sk_buff *skb),
            void (*err_hook)(struct sk_buff *skb))
...
  while ((skb = skb_dequeue(queue))) {
...
        /* no - requeue to preserve ordering */
        skb_queue_head(queue, skb);
I don't know when 1 or 2 would happen, and I'm not sure if 3 is even possible.
And coming back to my original questions: I don't know if the kernel or auditbeat is to blame.
_Maybe someone with some in-depth kernel knowledge knows..._
wdoekes
on 9 Jul 2020
@wdoekes wow, great investigation, thanks a lot! I think I am going to summon someone with more auditbeat knowledge than me to follow up :slightly_smiling_face:
@andrewkroh @adriansr could any of you take a look to this issue?
is the memory eventually freed? or lost forever?
@wdoekes is the memory released once Elasticsearch is up? and after restarting auditbeat?
jsoriano
on 9 Jul 2020
Pinging @elastic/siem (Team:SIEM)
 elasticmachine
on 9 Jul 2020
elasticmachine
on 9 Jul 2020
@jsoriano: Looks like things are freed.. after a while...
_The following graphs are Slab: from /proc/meminfo:_
case 1: ES comes back up: all memory is freed :ok:
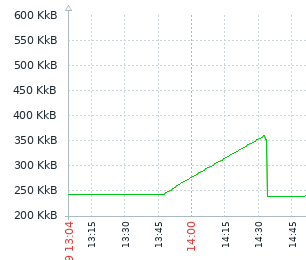
case 2: when auditbeat is stopped (~13:40) and started (~15:05) memory is not freed, but after being stopped a _second_ time (~17:10), it is:
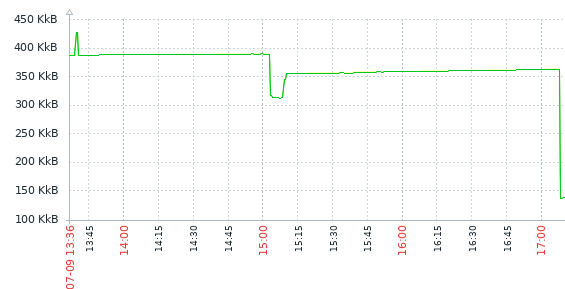
case 3: when auditbeat is restarted (gets a new pid) before it regains access to ES (~17:00), it appears it needs a second restart for full freeing of memory, but then the memory is indeed freed:
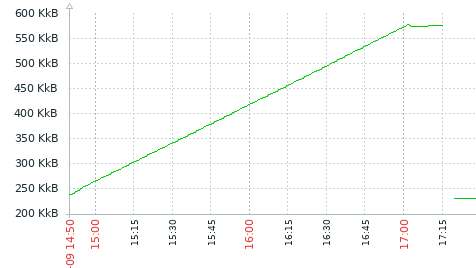
(However, in this last case, I'm only 90% sure about the needed 2nd restart. The system was already so overloaded it did not respond as it should.)
wdoekes
on 9 Jul 2020
Interesting analysis. I haven't taken a deep look. But one thing that comes to mind is that Auditbeat has a config option for its backpressure_strategy (docs). Using both to add in the userspace mitigation might help workaround the issue that the kernel is allocated beyond its backlog_limit. The userspace mitigation caused the module to continue to drain the netlink socket even if the ES output is blocked.
 andrewkroh
on 13 Jul 2020
andrewkroh
on 13 Jul 2020
Related issues
jsoriano
·
3Comments
andrewkroh
·
3Comments
 TomaszKlosinski
·
3Comments
TomaszKlosinski
·
3Comments
 feelan03
·
3Comments
feelan03
·
3Comments
 JalehD
·
3Comments
JalehD
·
3Comments