Beats: Prometheus Remote Write Optimizations
In scenarios where Prometheus send events in high rate, after some time errors like write accept: too many open files; retrying in 1s are reported from Metricbeat.
In these cases the open connections are remain open for some time which leads to reaching the fd limit of the system:
> lsof -a -p 23431 | wc -l
260
The same will happen if Metricbeat is stopped but Prometheus keeps trying to send data to Metricbeat, and as result on the next startup of Metricbeat too many data will be received.
Consequently we need to investigate if we need to improve the performance on our side, where one option would be to move time consuming parts (protoToSamples and samplesToEvents -> https://github.com/elastic/beats/blob/21be671e9b0b8b85bf7e7bd090e49be64a68c425/metricbeat/module/prometheus/remote_write/remote_write.go#L103) to the main thread so as to release connections earlier. We need to investigate if this would be safe in terms of data loss, even if those two methods do not return an error. In addition what will happen in case that ES , for instance is not reachable, will this situation lead to a potential data loss and do we want to handle it?
This can also be tackled on Prometheus side by tuning (queue_config) it accordingly.
Follow up of https://github.com/elastic/beats/pull/17031.
cc: @elastic/integrations-platforms
 ChrsMark
All 12 comments
Thank you for opening this! I understand there is a limit to the number of connections Prometheus opens to the remote_write API, we should investigate if this is happening because they always try to maximize the flow or we are too slow on ingesting them. In Linux systems normally the FD limits are on 1024, you may be hitting this because of Mac.
If tuning Prometheus queue or ulimit on our side is enough I think we can fix this in the docs.
 exekias
on 23 Mar 2020
exekias
on 23 Mar 2020
We can always use LimitListener as @jsoriano mentioned at https://github.com/elastic/beats/pull/17031#discussion_r393238719. In this we will have the control of the data insertion in the queue.
ChrsMark
on 23 Mar 2020
Per our discussions I think we need to do several things here:
- Do a basic benchmark on how
remote_writeperforms and what write limits can we achieve in a local instance - Investigate if the current errors are related to a throughput limit (^) or it's just a limit in the open connections
- In the later case document the required settings. For instance, raise the FD limit when using this.
If we find there is a throughput problem we need to talk about it and see how to improve the situation
exekias
on 26 Mar 2020
Per our discussions I think we need to do several things here:
- Do a basic benchmark on how
remote_writeperforms and what write limits can we achieve in a local instance- Investigate if the current errors are related to a throughput limit (^) or it's just a limit in the open connections
- In the later case document the required settings. For instance, raise the FD limit when using this.
If we find there is a throughput problem we need to talk about it and see how to improve the situation
Regarding the fd limit issue, it seems that max_shards is the key here. It is actually the maximum number of concurrency and its default value is 1000 which means that maybe Prometheus at some point will try to open 1000 connections in parallel making Metricbeat reaching the limits. Setting this configuration option to a reasonable value like 100 fixes the issue of exceeding the fd limit of the system.
The same can be achieved by increasing the respective limit of the system with ulimit -n 1024 for instance.
ChrsMark
on 27 Mar 2020
That sounds reasonable, this is probably intended to distribute the load across several workers, or just to leverage concurrency. What do you think about explaining this in the remote_write metricset docs?
exekias
on 31 Mar 2020
Giving a heads-up on this, I did some vary basic experiments to measure the performance of the whole solution. Here are the results:
Scenario
The scenario consists of:
- various number of NodeExporters (
prom/node-exporter:v0.18.1) - Prometheus scraping from nodeExporters every
5s - Prometheus(
prom/prometheus:v2.16.0) sends data to remote_write of Metricbeat (metricbeat-7.7.0-bc1) - Metricbeat sends data to an Elasticsearch container (
docker.elastic.co/elasticsearch/elasticsearch:8.0.0-SNAPSHOT)
Results
| | Number of exporters | number of Timeseries| succeeded_samples_rate/sec | pending_samples*/sec |
|---|:-:|:-:|:-:|:-:|
| s1 | 5 | 960 | 860| <100 |
| s2| 10| 1663 | 962 | <100 |
| s3 | 22 | 2280 | 1274 | <100 |
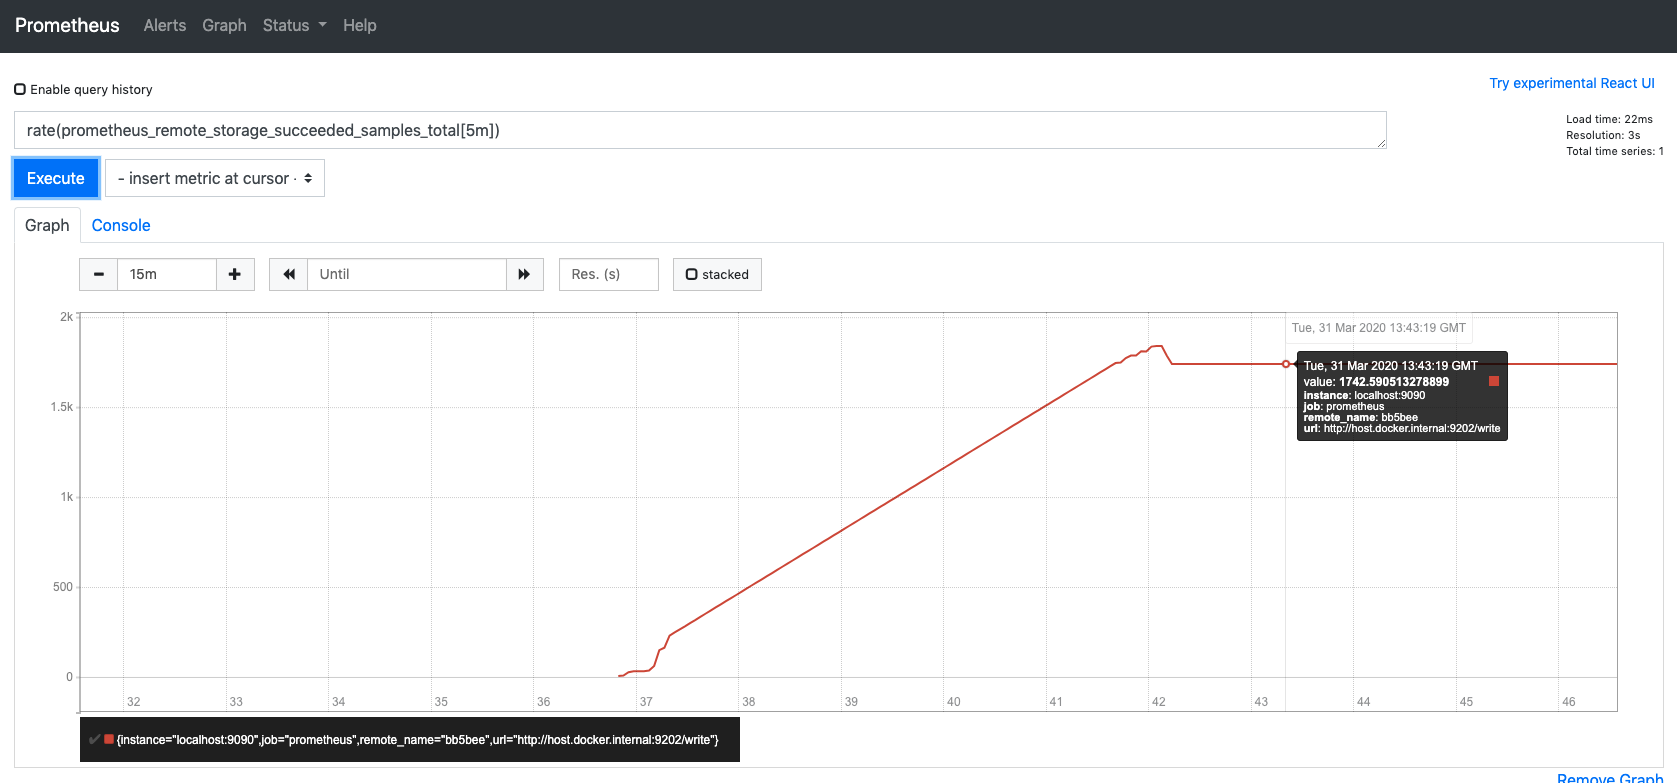
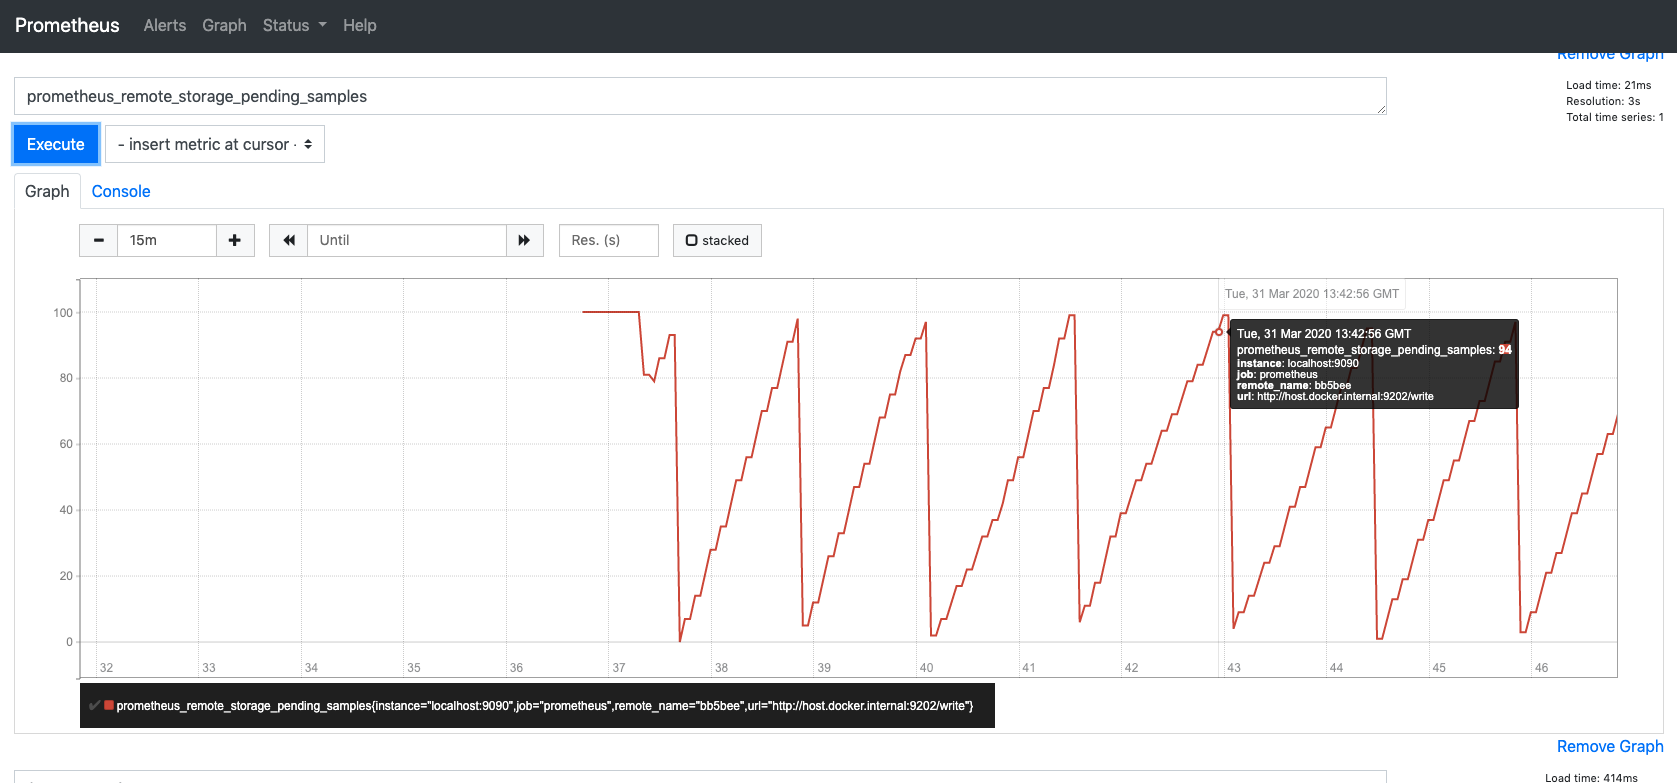
| s4| 40| 3851 | 1742| <100 |
succeeded_samples_rate* = rate(prometheus_remote_storage_succeeded_samples_total[5m])
pending_samples** = prometheus_remote_storage_pending_samples
Screenshots from s4 execution:
Notes
More aggressive benchmarks could be used here, however one should have in mind that this solution scales efficiently by adding more Metricbeat instances and configuring Prometheus to send to all of them.
cc: @exekias @andresrc @sorantis
ChrsMark
on 31 Mar 2020
Love to see this @ChrsMark! Is there any way to detect if samples were dropped because of busy remote endpoint? I'm not sure if Prometheus has such option (and metric) but it would be good to check it if it exists
exekias
on 2 Apr 2020
Love to see this @ChrsMark! Is there any way to detect if samples were dropped because of busy remote endpoint? I'm not sure if Prometheus has such option (and metric) but it would be good to check it if it exists
Actually there are a couple of metrics which can also give good insights:
prometheus_remote_storage_dropped_samples_totalprometheus_remote_storage_failed_samples_totalprometheus_remote_storage_retried_samples_total
Running s4 scenario to monitor these metrics I can only see prometheus_remote_storage_retried_samples_total having some spikes in the beginning but after some point it is constantly 0.
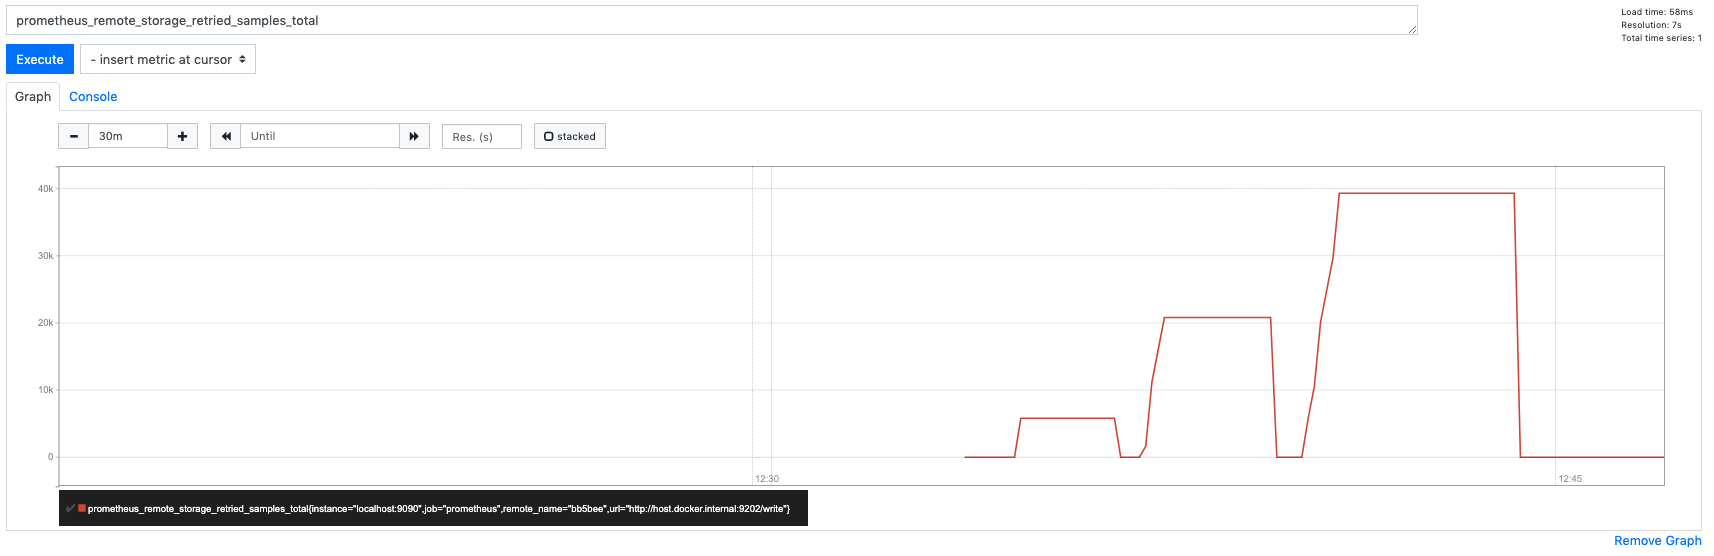
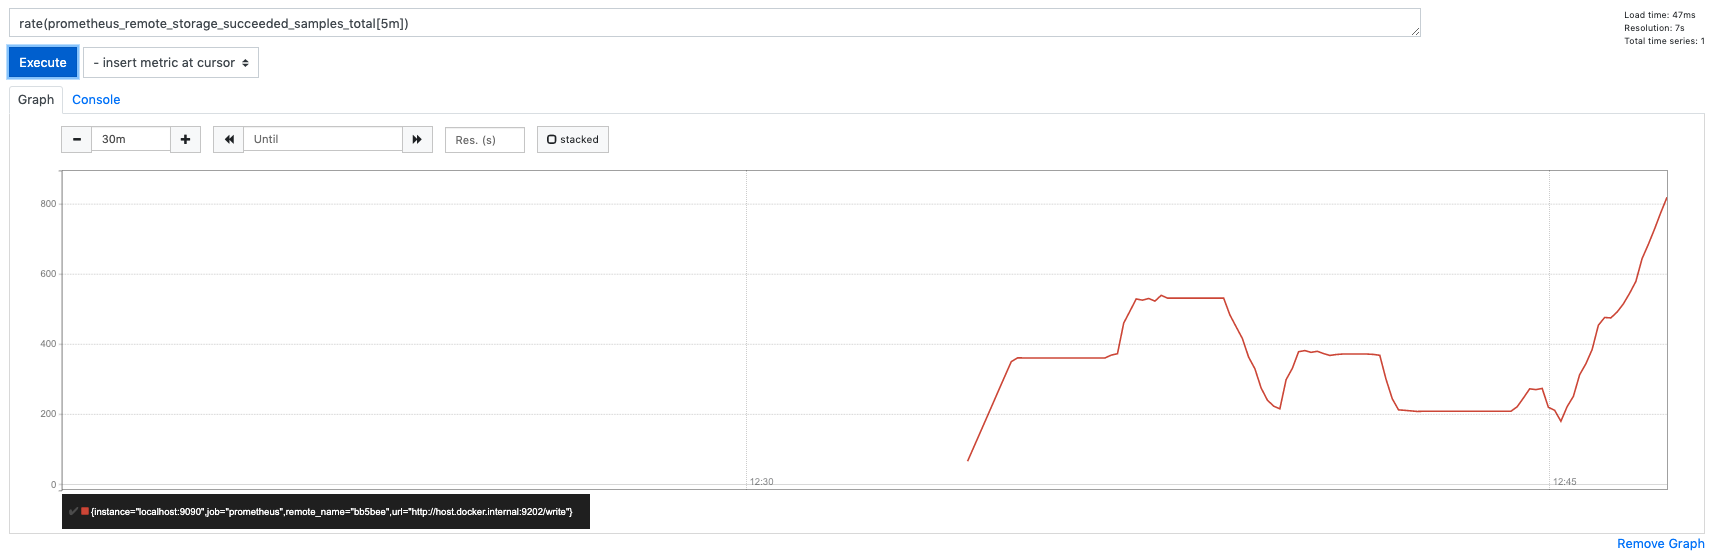
Also we can see the correlation of retried and succeeded.
ChrsMark
on 2 Apr 2020
Bench Round 2
Scenario
The scenario consists of:
- various number of NodeExporters (
prom/node-exporter:v0.18.1) - Prometheus scraping from nodeExporters every
5s - Prometheus(
prom/prometheus:v2.16.0) sends data to remote_write of Metricbeat (metricbeat-7.7.0-bc5) - Metricbeat sends data to a 3 Node Elasticsearch Cluster at Elastic Cloud (Instance v7.6.2 8 GB RAM, gcp, frankfurt):
- Metricbeat runs on gcp VM [n1-standard-8 (8 vCPUs, 30 GB memory), frankfurt]
Results
| | Number of exporters | number of Timeseries | max_shards | max_samples_per_send | succeeded_samples_rate/sec | pending_samples* | retried/failed/dropped* | shards | Events in ES per 30sec |
| --- |:-------------------:|:--------------------:|:----------:|:--------------------:| --------------------------- | ----------------- | ------------------------- | ------ |:------------------- |
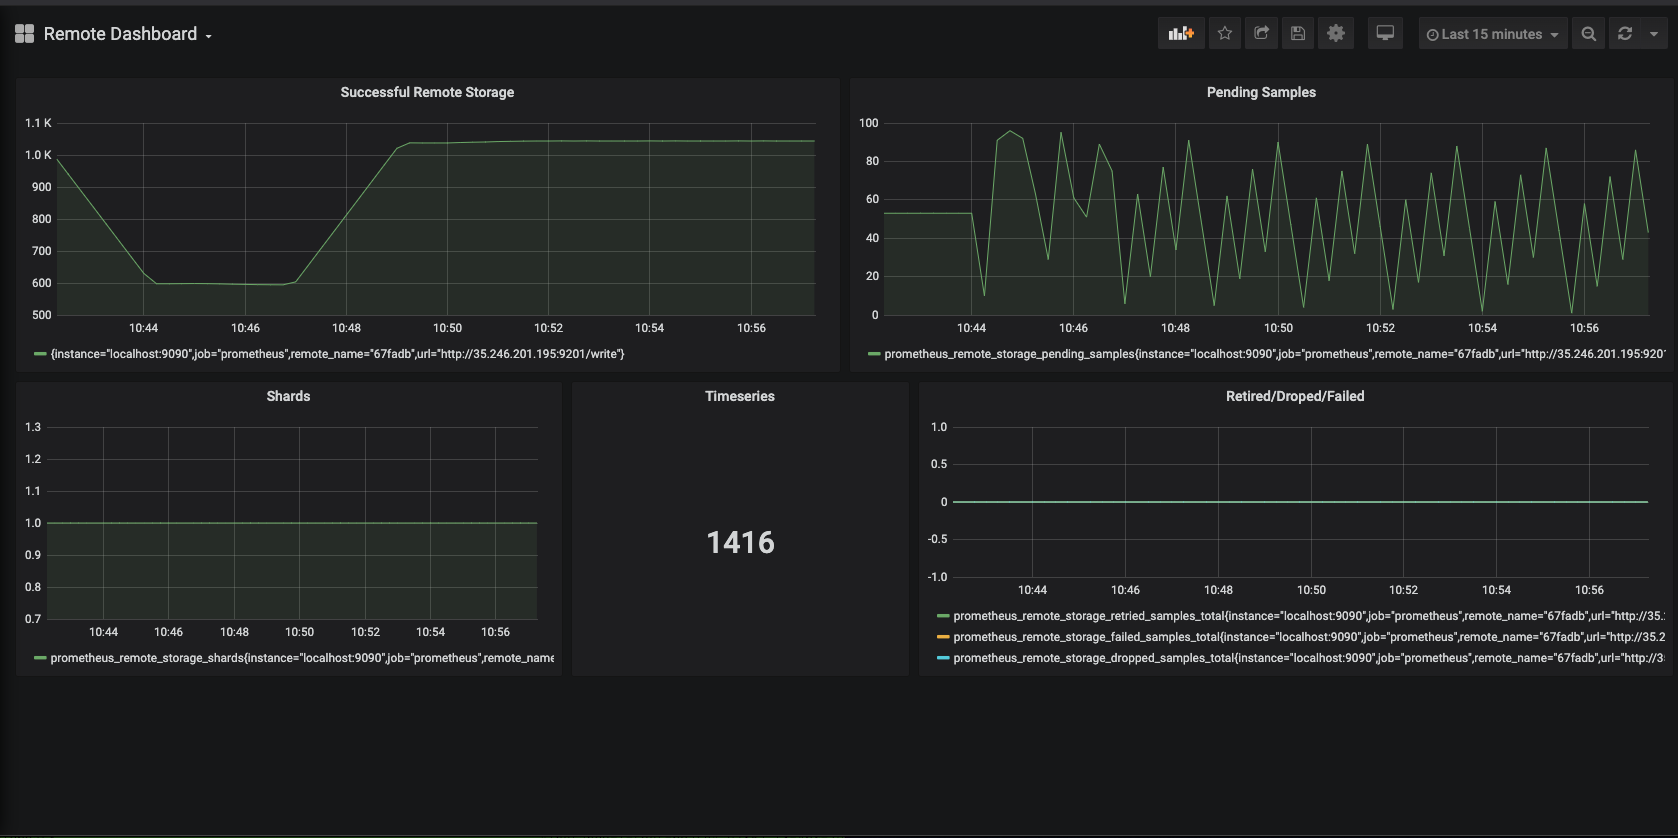
| s1 | 12 | 1416 | 1000 | 100 | 1038 | ==90 | 0 | 1 | 22K |
| s2 | 12 | 1416 | 10 | 100 | 1038 | ==100 | 0 | 1 | 22K |
| s3 | 12 | 1416 | 10 | 500 | 1038 | ==500 | 0 | 1 | 22K |
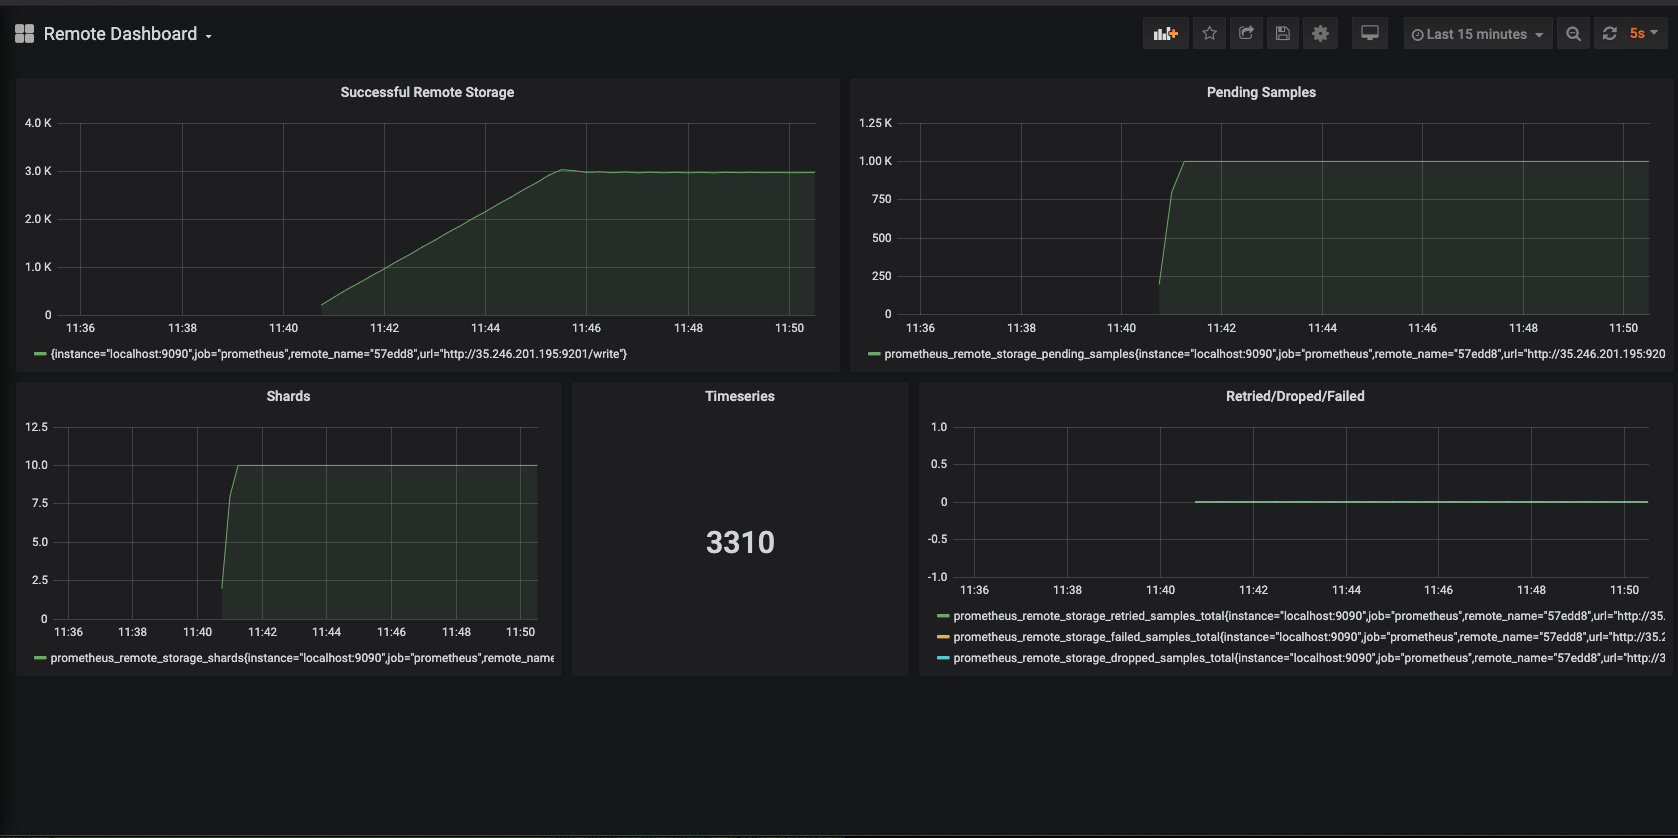
| s4 | 50 | 3300 | 10 | 100 | 3000 | ==1000 | 0 | 10 | 67K |
| s5 | 50 | 3300 | 10 | 500 | 3600 | ==5000 | 0 | 10 | 65K |
| s6 | 80 | 5100 | 10 | 500 | 3700 | ==5000 | 0 | 10 | 69K |
| s7 | 80 | 5100 | 10 | 1000 | 3800 | ==10000 | 0 | 10 | 69K |
| s8 | 100 | 6339 | 10 | 500 | 3700 |==5000 | 0 | 10 | 69K |
| s9 | 100 | 6339 | 10 | 1000 | 3800 | ==10000 | 0 | 10 | 67K |
| s10 | 100 | 6339 | 100 | 500 | 2700 | ==50000 | 30K | 100 | 70K |
| s11 | 100 | 6339 | 4 | 500 | 5100 | ==2000 | 0 | 4 | 63K |
| s12 | 100 | 6339 | 6 | 500 | 5400 | ==3000 | 0 | 6 | 63K |
In all executions: capacity=5*max_samples_per_send
succeeded_samples_rate* = rate(prometheus_remote_storage_succeeded_samples_total[5m])
pending_samples** = prometheus_remote_storage_pending_samples
failed_samples = prometheus_remote_storage_failed_samples_total
dropped_samples = prometheus_remote_storage_dropped_samples_total
retried_samples = prometheus_remote_storage_retried_samples_total
S1 Screenshot:
S4 Screenshot:
Conclusions
max_shardsshould be set equal to the number of cores of the machine where metricbeat runs. In our setup Metricbeat was running on a 8 core machine which means that Metricbeat can achieve 8x parallelism (6 cores for handling the remote connections, 1 for main routine and leave 1 free for the system). Configuring the Prometheus queue to something bigger can cause issues and data loss like ins10.max_samples_per_sendcan be set to be bigger than the default resulting in a slightly better throutghput, however this would have an impact in memory usage of Metricbeat.- In all cases
retried/dropped/failedsamples remain 0 indicating the health of the whole queue system.
ChrsMark
on 13 Apr 2020
thanks for the additional investigation @ChrsMark! looks like we have a good bunch of concrete recommendations to make now 👍
 roncohen
on 14 Apr 2020
roncohen
on 14 Apr 2020
@ChrsMark thanks for running these benchmarks, this is great. To Ron's point, I think these recommendations should be part of our documentation for remote_write metricset.
 sorantis
on 14 Apr 2020
sorantis
on 14 Apr 2020
Closing this one for now, since docs have been updated on https://github.com/elastic/beats/pull/17384.
ChrsMark
on 21 Apr 2020
Related issues
 dedemorton
·
3Comments
dedemorton
·
3Comments
 feelan03
·
3Comments
feelan03
·
3Comments
 pigletfly
·
3Comments
pigletfly
·
3Comments
 musayev-io
·
3Comments
musayev-io
·
3Comments
 JalehD
·
3Comments
JalehD
·
3Comments
Most helpful comment
Bench Round 2
Scenario
The scenario consists of:
prom/node-exporter:v0.18.1)5sprom/prometheus:v2.16.0) sends data to remote_write of Metricbeat (metricbeat-7.7.0-bc5)Results
| | Number of exporters | number of Timeseries | max_shards | max_samples_per_send | succeeded_samples_rate/sec | pending_samples* | retried/failed/dropped* | shards | Events in ES per 30sec |
| --- |:-------------------:|:--------------------:|:----------:|:--------------------:| --------------------------- | ----------------- | ------------------------- | ------ |:------------------- |
| s1 | 12 | 1416 | 1000 | 100 | 1038 | ==90 | 0 | 1 | 22K |
| s2 | 12 | 1416 | 10 | 100 | 1038 | ==100 | 0 | 1 | 22K |
| s3 | 12 | 1416 | 10 | 500 | 1038 | ==500 | 0 | 1 | 22K |
| s4 | 50 | 3300 | 10 | 100 | 3000 | ==1000 | 0 | 10 | 67K |
| s5 | 50 | 3300 | 10 | 500 | 3600 | ==5000 | 0 | 10 | 65K |
| s6 | 80 | 5100 | 10 | 500 | 3700 | ==5000 | 0 | 10 | 69K |
| s7 | 80 | 5100 | 10 | 1000 | 3800 | ==10000 | 0 | 10 | 69K |
| s8 | 100 | 6339 | 10 | 500 | 3700 |==5000 | 0 | 10 | 69K |
| s9 | 100 | 6339 | 10 | 1000 | 3800 | ==10000 | 0 | 10 | 67K |
| s10 | 100 | 6339 | 100 | 500 | 2700 | ==50000 | 30K | 100 | 70K |
| s11 | 100 | 6339 | 4 | 500 | 5100 | ==2000 | 0 | 4 | 63K |
| s12 | 100 | 6339 | 6 | 500 | 5400 | ==3000 | 0 | 6 | 63K |
In all executions:
capacity=5*max_samples_per_sendsucceeded_samples_rate* =
rate(prometheus_remote_storage_succeeded_samples_total[5m])pending_samples** =
prometheus_remote_storage_pending_samplesfailed_samples =
prometheus_remote_storage_failed_samples_totaldropped_samples =
prometheus_remote_storage_dropped_samples_totalretried_samples =
prometheus_remote_storage_retried_samples_totalS1 Screenshot:
S4 Screenshot:
Conclusions
max_shardsshould be set equal to the number of cores of the machine where metricbeat runs. In our setup Metricbeat was running on a 8 core machine which means that Metricbeat can achieve 8x parallelism (6 cores for handling the remote connections, 1 for main routine and leave 1 free for the system). Configuring the Prometheus queue to something bigger can cause issues and data loss like ins10.max_samples_per_sendcan be set to be bigger than the default resulting in a slightly better throutghput, however this would have an impact in memory usage of Metricbeat.retried/dropped/failedsamples remain 0 indicating the health of the whole queue system.