Hi filebeat experts,
We still have the memory leak problem on filbeat 6.5.1. Can anyone help us to resolved it or give us some suggestions?
We once used filebeat 6.0 in our production environment but found that there was a memory leak problem. Then we upgraded it to version 6.5.1, in which the memory leak problem is said to be fixed according the filebeat community. Sadly our pressure test on version 6.5.1 is not satisfied and this memory leak problem seems not perfectly fixed. Below are the steps how we run our tests:
1).Every 10 seconds, a log file with 1.6M is generated on two nodes separately, one is deployed with filebeat 6.0, another is deployed with filebeat 6.5.1
We only keep the latest 200 log files on a node and clear the files generated early to free some disk space.
After running for a whole day, both filebeat 6.5.1 and filebeat 6.0 consume some memories. And filebeat 6.5.1 consumes more that filebeat 6.0 does.
We highly suspect that this memory leak problem has something to so with the logs that are cleared in the step
2). Seems that some filebeat harvesters are created to gather the logs that are unluckily cleared before they are harvested. Those harvesters with no logs to harvest throw exceptions and cause the memory leak problem.
Would anyone could help us to look into this issue?
Thanks in advance.
filebeat6.5.1 yml:


 guot626
All 45 comments
Any Update on this issue?
 derekcal
on 19 Feb 2019
derekcal
on 19 Feb 2019
I've multiple filebeats agents running on 3 kubernetes clusters and on all of them the daemonset's pods keeps being OOMKilled. I've already increased the memory limit of the daemonset, but the problem still occurs, so I'm pretty sure this is a memory leak.
This is the CPU / Memory / Disk usage for today alone from our staging environment:

This is the memory for the past week:

The logs at the time the agent is killed by the OOMKiller shows the following:
...
E  Got a start event: map[start:true host:10.36.0.141 kubernetes:<REDACTED-K8S-CRONJOB-POD-SPEC> config:[0xc4571ad260]], generated configs: [0xc4571ad260]
E  Got a meta field in the event
E  Starting reload procedure, current runners: 60
E  Start list: 1, Stop list: 0
E  logs_path matcher log path: /var/lib/docker/containers/
E  logs_path matcher resource type: container
E  kubernetes: Using pod name filebeat-agent-g9sbz and namespace monitoring to discover kubernetes node
E  kubernetes: Using node <REDACTED-NODE-NAME> discovered by in cluster pod node query
E  Using host %!(EXTRA string=<REDACTED-NODE-NAME>)
E  Initializing watcher
E  kubernetes: Performing a resource sync for *v1.PodList
E  kubernetes: Resource sync done
E  kubernetes: Watching API for resource events
E  Configured paths: [/var/lib/docker/containers/14a34bfa803c3d609e432f1dce677f461a53f0c9f795480da650a69555e94945/*.log]
E  Starting runner: input [type=docker, ID=16940689728259619521]
E  Starting input of type: docker; ID: 16940689728259619521
E  Got a stop event: map[meta:{"kubernetes":<REDACTED-K8S-CRONJOB-POD-SPEC>}], generated configs: [0xc44aa17b90]
E  Starting reload procedure, current runners: 61
E  Start list: 0, Stop list: 1
E  Stopping runner: input [type=docker, ID=403242888682445636]
E  Got a start event: map[start:true host:10.36.0.138 kubernetes:<REDACTED-K8S-CRONJOB-POD-SPEC> config:[0xc45238b0e0]], generated configs: [0xc45238b0e0]
E  Got a meta field in the event
E  Starting reload procedure, current runners: 60
E  input ticker stopped
E  Stopping Input: 403242888682445636
E  Start list: 1, Stop list: 0
E  logs_path matcher log path: /var/lib/docker/containers/
E  logs_path matcher resource type: container
E  kubernetes: Using pod name filebeat-agent-g9sbz and namespace monitoring to discover kubernetes node
E  kubernetes: Using node <REDACTED-NODE-NAME> discovered by in cluster pod node query
E  Using host %!(EXTRA string=<REDACTED-NODE-NAME>)
E  Initializing watcher
E  kubernetes: Performing a resource sync for *v1.PodList
E  kubernetes: Resource sync done
E  Configured paths: [/var/lib/docker/containers/a87d8246a073c86ff515819d818bf121edc20627dfe4f449bd8e1cafb0d37014/*.log]
E  Starting runner: input [type=docker, ID=403242888682445636]
E  Starting input of type: docker; ID: 403242888682445636
E  Got a stop event: map[meta:{"kubernetes":<REDACTED-K8S-CRONJOB-POD-SPEC>}], generated configs: [0xc448974570]
E  kubernetes: Watching API for resource events
E  Config &{{<nil> } <nil> 0xc452395b00} is not running
E  Got a start event: map[start:true host:10.36.0.142 kubernetes:<REDACTED-K8S-CRONJOB-POD-SPEC> config:[0xc448ee47b0]], generated configs: [0xc448ee47b0]
E  Got a meta field in the event
E  Starting reload procedure, current runners: 61
E  Start list: 1, Stop list: 0
E  logs_path matcher log path: /var/lib/docker/containers/
E  logs_path matcher resource type: container
E  kubernetes: Using pod name filebeat-agent-g9sbz and namespace monitoring to discover kubernetes node
E  kubernetes: Using node <REDACTED-NODE-NAME> discovered by in cluster pod node query
E  Using host %!(EXTRA string=<REDACTED-NODE-NAME>)
E  Initializing watcher
E  kubernetes: Performing a resource sync for *v1.PodList
E  kubernetes: Resource sync done
E  kubernetes: Watching API for resource events
E  Configured paths: [/var/lib/docker/containers/7d00bba98976de235a49aae73cded877b261182fb7cec2397061fa36e971792e/*.log]
E  Starting runner: input [type=docker, ID=12473954919146876120]
E  Starting input of type: docker; ID: 12473954919146876120
E  Got a stop event: map[kubernetes:<REDACTED-K8S-CRONJOB-POD-SPEC> config:[0xc44cc275c0] stop:true host:10.36.0.142], generated configs: [0xc44cc275c0]
E  Starting reload procedure, current runners: 62
E  Start list: 0, Stop list: 1
E  Stopping runner: input [type=docker, ID=12473954919146876120]
E  input ticker stopped
E  Stopping Input: 12473954919146876120
...
From the current runners: %i message it's possible to see that those runners kept increasing until the agent went out of memory and was killed. This keeps happening every few hours.
In almost all of our clusters the messages are similar to this one, and most of them show in the log (in the <REDACTED-K8S-CRONJOB-POD-SPEC> above) the spec for one of our cronjobs. Which is a Kubernetes Cronjob that fires a job every 10m.
The job itself does not log that much information, most of the time only the following is logged:
{"environment":"production","project":"mail-campaigns","resource":"cronjob","commit":"32a74927b496eb06abc373e11d44ba04d7ec9641","message":"Elastic APM agent is inactive due to configuration","level":"info","@timestamp":"2019-03-09T00:00:11.528Z"}
{"environment":"production","project":"mail-campaigns","resource":"cronjob","commit":"32a74927b496eb06abc373e11d44ba04d7ec9641","message":"Running job send-campaigns","level":"info","kind":"send-campaigns","@timestamp":"2019-03-09T00:00:11.751Z"}
{"environment":"production","project":"mail-campaigns","resource":"cronjob","commit":"32a74927b496eb06abc373e11d44ba04d7ec9641","message":"Finished running job send-campaigns","level":"info","kind":"send-campaigns","@timestamp":"2019-03-09T00:00:12.254Z"}
And this can increase a few lines at max.
This is my current config: https://gist.github.com/JCMais/1ec9ebea58eca5d31eb0da9d78c7da91
I'm running filebeat from the docker image docker.elastic.co/beats/filebeat:6.5.2
There is also this other issue, which probably is also related: https://github.com/elastic/beats/issues/9078
Is there anything that can be done to help move this issue forward? cc @ruflin @jsoriano @andrewkroh @ycombinator @cwurm
 JCMais
on 9 Mar 2019
JCMais
on 9 Mar 2019
I wonder if this is related to https://github.com/elastic/beats/pull/7820 Any chance you could test 6.6 to see if it still happens there?
 ruflin
on 12 Mar 2019
ruflin
on 12 Mar 2019
Update: I just looked at #9078 and it seems some users there are already using 6.6 and still see the same issue :-(
Overall I think there are 2 variables here:
- Memory leak in Filebeat
- Memory leak in Autodiscovery
@jsoriano @odacremolbap Could one of you dig deeper into this one?
ruflin
on 12 Mar 2019
@urso @ph As you resolved some issues recently in Filebeat, could you see this somehow related?
ruflin
on 12 Mar 2019
10476 addressed an issue that could leave some configurations running forever even if the pods originating these configurations were already stopped. This could be a source of leaks, specially in dynamic clusters.
This fix is included in 6.6.1, @JCMais @guot626 could you give a try to this version?
 jsoriano
on 13 Mar 2019
jsoriano
on 13 Mar 2019
Thanks for taking some time to look into this guys, I will be able to test 6.6.1 later today or tomorrow, I will post another comment when I do.
JCMais
on 13 Mar 2019
I've just upgraded everything on our ELK stack to 6.6.2 and looks like the fillebeat agent still has a memory leak.

The logs are the same than above, at the time the pod was killed those were the last entries:
E  Starting reload procedure, current runners: 61
E  Start list: 1, Stop list: 0
E  logs_path matcher log path: /var/lib/docker/containers/
E  logs_path matcher resource type: container
E  kubernetes: Using pod name filebeat-agent-7rjhc and namespace monitoring to discover kubernetes node
E  kubernetes: Watching API error EOF
E  kubernetes: Watching API for resource events
@JCMais this could be related to this leak: https://github.com/elastic/beats/pull/11263
I have uploaded a docker image of filebeat 6.6.2 with this patch as jsoriano/filebeat:6.6.2-11263-1 in case you can give it a try.
jsoriano
on 15 Mar 2019
@jsoriano I will upgrade the agents and let you know if the leak stops
JCMais
on 15 Mar 2019
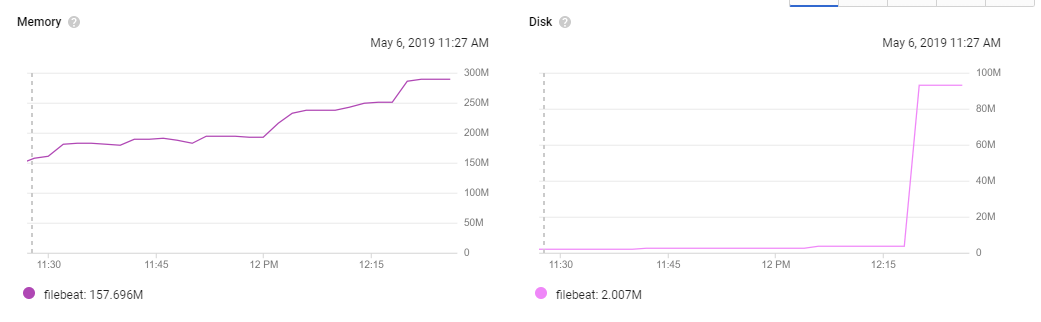
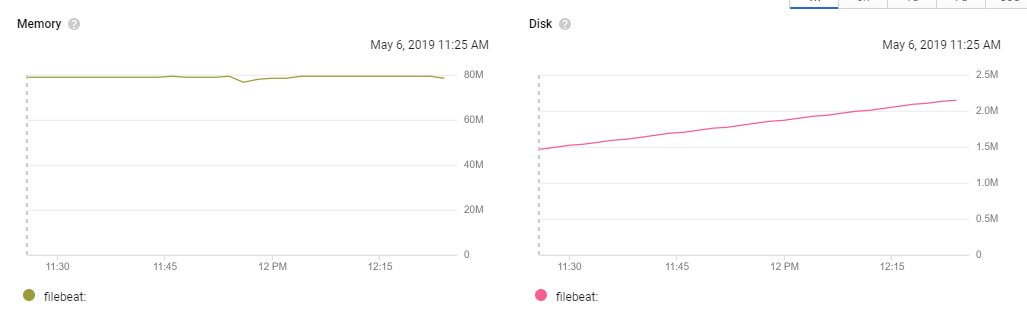
@jsoriano looks like the leak still exists. I've updated the agents on our dev cluster, which consists of two nodes, each node has one agent running.
This is the agent on the node that does not have the kubernetes cronjob that is triggered every 10m:

This is the agent on the same node than the cronjob's pods:

Latest logs on agent with memory leak:

(previous log lines are similar to those)
The one that does not shows the leak:

(previous log lines are similar to those)
If you need anything let me know, in case you want full logs you can give me an address or something else I can share them, cannot paste them here because they contain sensitive information.
They are running with debug levels enabled for autodiscover,bus,kubernetes
EDIT:
1 day later, this is the agent on the node with the pod that is created every 10m (had 3 restarts as of now):

This is the one without it:

JCMais
on 15 Mar 2019
@JCMais Do we have a many IO errors? What about open files? I have a hunch that back-pressure by the outputs (or IO errors) cause filebeat to not close the inputs yet. This might cause errors in auto-discovery trying to shutdown the inputs over and over again, accumulating another set of go-routines. Will try to simulate this behavior with autodiscovery module in separation the next days.
 urso
on 28 Mar 2019
urso
on 28 Mar 2019
@urso there are no IO errors or disk pressure.
JCMais
on 28 Mar 2019
I have similar issue with filebeat 6.6.2 with kubernetes autodiscover.
Please find attached the pprof graph for one filebeat instance in out environment.
profile001.pdf
If needed, I can do other debugging or some testing.
 olivierboudet
on 15 Apr 2019
olivierboudet
on 15 Apr 2019
@olivierboudet how you created this graph?
JCMais
on 17 Apr 2019
@JCMais I have started filebeat with arguments --httpprof :6060
Then, in the container I ran :
curl localhost:6060/debug/pprof/heap > /tmp/pprod
I retrieved the file on my laptop then ran :
go tool pprof --pdf /tmp/pprof > /tmp/pprof.pdf
I've opened https://github.com/elastic/beats/pull/12063 which may help with this issue, would any of you be willing to give it a try?
 exekias
on 5 May 2019
exekias
on 5 May 2019
@exekias sure thing, just let me know the docker image/tag
thanks for the possible fix btw!
JCMais
on 6 May 2019
I've just pushed exekias/filebeat:7.2-leak-fix, as usual, please take into account this is a development version, just a snapshot of master with my patch. So use it with caution
Thank you!
exekias
on 6 May 2019
@exekias would it be possible to have an image base on v6?
There are way too many breaking changes on v7 and I cannot afford to migrate right now.
JCMais
on 6 May 2019
:+1: just pushed exekias/filebeat:6.7-leak-fix based on 6.x branch
exekias
on 6 May 2019
@exekias It probably still has the leak, the node with the cronjob:
pprof graph: pprof-node-1.pdf
The one without it:
pprof graph: pprof-node-2.pdf
JCMais
on 6 May 2019
thanks for testing, could you also dump the goroutines? I'm trying to see if one is leaking
exekias
on 6 May 2019
sure, how I do that? Never used Go 😄
JCMais
on 6 May 2019
You can retrieve them from http://localhost:6060/debug/pprof/goroutine?debug=1 (supposing pprof was enabled on localhost:6060)
exekias
on 6 May 2019
@exekias here they are:
node with the cronjob:
pprof-node-goroutines-1.pdf
node without it:
pprof-node-goroutines-2.pdf
JCMais
on 6 May 2019
ups sorry, no need to run the pdf command, just show the raw text from the URL, you can even access it with your browser.
exekias
on 6 May 2019
here it is @exekias https://gist.github.com/JCMais/3eef607d7439fd04dcb44476516e2ac6
JCMais
on 6 May 2019
Hi @exekias, not better for me neither with the 6.7 based image.
Goroutines dump : https://gist.github.com/olivierboudet/28bdc806866a3cfd5d27a6a7ef6cdb3c
Grafana chart of memory for the pod :

olivierboudet
on 7 May 2019
Hi Folks,
I see you both are using add_kubernetes_metadata together with autodiscover. That is redundant, you should not need add_kubernetes_metadata as autodiscover populates metadata already, could you please remove it and try again?
exekias
on 7 May 2019
@exekia, yeah it is much better without add_kubernetes_metadata
olivierboudet
on 7 May 2019
@exekias can also confirm that it looks more stable, I will report back in a few hours
JCMais
on 7 May 2019
@exekias that helped immensely, this is the memory usage for the past 6 hours:
agent on the node with the cronjob that is created every 10 mins:

the other one:

The memory is still growing, but much slower. I've updated the gist above with the new goroutines dump.
JCMais
on 7 May 2019
Ok, so it seems there is still another leak, which seems to have less impact:
goroutine profile: total 2740
2389 @ 0x99388a 0x99393e 0x96a332 0x969feb 0x13462b4 0x9c1141
#   0x13462b3   github.com/elastic/beats/filebeat/channel.CloseOnSignal.func1+0x33  /home/exekias/go/src/github.com/elastic/beats/filebeat/channel/util.go:117
We will need to look into this too
exekias
on 8 May 2019
We just merged another fix that may help with that (https://github.com/elastic/beats/pull/12125), I will prepare a new image with all fixes together
exekias
on 9 May 2019
Just pushed exekias/filebeat:6.7-leak-fixes
exekias
on 9 May 2019
@exekias here are the goroutines for the past 4 hours using the image you commented:
goroutines.log
goroutine profile: total 797
558 @ 0x993a1a 0x993ace 0x96a4c2 0x96a17b 0x1346444 0x9c12d1
    0x1346443   github.com/elastic/beats/filebeat/channel.CloseOnSignal.func1+0x33  /home/exekias/go/src/github.com/elastic/beats/filebeat/channel/util.go:117

63 @ 0x993a1a 0x993ace 0x96a4c2 0x96a1bb 0x134633e 0x9c12d1
    0x134633d   github.com/elastic/beats/filebeat/channel.SubOutlet.func1+0x9d  /home/exekias/go/src/github.com/elastic/beats/filebeat/channel/util.go:53

37 @ 0x993a1a 0x9a36c0 0x1348297 0x1348c4b 0x9c12d1
    0x1348296   github.com/elastic/beats/filebeat/input.(*Runner).Run+0x166     /home/exekias/go/src/github.com/elastic/beats/filebeat/input/input.go:147
    0x1348c4a   github.com/elastic/beats/filebeat/input.(*Runner).Start.func1+0x5a  /home/exekias/go/src/github.com/elastic/beats/filebeat/input/input.go:132

37 @ 0x993a1a 0x9a36c0 0xe74711 0x9c12d1
    0xe74710    github.com/elastic/beats/libbeat/publisher/pipeline.(*gapCountACK).ackLoop+0x150    /home/exekias/go/src/github.com/elastic/beats/libbeat/publisher/pipeline/acker.go:139

26 @ 0x993a1a 0x9a36c0 0x138a68f 0x1389b61 0x137a63c 0x137a20f 0x1379bf3 0x137f58d 0x135c4fe 0x137ad0b 0x137b188 0x9c12d1
    0x138a68e   github.com/elastic/beats/filebeat/input/log.(*Log).wait+0xde                /home/exekias/go/src/github.com/elastic/beats/filebeat/input/log/log.go:168
    0x1389b60   github.com/elastic/beats/filebeat/input/log.(*Log).Read+0x120               /home/exekias/go/src/github.com/elastic/beats/filebeat/input/log/log.go:103
    0x137a63b   github.com/elastic/beats/filebeat/reader/readfile.(*LineReader).advance+0x14b       /home/exekias/go/src/github.com/elastic/beats/filebeat/reader/readfile/line.go:126
    0x137a20e   github.com/elastic/beats/filebeat/reader/readfile.(*LineReader).Next+0x2e       /home/exekias/go/src/github.com/elastic/beats/filebeat/reader/readfile/line.go:72
    0x1379bf2   github.com/elastic/beats/filebeat/reader/readfile.EncoderReader.Next+0x62       /home/exekias/go/src/github.com/elastic/beats/filebeat/reader/readfile/encode.go:48
    0x137f58c   github.com/elastic/beats/filebeat/reader/docker_json.(*Reader).Next+0x43c       /home/exekias/go/src/github.com/elastic/beats/filebeat/reader/docker_json/docker_json.go:175
    0x135c4fd   github.com/elastic/beats/filebeat/reader/json.(*JSON).Next+0x8d             /home/exekias/go/src/github.com/elastic/beats/filebeat/reader/json/json.go:97
    0x137ad0a   github.com/elastic/beats/filebeat/reader/readfile.(*StripNewline).Next+0x8a     /home/exekias/go/src/github.com/elastic/beats/filebeat/reader/readfile/strip_newline.go:37
    0x137b187   github.com/elastic/beats/filebeat/reader/readfile.(*TimeoutReader).Next.func1+0x77  /home/exekias/go/src/github.com/elastic/beats/filebeat/reader/readfile/timeout.go:70

26 @ 0x993a1a 0x9a36c0 0x138ab5b 0x9c12d1
    0x138ab5a   github.com/elastic/beats/filebeat/input/log.(*Harvester).Run.func2+0xfa /home/exekias/go/src/github.com/elastic/beats/filebeat/input/log/harvester.go:243

17 @ 0x993a1a 0x9a36c0 0x137afdd 0x137c01d 0x137bee1 0x1379d8b 0x1381221 0x135b543 0x9c12d1
    0x137afdc   github.com/elastic/beats/filebeat/reader/readfile.(*TimeoutReader).Next+0x14c   /home/exekias/go/src/github.com/elastic/beats/filebeat/reader/readfile/timeout.go:79
    0x137c01c   github.com/elastic/beats/filebeat/reader/multiline.(*Reader).readFirst+0x9c /home/exekias/go/src/github.com/elastic/beats/filebeat/reader/multiline/multiline.go:139
    0x137bee0   github.com/elastic/beats/filebeat/reader/multiline.(*Reader).Next+0x80      /home/exekias/go/src/github.com/elastic/beats/filebeat/reader/multiline/multiline.go:134
    0x1379d8a   github.com/elastic/beats/filebeat/reader/readfile.(*LimitReader).Next+0x8a  /home/exekias/go/src/github.com/elastic/beats/filebeat/reader/readfile/limit.go:38
    0x1381220   github.com/elastic/beats/filebeat/input/log.(*Harvester).Run+0x330      /home/exekias/go/src/github.com/elastic/beats/filebeat/input/log/harvester.go:264
    0x135b542   github.com/elastic/beats/filebeat/harvester.(*Registry).Start.func1+0x72    /home/exekias/go/src/github.com/elastic/beats/filebeat/harvester/registry.go:96

8 @ 0x993a1a 0x9a36c0 0x137afdd 0x137c3cd 0x137bee1 0x1379d8b 0x1381221 0x135b543 0x9c12d1
    0x137afdc   github.com/elastic/beats/filebeat/reader/readfile.(*TimeoutReader).Next+0x14c   /home/exekias/go/src/github.com/elastic/beats/filebeat/reader/readfile/timeout.go:79
    0x137c3cc   github.com/elastic/beats/filebeat/reader/multiline.(*Reader).readNext+0x9c  /home/exekias/go/src/github.com/elastic/beats/filebeat/reader/multiline/multiline.go:166
    0x137bee0   github.com/elastic/beats/filebeat/reader/multiline.(*Reader).Next+0x80      /home/exekias/go/src/github.com/elastic/beats/filebeat/reader/multiline/multiline.go:134
    0x1379d8a   github.com/elastic/beats/filebeat/reader/readfile.(*LimitReader).Next+0x8a  /home/exekias/go/src/github.com/elastic/beats/filebeat/reader/readfile/limit.go:38
    0x1381220   github.com/elastic/beats/filebeat/input/log.(*Harvester).Run+0x330      /home/exekias/go/src/github.com/elastic/beats/filebeat/input/log/harvester.go:264
    0x135b542   github.com/elastic/beats/filebeat/harvester.(*Registry).Start.func1+0x72    /home/exekias/go/src/github.com/elastic/beats/filebeat/harvester/registry.go:96
Memory is still growing, slowly, but growing, I don't know if still leaking or if that is going to be garbage collected later on.

JCMais
on 9 May 2019
I see you both are using
add_kubernetes_metadatatogether with autodiscover. That is redundant, you should not needadd_kubernetes_metadataas autodiscover populates metadata already, could you please remove it and try again?
@exekias But how do I override the config defaults on add_kubernetes_metada?
 cypherfox
on 10 May 2019
cypherfox
on 10 May 2019
@cypherfox, kubernetes autodiscover provider accepts the same parameters as add_kubernetes_metadata
exekias
on 27 May 2019
Hi @exekias your patch seems to work for us too.
For a week the filebeat pods in our production cluster kept using more and more memory and then stopped shipping logs (without crashing despite the memory limit setting). With your patch we haven't restarted the pod since yesterday evening.
 Farzy
on 29 May 2019
Farzy
on 29 May 2019
Thank you everyone for your feedback, we are closing this issue as it seems most of the problems are now solved. All fixes were backported down to 6.8, and will be released with the next minor/patch version for anything above that one.
exekias
on 3 Jun 2019
Thanks @exekias, also, please do not remove your image in the meantime (exekias/filebeat:6.7-leak-fixes) 😄
JCMais
on 3 Jun 2019
the fix already made it to an official release, so anyone using my image should move to 6.8.1 or later. I plan to delete it at some point in a few weeks
exekias
on 3 Jul 2019
I'm still seeing the same on 6.8.6, fyi.
 trondhindenes
on 22 Jan 2020
trondhindenes
on 22 Jan 2020
Hi Folks,
I see you both are using
add_kubernetes_metadatatogether with autodiscover. That is redundant, you should not needadd_kubernetes_metadataas autodiscover populates metadata already, could you please remove it and try again?
@exekias the example config file (https://github.com/elastic/examples/blob/master/MonitoringKubernetes/filebeat-kubernetes.yaml) also has the same. Probably a good idea to get that fixed.
trondhindenes
on 28 Feb 2020
Related issues
 ptrlv
·
3Comments
ptrlv
·
3Comments
 marian-craciunescu
·
3Comments
marian-craciunescu
·
3Comments
 ycombinator
·
3Comments
ycombinator
·
3Comments
 MorrieAtElastic
·
3Comments
MorrieAtElastic
·
3Comments
 kemra102
·
3Comments
kemra102
·
3Comments
Most helpful comment
Thank you everyone for your feedback, we are closing this issue as it seems most of the problems are now solved. All fixes were backported down to 6.8, and will be released with the next minor/patch version for anything above that one.