Beats: Metricbeat dashboard top CPU does not account for cores
In the Metricbeat dashboards, the CPU usage is for a single core. This leads to CPU usages > 100% in the top hosts by CPU visualization.
I fixed this by adding a Math section and dividing by the system.cpu.cores value.
- Version: 6.3.2
 mbrancato
All 8 comments
There is also an entry system.cpu.total.norm.pct which contains the normalised percentage value and already did the calculation for you.
It's an ongoing discussion which one should be shown by default. Could you share some background why you prefer one over the other?
 ruflin
on 3 Sep 2018
ruflin
on 3 Sep 2018
@ruflin I tried the system.cpu.total.norm.pct and all the graph showed was 0%, but the bar graph were not ordered and were different lengths.
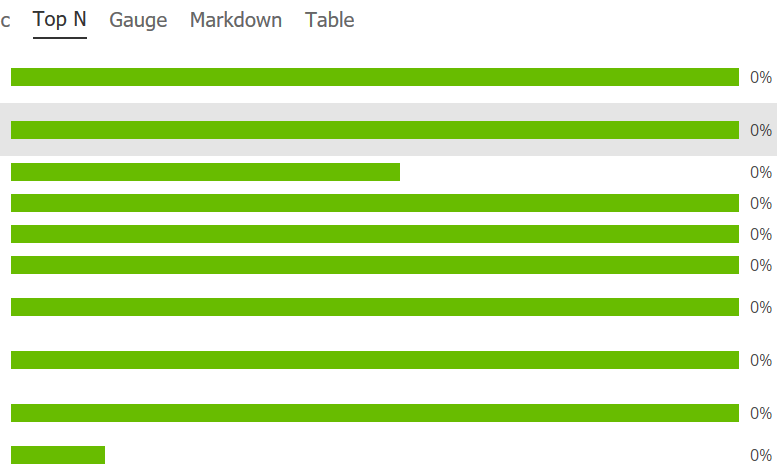
I'm leaving our math section in place. To answer your question, showing overall CPU is a better display for this graph which attempts to show hosts using the most CPU. I think it better serves the dashboard to show the overall CPU usage, not just the first core. If you want to not average, what I would do is find a different way to visualize all the cores, not a bar graph. Something that shows max, min, and mean/median core usage... I sound like I'm describing a box plot, but I don't mean to suggest that.
mbrancato
on 19 Sep 2018
@ruflin system.cpu.total.norm.pct is definitely a better default choice... With a wide range of servers ranging from 1 to 32 cpu's, it's defintely more useful then having cpu values going 800+ % while others are below 50. This gives very weird results, which are very hard to understand for some users.
 willemdh
on 19 Sep 2018
willemdh
on 19 Sep 2018
@willemdh except with 6.3.2 it seems system.cpu.total.norm.pct is always showing 0%. But yes, showing overall CPU is much more useful than summing all the CPU core percentages.
mbrancato
on 20 Sep 2018
Agreed on showing normalized by default.
When I'm viewing information directly on a single system I want the real 'non-normalized' information since it is a higher resolution / more meaningful data point. But when I am comparing multiple servers of a single service type that may have different physical core or vcpu assignments (i.e. a set of web servers on physical hardware of slightly different generations so maybe 8 and 12 cores) I want to be able to quickly see which machines are overtaxed and need upgrading.
Looks like the default changes I'd want to see would be:
in system.yml= cpu.metrics: [percentages, normalized_percentages]
in top hosts by cpu (realtime) [metricbeat system] = switch to system.cpu.user.norm.pct
in hosts histogram by cpu usage [metricbeat system] = switch to system.cpu.user.norm.pct
 DPattee
on 24 Nov 2018
DPattee
on 24 Nov 2018
Great suggestions, thank you! I will keep this issue open for these potential changes.
Looks like the default changes I'd want to see would be:
in system.yml= cpu.metrics: [percentages, normalized_percentages]
in top hosts by cpu (realtime) [metricbeat system] = switch to system.cpu.user.norm.pct
in hosts histogram by cpu usage [metricbeat system] = switch to system.cpu.user.norm.pct
 kaiyan-sheng
on 3 Jan 2020
kaiyan-sheng
on 3 Jan 2020
This issue has been automatically marked as stale because it has not had recent activity. It will be closed if no further activity occurs. Thank you for your contributions.
![botelastic[bot] picture](https://avatars0.githubusercontent.com/u/6764390?v=4&s=40) botelastic[bot]
on 3 Dec 2020
botelastic[bot]
on 3 Dec 2020
After seeing the "Top Hosts by CPU" visualization hit over 1100% during testing yesterday I'd like to see this visualization fixed as well. I had to go into the server and look at how many cores it had, 32, and start doing some mental math. I don't really see how showing a customer 1100% makes this visualization useful and only puts more work on my plate.
 FreerideTheWorld
on 23 Dec 2020
FreerideTheWorld
on 23 Dec 2020
Related issues
 pigletfly
·
3Comments
pigletfly
·
3Comments
 JalehD
·
3Comments
JalehD
·
3Comments
 MorrieAtElastic
·
3Comments
MorrieAtElastic
·
3Comments
 geekpete
·
3Comments
geekpete
·
3Comments
 TomaszKlosinski
·
3Comments
TomaszKlosinski
·
3Comments
Most helpful comment
@ruflin system.cpu.total.norm.pct is definitely a better default choice... With a wide range of servers ranging from 1 to 32 cpu's, it's defintely more useful then having cpu values going 800+ % while others are below 50. This gives very weird results, which are very hard to understand for some users.