Beaker: CPU usage of Beaker is very high
Operation System: MacOS 10.13.4
Beaker version: Beaker v0.8.0-prerelease.6
Computer: MacBook Pro (Retina, 15-inch)
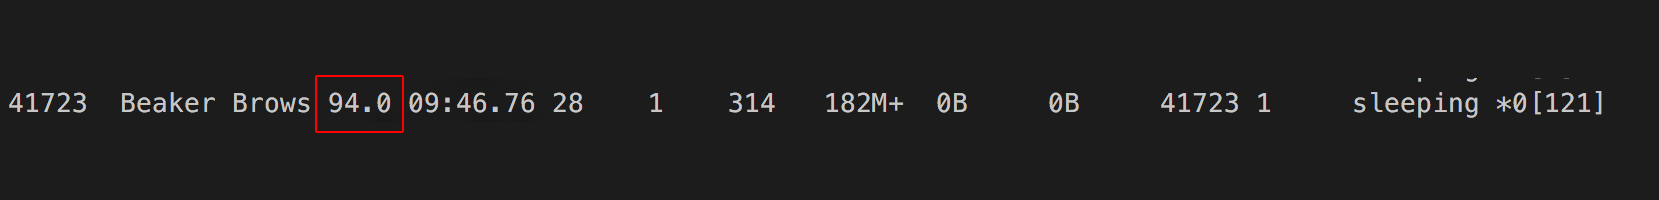
CPU usage is peaking into the 90%+, even when Beaker is in the background and not being used.
This is what top shows:
 harmvandendorpel
All 7 comments
Can you give some info about what leads up to this? Such as:
- Did it start after the device slept while Beaker was open?
- Do you have any large dats?
- Are you syncing any large folders to a dat (your "local sync" folder)?
 pfrazee
on 6 Jun 2018
pfrazee
on 6 Jun 2018
(Also: sorry for the problem and thanks for reporting!)
pfrazee
on 6 Jun 2018
_Did it start after the device slept while Beaker was open?_
No, it was like that from the moment I started Beaker._Do you have any large dats?_
I share one dat file, namely dat://harmvandendorpel.com/_Are you syncing any large folders to a dat (your "local sync" folder)?_
As far as I understand correctly, dat://harmvandendorpel.com/ is the only dat I'm syncing.
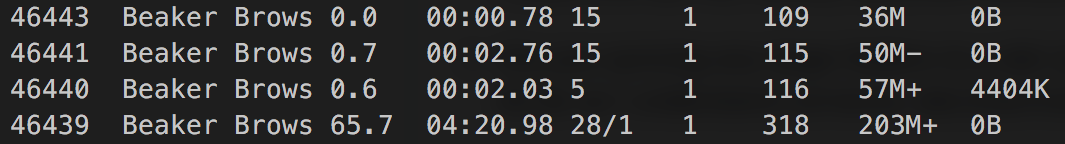
There is only one tab open.
top looks like this, CPU percentage of process 46439 jumping around from 10% - 90%.
harmvandendorpel
on 6 Jun 2018
I'm fairly certain the cause is that your archive has a lot of history-data. The next version of Dat has performance improvements that should help with this sort of thing, but for now I suggest you create a new archive with the same content and replace it.
pfrazee
on 6 Jun 2018
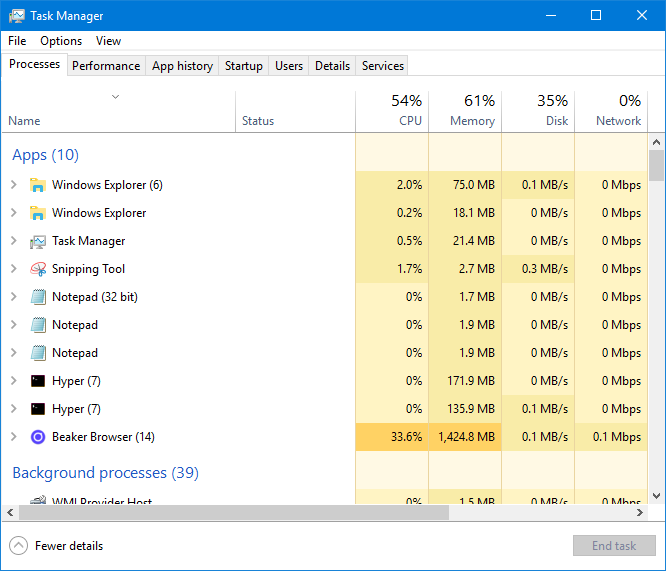
Same on windows
 ghost
on 16 Jul 2018
ghost
on 16 Jul 2018
@jraspiprojects that looks very much like a memory leak, or some kind of runaway memory usage. There was a fix in the latest build which fixed runaway memory usage when accessing historic versions of archives, which Fritter happened to do a lot. It might be something like that.
If you're able to reproduce it and can run a custom build, electron supports attaching chrome's remote debugger and it'd be really useful if you could isolate where that memory is getting used.
pfrazee
on 16 Jul 2018
(The memory leak can lead to heavy CPU usage due to frequent GCs)
pfrazee
on 16 Jul 2018
Related issues
 msfeldstein
·
3Comments
msfeldstein
·
3Comments
 flpvsk
·
4Comments
flpvsk
·
4Comments
 dasanchez
·
3Comments
dasanchez
·
3Comments
 aaronshaf
·
4Comments
aaronshaf
·
4Comments
 LWFlouisa
·
4Comments
LWFlouisa
·
4Comments
Most helpful comment
Can you give some info about what leads up to this? Such as: