Low priority enhancement...
For 4.7+ kernels, biosnoop & biotop should use the block: tracepoints. Probably block:block_rq_issue and block:block_rq_complete. It might make sense to bump the type of I/O field ("T" and "D") from 2 characters to 4, and then just print the tracepoint's rwbs field in that.
Older versions of biosnoop/biotop should be put in tools/old for 4.6 and earlier kernels.
 brendangregg
All 31 comments
s/It might make sense to/I'm pretty sure we should/
brendangregg
on 30 Mar 2017
I wouldn't mind tackling this, just wanted to make sure we're on the same page. Currently, there are four kernel functions that these tools attach to:
blk_account_io_start-- to associate thestruct reqwith a pid/commblk_start_requestandblk_mq_start_requestto trace the request startblk_account_io_completionto trace the request end
Instead, we'd just attach to the block:block_rq_issue and block:block_rq_complete tracepoints. These have the dev_t rather than the disk name -- how would we translate back to the disk name?
 goldshtn
on 1 Apr 2017
goldshtn
on 1 Apr 2017
I guess we could do MAJOR(args->dev) and MINOR(args->dev) and then grab these values and look in /proc/partitions. Feels a bit like a hack, but would probably work (from limited testing). Is that the way you'd want to go? @brendangregg
goldshtn
on 2 Apr 2017
Thanks @goldshtn , please take a swing at it if it interests you. We need at least three tracepoints. Here's what I think they would be and what I think they do:
- block:block_rq_insert - bio added to kernel queue
- block:block_rq_issue - bio issued to device
- block:block_rq_complete - bio completed on device
So biolatency would do issue->complete by default, and insert->complete for -Q.
biosnoop only does device latency right now, but it would be good to have a -Q option. Here's a mockup where I'm adding it as an extra column:
# ./biosnoop -Q
TIME(s)        COMM           PID    DISK    T  SECTOR    BYTES  QLAT(ms)  LAT(ms)
0.000004001    supervise      1950   xvda1   W  13092560  4096       0.01     0.74
0.000178002    supervise      1950   xvda1   W  13092432  4096       1.03     0.61
0.001469001    supervise      1956   xvda1   W  13092440  4096       0.63     1.24
0.001588002    supervise      1956   xvda1   W  13115128  4096       0.01     1.09
It's over 80 char width, but OTOH, we're not breaking the default output -- you need a -Q to do this.
I think the /proc/partitions cache and using major/minor from the tracepoints is probably the best option. I'm sure I could dig it out of the dev_t, but that would be unstable, and /proc/partitions & major/minor numbers are stable. Plus we're using tracepoints, which are also stable, so wouldn't it be nice if these scripts were "done" and don't break in the future. :)
brendangregg
on 2 Apr 2017
Come to think of it, how do we correlate the issue and complete events, or the insert and complete events? The current tools do this using struct request, but the tracepoints don't have a struct request. @brendangregg
goldshtn
on 2 Apr 2017
Ah, right, it can be associated using an ID from: device (dev_t pointer) + sector. I don't know how important it is, but one could include size and rwbs field as well.
brendangregg
on 2 Apr 2017
Couldn't we theoretically have multiple requests in flight with these parameters being the same? I'm just saying that we would lose consistency compared to tracing struct request.
goldshtn
on 2 Apr 2017
Maybe. But:
A) That's how my old iosnoop has worked forever (shipped with OSX, Oracle Solaris, etc), and for the same reasons: using what was available in the static probe.
B) We could (now or later) write a script to check if two I/O can be in-flight for the same block address. Especially if someone says: this iosnoop output doesn't make sense. In fact, easiest might be an awk script to process the output of:
perf record -e block:block_rq_issue -e block:block_rq_complete -a -- sleep 60; perf script
Which will have the timestamps, major/minor numbers, and block addresses in the output.
brendangregg
on 2 Apr 2017
OK, so I sort of ported biosnoop but I'm seeing an issue. The sector number in block_rq_insert doesn't match up with the sector number in block_rq_issue. Example trace output while I am hitting :w in vim:
# /usr/share/bcc/tools/trace 't:block:block_rq_insert "insert dev=%d sec=%d", args->dev, args->sector' 't:block:block_rq_issue "issue dev=%d sec=%d", args->dev, args->sector'
PID    TID    COMM         FUNC             -
29746  29746  kworker/0:2  block_rq_insert  insert dev=0 sec=0
29746  29746  kworker/0:2  block_rq_issue   issue dev=0 sec=0
29746  29746  kworker/0:2  block_rq_insert  insert dev=0 sec=0
29746  29746  kworker/0:2  block_rq_issue   issue dev=0 sec=0
14139  14139  vim          block_rq_insert  insert dev=8388608 sec=9163536
14139  14139  vim          block_rq_insert  insert dev=8388608 sec=0
14139  14139  vim          block_rq_issue   issue dev=8388608 sec=9163536
14139  14139  vim          block_rq_issue   issue dev=8388608 sec=-1
29746  29746  kworker/0:2  block_rq_insert  insert dev=8388608 sec=22417744
29746  29746  kworker/0:2  block_rq_issue   issue dev=8388608 sec=22417744
Note vim's lines: where there is a sector, it matches up OK in both probes, but where there isn't a sector, we get 0 in the insert and -1 in the issue. Thoughts? @brendangregg
goldshtn
on 3 Apr 2017
Now that I'm tracing the rwbs field, it also changes: from FW in the insert, to FF in the issue.
goldshtn
on 3 Apr 2017
This is the current code if you'd like to take a look: https://github.com/goldshtn/bcc/tree/bio-tracepoints
goldshtn
on 3 Apr 2017
just a FYI the new version the pid is not showing correctly compared to biosnoop. I'm running 4.8.0-45-generic, the trace command above does show the correct pid.
from trace:
46525 46525 dd block_rq_insert insert dev=8388608 sec=15125744
from ps
root 46525 6638 4 16:40 pts/2 00:00:00 dd if=/dev/zero of=/var/tmp/a bs=8192 count=2000 oflag=direct
from biosnoop
0.782716000 dd 51380 sda W 15124704 8192 0.23
from ps:
root 51380 6476 2 16:43 pts/1 00:00:00 dd if=/dev/zero of=/var/tmp/a bs=8192 count=2000 oflag=direct
new version looks to be picking up the kworker thread.
from ps:
root 52926 6638 3 16:44 pts/2 00:00:00 dd if=/dev/zero of=/var/tmp/a bs=8192 count=2000 oflag=direct
from biosnoop_new:
19.941982529 kworker/1:1H 558 sda WS 15156464 8192 0.000
 mcaleavya
on 3 Apr 2017
mcaleavya
on 3 Apr 2017
doh!! running dd without oflag=direct shows the dd process as the pid issuing the I/O. That would seem correct as its writing to the page cache. perf record shows the same as the new version.
mcaleavya
on 3 Apr 2017
@brendangregg Ping -- I'd like to move this forward, but I'm stuck with the issue above, where the block_rq_issue and block_rq_insert parameters do not match up. Any thoughts?
goldshtn
on 12 Apr 2017
I'll have to look at stack traces for those 0 sector requests; it could be a special non-I/O request, and we can special case it (ie, know that the return will be -1).
brendangregg
on 13 Apr 2017
@brendangregg Here are the stacks -- captured while saving a file in vim:
# trace -K -p $(pidof vim) \
  't:block:block_rq_insert "insert sec=%d typ=%s", args->sector, args->rwbs' \
  't:block:block_rq_issue  "issue  sec=%d typ=%s", args->sector, args->rwbs'
PID    TID    COMM         FUNC             -
7686   7686   vim          block_rq_insert  insert sec=30862128 typ=WS
        __elv_add_request+0xbe [kernel]
        blk_queue_bio+0x3fa [kernel]
        generic_make_request+0xf2 [kernel]
        submit_bio+0x73 [kernel]
        xfs_submit_ioend+0x66 [kernel]
        xfs_vm_writepages+0xbe [kernel]
        do_writepages+0x1e [kernel]
        __filemap_fdatawrite_range+0xc6 [kernel]
        filemap_write_and_wait_range+0x41 [kernel]
        xfs_file_fsync+0x63 [kernel]
        vfs_fsync_range+0x49 [kernel]
        do_fsync+0x3d [kernel]
        sys_fsync+0x10 [kernel]
        do_syscall_64+0x67 [kernel]
        return_from_SYSCALL_64+0x0 [kernel]

7686   7686   vim          block_rq_insert  insert sec=0 typ=FW
        __elv_add_request+0xbe [kernel]
        blk_flush_plug_list+0x207 [kernel]
        blk_finish_plug+0x2c [kernel]
        _xfs_buf_ioapply+0x336 [kernel]
        xfs_buf_submit+0x69 [kernel]
        xlog_bdstrat+0x2b [kernel]
        xlog_sync+0x2bb [kernel]
        xlog_state_release_iclog+0x6d [kernel]
        _xfs_log_force_lsn+0x20d [kernel]
        xfs_file_fsync+0xe6 [kernel]
        vfs_fsync_range+0x49 [kernel]
        do_fsync+0x3d [kernel]
        sys_fsync+0x10 [kernel]
        do_syscall_64+0x67 [kernel]
        return_from_SYSCALL_64+0x0 [kernel]

7686   7686   vim          block_rq_issue   issue sec=30862128 typ=WS
        blk_peek_request+0x1fc [kernel]
        scsi_request_fn+0x3f [kernel]
        __blk_run_queue+0x33 [kernel]
        cfq_insert_request+0x2d7 [kernel]
        __elv_add_request+0x1bc [kernel]
        blk_queue_bio+0x3fa [kernel]
        generic_make_request+0xf2 [kernel]
        submit_bio+0x73 [kernel]
        xfs_submit_ioend+0x66 [kernel]
        xfs_vm_writepages+0xbe [kernel]
        do_writepages+0x1e [kernel]
        __filemap_fdatawrite_range+0xc6 [kernel]
        filemap_write_and_wait_range+0x41 [kernel]
        xfs_file_fsync+0x63 [kernel]
        vfs_fsync_range+0x49 [kernel]
        do_fsync+0x3d [kernel]
        sys_fsync+0x10 [kernel]
        do_syscall_64+0x67 [kernel]
        return_from_SYSCALL_64+0x0 [kernel]

7686   7686   vim          block_rq_issue   issue sec=-1 typ=FF
        blk_peek_request+0x1fc [kernel]
        scsi_request_fn+0x3f [kernel]
        __blk_run_queue+0x33 [kernel]
        queue_unplugged+0x2a [kernel]
        blk_flush_plug_list+0x22d [kernel]
        blk_finish_plug+0x2c [kernel]
        _xfs_buf_ioapply+0x336 [kernel]
        xfs_buf_submit+0x69 [kernel]
        xlog_bdstrat+0x2b [kernel]
        xlog_sync+0x2bb [kernel]
        xlog_state_release_iclog+0x6d [kernel]
        _xfs_log_force_lsn+0x20d [kernel]
        xfs_file_fsync+0xe6 [kernel]
        vfs_fsync_range+0x49 [kernel]
        do_fsync+0x3d [kernel]
        sys_fsync+0x10 [kernel]
        do_syscall_64+0x67 [kernel]
        return_from_SYSCALL_64+0x0 [kernel]
^C
Note the mismatched sector (0 and -1) and the mismatched type (FW and FF).
goldshtn
on 13 Apr 2017
doing a few writes to a file on my system and I cant replicate this data below. 4.8.0-45-generic #48-Ubuntu
PID TID COMM FUNC -
20587 20587 vim block_rq_insert insert sec=24318352 typ=WS
__elv_add_request+0xc5 [kernel]
blk_flush_plug_list+0x238 [kernel]
blk_finish_plug+0x2c [kernel]
ext4_writepages+0x537 [kernel]
do_writepages+0x1e [kernel]
__filemap_fdatawrite_range+0xc6 [kernel]
filemap_write_and_wait_range+0x41 [kernel]
ext4_sync_file+0xe8 [kernel]
vfs_fsync_range+0x4b [kernel]
do_fsync+0x3d [kernel]
sys_fsync+0x10 [kernel]
entry_SYSCALL_64_fastpath+0x1e [kernel]
20587 20587 vim block_rq_issue issue sec=24318352 typ=WS
blk_peek_request+0x1ee [kernel]
scsi_request_fn+0x3e [kernel]
__blk_run_queue+0x33 [kernel]
queue_unplugged+0x2a [kernel]
blk_flush_plug_list+0x1ff [kernel]
blk_finish_plug+0x2c [kernel]
ext4_writepages+0x537 [kernel]
do_writepages+0x1e [kernel]
__filemap_fdatawrite_range+0xc6 [kernel]
filemap_write_and_wait_range+0x41 [kernel]
ext4_sync_file+0xe8 [kernel]
vfs_fsync_range+0x4b [kernel]
do_fsync+0x3d [kernel]
sys_fsync+0x10 [kernel]
entry_SYSCALL_64_fastpath+0x1e [kernel]
20587 20587 vim block_rq_insert insert sec=24317224 typ=WS
__elv_add_request+0xc5 [kernel]
blk_flush_plug_list+0x238 [kernel]
blk_finish_plug+0x2c [kernel]
ext4_writepages+0x537 [kernel]
do_writepages+0x1e [kernel]
__filemap_fdatawrite_range+0xc6 [kernel]
filemap_write_and_wait_range+0x41 [kernel]
ext4_sync_file+0xe8 [kernel]
vfs_fsync_range+0x4b [kernel]
do_fsync+0x3d [kernel]
sys_fsync+0x10 [kernel]
entry_SYSCALL_64_fastpath+0x1e [kernel]
20587 20587 vim block_rq_issue issue sec=24317224 typ=WS
blk_peek_request+0x1ee [kernel]
scsi_request_fn+0x3e [kernel]
__blk_run_queue+0x33 [kernel]
queue_unplugged+0x2a [kernel]
blk_flush_plug_list+0x1ff [kernel]
blk_finish_plug+0x2c [kernel]
ext4_writepages+0x537 [kernel]
do_writepages+0x1e [kernel]
__filemap_fdatawrite_range+0xc6 [kernel]
filemap_write_and_wait_range+0x41 [kernel]
ext4_sync_file+0xe8 [kernel]
vfs_fsync_range+0x4b [kernel]
do_fsync+0x3d [kernel]
sys_fsync+0x10 [kernel]
entry_SYSCALL_64_fastpath+0x1e [kernel]
20587 20587 vim block_rq_insert insert sec=24318360 typ=WS
__elv_add_request+0xc5 [kernel]
blk_flush_plug_list+0x238 [kernel]
blk_finish_plug+0x2c [kernel]
ext4_writepages+0x537 [kernel]
do_writepages+0x1e [kernel]
__filemap_fdatawrite_range+0xc6 [kernel]
filemap_write_and_wait_range+0x41 [kernel]
ext4_sync_file+0xe8 [kernel]
vfs_fsync_range+0x4b [kernel]
do_fsync+0x3d [kernel]
sys_fsync+0x10 [kernel]
entry_SYSCALL_64_fastpath+0x1e [kernel]
20587 20587 vim block_rq_issue issue sec=24318360 typ=WS
blk_peek_request+0x1ee [kernel]
scsi_request_fn+0x3e [kernel]
__blk_run_queue+0x33 [kernel]
queue_unplugged+0x2a [kernel]
blk_flush_plug_list+0x1ff [kernel]
blk_finish_plug+0x2c [kernel]
ext4_writepages+0x537 [kernel]
do_writepages+0x1e [kernel]
__filemap_fdatawrite_range+0xc6 [kernel]
filemap_write_and_wait_range+0x41 [kernel]
ext4_sync_file+0xe8 [kernel]
vfs_fsync_range+0x4b [kernel]
do_fsync+0x3d [kernel]
sys_fsync+0x10 [kernel]
entry_SYSCALL_64_fastpath+0x1e [kernel]
I am using ext4 however so not sure if this is possibly a writeback cache issue.
blktrace.c has the F defined as
if (tc & BLK_TC_FLUSH)
rwbs[i++] = 'F';
&
if (tc & BLK_TC_FUA)
rwbs[i++] = 'F';
mcaleavya
on 13 Apr 2017
@brendangregg Any thoughts considering these stacks?
goldshtn
on 18 Apr 2017
I haven't had a chance to dig much yet (I'm spending more time with cgroups/namespaces for DockerCon). So a flush + write (FW) is becoming a flush + force unit access (FF). I've looked at some kernel code paths that set a REQ_FUA...
The answer may still be in the stacks. It's starting with xlog_sync(), and then diverges with blk_flush_plug_list(). It's doing the __elv_add_request() for the FW, then the queue_unplugged() for the FF. Is it modifying the FW to become a FF, or is the FW discarded and a new rq created for FF? I haven't been able to answer that yet.
Here's a function graph:
> /apps/perf-tools/bin/funcgraph xlog_sync
Tracing "xlog_sync"... Ctrl-C to end.
7) | xlog_sync [xfs]() {
7) 0.191 us | xlog_grant_add_space.isra.6 [xfs]();
7) 0.078 us | xlog_grant_add_space.isra.6 [xfs]();
7) 0.251 us | xlog_pack_data.isra.7 [xfs]();
7) | xlog_cksum [xfs]() {
7) | crypto_shash_update() {
7) 0.147 us | crc32c_pcl_intel_update();
7) 1.018 us | }
7) | crypto_shash_update() {
7) 0.124 us | crc32c_pcl_intel_update();
7) 0.681 us | }
7) | crypto_shash_update() {
7) 0.192 us | crc32c_pcl_intel_update();
7) 0.675 us | }
7) | crypto_shash_update() {
7) | crc32c_pcl_intel_update() {
7) 0.144 us | irq_fpu_usable();
7) | kernel_fpu_begin() {
7) | __kernel_fpu_begin() {
7) 0.131 us | irq_fpu_usable();
7) | kernel_fpu_disable() {
7) | xen_evtchn_do_upcall() {
7) | irq_enter() {
7) 0.132 us | rcu_irq_enter();
7) 0.638 us | }
7) 0.081 us | exit_idle();
7) | __xen_evtchn_do_upcall() {
7) | evtchn_2l_handle_events() {
7) 0.068 us | irq_from_virq();
7) | evtchn_from_irq() {
7) | irq_get_irq_data() {
7) 0.148 us | irq_to_desc();
7) 0.677 us | }
7) 1.406 us | }
7) | get_evtchn_to_irq() {
7) 0.075 us | evtchn_2l_max_channels();
7) 0.661 us | }
7) | generic_handle_irq() {
7) | handle_percpu_irq() {
7) | ack_dynirq() {
7) | evtchn_from_irq() {
7) | irq_get_irq_data() {
7) 0.136 us | irq_to_desc();
7) 0.642 us | }
7) 1.143 us | }
7) 0.074 us | evtchn_2l_clear_pending();
7) 2.440 us | }
7) | handle_irq_event_percpu() {
7) | __handle_irq_event_percpu() {
7) | xen_irq_work_interrupt() {
7) | irq_enter() {
7) 0.063 us | rcu_irq_enter();
7) 0.596 us | }
7) | __wake_up() {
7) 0.071 us | _raw_spin_lock_irqsave();
7) 0.073 us | __wake_up_common();
7) 0.076 us | _raw_spin_unlock_irqrestore();
7) 2.362 us | }
7) | irq_exit() {
7) 0.070 us | idle_cpu();
7) 0.159 us | rcu_irq_exit();
7) 1.291 us | }
7) 6.046 us | }
7) 6.600 us | }
7) 0.098 us | add_interrupt_randomness();
7) 0.158 us | note_interrupt();
7) 8.436 us | }
7) + 12.434 us | }
7) + 12.965 us | }
7) + 17.388 us | }
7) + 17.951 us | }
7) | irq_exit() {
7) 0.070 us | idle_cpu();
7) 0.065 us | rcu_irq_exit();
7) 1.069 us | }
7) + 21.612 us | } /* xen_evtchn_do_upcall */
7) 0.068 us | xen_maybe_preempt_hcall();
7) 0.115 us | } /* kernel_fpu_disable */
7) + 25.827 us | }
7) + 26.409 us | }
7) | kernel_fpu_end() {
7) | __kernel_fpu_end() {
7) 0.082 us | kernel_fpu_enable();
7) 0.760 us | }
7) 1.345 us | }
7) + 31.701 us | }
7) + 32.188 us | }
7) + 38.122 us | }
7) | xlog_bdstrat [xfs]() {
7) | xfs_buf_lock [xfs]() {
7) | down() {
7) 0.159 us | _raw_spin_lock_irqsave();
7) 0.075 us | _raw_spin_unlock_irqrestore();
7) 1.197 us | }
7) 1.775 us | }
7) | xfs_buf_submit [xfs]() {
7) 0.086 us | xfs_buf_wait_unpin [xfs]();
7) 0.073 us | xfs_buf_hold [xfs]();
7) | _xfs_buf_ioapply [xfs]() {
7) 0.093 us | blk_start_plug();
7) | bio_alloc_bioset() {
7) | mempool_alloc() {
7) 0.084 us | _cond_resched();
7) | mempool_alloc_slab() {
7) | kmem_cache_alloc() {
7) 0.137 us | memcg_kmem_put_cache();
7) 0.820 us | }
7) 1.337 us | }
7) 2.413 us | }
7) | bvec_alloc() {
7) | kmem_cache_alloc() {
7) | __slab_alloc() {
7) 0.217 us | ___slab_alloc();
7) 0.797 us | }
7) 0.071 us | memcg_kmem_put_cache();
7) 1.834 us | }
7) 2.405 us | }
7) 6.375 us | }
7) 0.096 us | bio_add_page();
7) 0.091 us | bio_add_page();
7) | submit_bio() {
7) | generic_make_request() {
7) | generic_make_request_checks() {
7) 0.067 us | _cond_resched();
7) | create_task_io_context() {
7) | kmem_cache_alloc_node() {
7) 0.083 us | memcg_kmem_put_cache();
7) 1.545 us | }
7) 0.060 us | _raw_spin_lock();
7) 2.764 us | }
7) 0.502 us | blkg_lookup_slowpath();
7) 0.327 us | blk_throtl_bio();
7) 6.686 us | }
7) 0.204 us | blk_queue_enter();
7) | md_make_request() {
7) 0.349 us | blk_queue_split();
7) | raid0_make_request [raid0]() {
7) | md_flush_request() {
7) 0.159 us | _raw_spin_lock_irq();
7) | queue_work_on() {
7) | __queue_work() {
7) 0.080 us | get_work_pool();
7) 0.078 us | _raw_spin_lock();
7) | insert_work() {
7) 0.075 us | get_pwq.isra.21();
7) | wake_up_process() {
7) | try_to_wake_up() {
7) 0.086 us | _raw_spin_lock_irqsave();
7) 0.073 us | _raw_spin_lock();
7) | ttwu_do_activate() {
7) | activate_task() {
7) 0.246 us | update_rq_clock.part.81();
7) | enqueue_task_fair() {
7) | enqueue_entity() {
7) | update_curr() {
7) 0.141 us | __calc_delta();
7) 0.067 us | update_min_vruntime();
7) 1.251 us | }
7) 0.094 us | account_entity_enqueue();
7) 0.123 us | update_cfs_shares();
7) 0.073 us | place_entity();
7) 0.210 us | __enqueue_entity();
7) 4.578 us | }
7) 0.063 us | hrtick_update();
7) 5.779 us | }
7) 7.432 us | }
7) | wq_worker_waking_up() {
7) 0.063 us | kthread_data();
7) 0.577 us | }
7) | ttwu_do_wakeup() {
7) | check_preempt_curr() {
7) | check_preempt_wakeup() {
7) 0.085 us | update_curr();
7) 0.076 us | wakeup_preempt_entity.isra.61();
7) 1.285 us | }
7) 2.062 us | }
7) 2.755 us | }
7) + 12.410 us | }
7) 0.066 us | ttwu_stat();
7) 0.066 us | _raw_spin_unlock_irqrestore();
7) + 15.437 us | }
7) + 15.933 us | }
7) + 17.214 us | }
7) + 19.122 us | }
7) + 19.780 us | }
7) + 21.236 us | }
7) + 21.968 us | }
7) + 23.754 us | }
7) + 32.351 us | }
7) + 32.952 us | }
7) | blk_finish_plug() {
7) 0.126 us | blk_flush_plug_list();
7) 0.698 us | }
7) + 43.806 us | }
7) 0.102 us | xfs_buf_rele [xfs]();
7) + 46.409 us | }
7) + 49.390 us | }
7) + 91.377 us | }
^C
Ending tracing...
I'm not sure that's relevant, though, as I don't have the same child functions...
brendangregg
on 18 Apr 2017
Hmm. So, do we conclude that we can't reliably trace queue to issue latency with tracepoints? I see three options:
1) Do nothing: keep the kprobe-based bio* tools, and update them with more hacks as kernel changes inevitably occur (is it obvious how much I like this option?)
2) Remove the -Q option for tracing queue to issue latency.
3) Keep the -Q option, but when there is an obviously wrong result, i.e. a mismatched queue to issue, report "unknown" as the queue to issue time.
@brendangregg I'd really like to bring this to a wrap, so I'd appreciate your opinion.
goldshtn
on 30 Apr 2017
Isn't this just the XFS sync codpath that's breaking it (that we know of)? I'd be tempted to add:
// workaround for XFS FW's that become FF's:
if (key.sector < 0) { key.sector = 0; }
Sure, I can do that. I hope it's only that path - and I hope we don't end up introducing bogus results because we correlate only by dev in that case. I haven't tested this extensively in other environments so for all I know there could be more cases that we'd need to handle.
goldshtn
on 1 May 2017
right, hence putting a comment in the code.
brendangregg
on 1 May 2017
Someone else at Facebook ran into this so I just wanted to share, flushes in the kernel are special-cased so the events are a little tricky.
There are two flushing request flags: REQ_PREFLUSH (called REQ_FLUSH in older kernels), which means flush the disk's write cache before writing the request data; and REQ_FUA, which means this write should bypass the write cache. Depending on what the underlying hardware supports, one of these requests might turn into 0-3 different steps.
For example, a REQ_OP_WRITE | REQ_PREFLUSH request with no data is a simple request to flush the disk cache. If the disk does not have a writeback cache, this is a noop, so the request can be completed without ever being issued. If the disk does support a writeback cache, we don't issue this request directly, but rather a separate "flush request" which happens to have a sector of -1. We then complete the original request.
A REQ_OP_WRITE | REQ_FUA request with data also depends on the hardware. If the hardware supports FUA, the original request can be issued directly. If it does not, the request is translated to a write followed by a full flush, which means we issue and complete the original request, and then we issue and complete a special flush request like for preflush.
Of course, these can be combined, so a REQ_OP_WRITE | REQ_PREFLUSH | REQ_FUA request with data on a device with a writeback cache without FUA support would turn into a preflush, a normal write, and a postflush.
The request that XFS is making here is the first example, a simple flush with no data. So the "FW" is the original request, then the "FF" is the special flush request, which is REQ_OP_FLUSH | REQ_PREFLUSH.
The moral of the story is that flushes are messy, so they're going to have to be a special case in these tools. So just keep in mind that
- A
REQ_PREFLUSHrequest with no data will be inserted and completed without being issued. - Depending on the hardware, a separate
REQ_OP_FLUSHrequest (see here) may be issued after the originalREQ_PREFLUSHrequest is inserted. - Similarly, depending on the hardware, a separate
REQ_OP_FLUSHrequest may be issued after aREQ_FUArequest is completed. - We fiddle with the request flags in multiple places in the flush code, so you can't rely on that to track a request (e.g. here, here and here).
- This may change in the future, so you should handle unexpected sequences.
 osandov
on 11 Jul 2017
osandov
on 11 Jul 2017
@goldshtn I tested your revised version of biolatency (using tracepoints) against some logical volumes on a loop device, and unfortunately (like the old version) it shows loop0 as the device, rather than "dm-X". See #910 also. Do you think there is an elegant way that this could generically handle devmapper devices (including mdraid), such that the original device name is tracked?
 dswarbrick
on 12 Jul 2017
dswarbrick
on 12 Jul 2017
Partially answering my own question, the block_bio_remap tracepoint will catch devmapper activity:
TRACEPOINT_PROBE(block, block_bio_remap)
{
    if (args->dev != args->old_dev) {
        bpf_trace_printk("block_bio_remap old_dev: %d,%d\n",
            MAJOR(args->old_dev), MINOR(args->old_dev));
        bpf_trace_printk("block_bio_remap dev: %d,%d\n",
            MAJOR(args->dev), MINOR(args->dev));
    }
    return 0;
}
              dd-19925 [005] .... 41096.710821: : block_bio_remap old_dev: 253,1
              dd-19925 [005] .... 41096.710831: : block_bio_remap dev: 7,0
              dd-19925 [005] .... 41096.710846: : block_bio_remap old_dev: 253,1
              dd-19925 [005] .... 41096.710849: : block_bio_remap dev: 7,0
(requests split across two lines due to 3-argument limit of bpf_trace_printk)
Note that this also will be triggered for bio reqs to partitions, which get remapped to the raw block device (with an offset), i.e., old_dev: 8,2 -> dev: 8,0.
PS: @goldshtn Python has os.major() / os.minor() functions for handling dev_t numbers - no need to reimplement.
dswarbrick
on 12 Jul 2017
Should we get back to this? There were two LTS releases since the creation of this ticket.
My opinion is that tracepoint based biosnoop without queuing time is better than kprobe based biosnoop we have now.
I had the issue with a couple of disks obviously getting stuck (same picture for multiple seconds):
Device:         rrqm/s   wrqm/s     r/s     w/s    rMB/s    wMB/s avgrq-sz avgqu-sz   await r_await w_await  svctm  %util
sda               0.00     0.00    0.00    0.00     0.00     0.00     0.00     0.00    0.00    0.00    0.00   0.00   0.00
sdb               0.00     0.00    0.00    0.00     0.00     0.00     0.00     2.00    0.00    0.00    0.00   0.00 100.00
sdc               0.00     0.00    0.00    0.00     0.00     0.00     0.00     0.00    0.00    0.00    0.00   0.00   0.00
sdd               0.00     0.00    0.00    0.00     0.00     0.00     0.00     0.00    0.00    0.00    0.00   0.00   0.00
sde               0.00     0.00    0.00    0.00     0.00     0.00     0.00     0.00    0.00    0.00    0.00   0.00   0.00
sdf               0.00     0.00    0.00    0.00     0.00     0.00     0.00     2.00    0.00    0.00    0.00   0.00 100.00
In current biosnoop I saw this:
$ sudo /usr/share/bcc/tools/biosnoop | awk '$NF > 1000 { print $0 }'
...
70.634468000   dmcrypt_write  11437  sdb     W  134019072 1212416 1037.38
70.638229000   dmcrypt_write  11437  sdb     W  134021440 884736  1041.13
70.643547000   dmcrypt_write  11437  sdb     W  134023168 1212416 1046.42
70.648452000   dmcrypt_write  11437  sdb     W  134025536 884736  1051.31
70.652595000   dmcrypt_write  11437  sdb     W  134027264 1212416 1055.43
70.657393000   dmcrypt_write  11437  sdb     W  134029632 884736  1060.21
105.586649000  dmcrypt_write  11523  sdf     W  46485504  1212416 1119.34
105.764376000  dmcrypt_write  11523  sdf     W  46487872  884736  1297.05
105.934872000  dmcrypt_write  11523  sdf     W  46489600  1212416 1467.52
105.940061000  dmcrypt_write  11523  sdf     W  46491968  884736  1472.68
131.745480000  dmcrypt_write  11523  sdf     W  236050432 1048576 1133.57
131.895918000  dmcrypt_write  11523  sdf     W  236052480 1048576 1283.99
132.046939000  dmcrypt_write  11523  sdf     W  236054528 1048576 1434.99
132.197379000  dmcrypt_write  11523  sdf     W  236056576 1048576 1585.41
While in tracepoint based from @goldshtn I saw this:
$ sudo python biosnoop.py | awk '$NF > 1 { print $0 }'
...
70.207464448   kworker/13:1   32442  sdf     FF   -1        0         7.016
72.211996159   kworker/13:1   32442  sdf     FF   -1        0         1.959
72.622031800   kworker/31:1H  4821   sdb     FF   -1        0         7.021
76.414599594   cadvisor       2025   sdb     FF   -1        0         3.793
78.315507469   kworker/13:1   32442  sdb     FF   -1        0         1.704
79.988741039   kworker/20:0   7035   sdb     FF   -1        0         1.500
81.931542687   kworker/23:1   31573  sdb     FF   -1        0         1.617
83.825293856   kworker/23:0   8742   sdb     FF   -1        0         1.476
89.633290696   kworker/0:1H   4910   sdf     FF   -1        0         7.019
93.367898802   kworker/1:1    7049   sdd     FF   -1        0         3.685
94.496078864   kworker/31:1H  4821   sdb     FF   -1        0         7.114
94.630775111   swapper/0      0      sdd     FF   -1        0         1.250
96.711452486   md127_raid10   11796  sdf     FF   -1        0         7.028
99.033392542   kworker/0:1H   4910   sdf     FF   -1        0         1.419
100.488801563  dmcrypt_write  11523  sdf     W    46485504  1212416   1.119
100.666527907  dmcrypt_write  11523  sdf     W    46487872  884736    1.297
100.837022524  dmcrypt_write  11523  sdf     W    46489600  1212416   1.468
100.842217468  kworker/23:1H  4931   sdf     W    46491968  884736    1.473
101.602938628  md127_raid10   11796  sdb     FF   -1        0         7.046
102.957954320  swapper/0      0      sdb     FF   -1        0         1.355
109.978891443  kworker/3:0    27396  sdf     FF   -1        0         7.020
110.639134262  ksoftirqd/28   180    sdb     FF   -1        0         7.020
111.282573173  kworker/3:0    27396  sdf     FF   -1        0         1.303
117.657342479  swapper/0      0      sdb     FF   -1        0         7.018
117.659401959  dmcrypt_write  11437  sdb     WS   234784128 32768     7.020
120.328640783  kworker/0:1H   4910   sdb     FF   -1        0         2.669
122.182632767  kworker/3:0    27396  sdf     FF   -1        0         1.511
126.647631013  dmcrypt_write  11523  sdf     W    236050432 1048576   1.134
126.798071106  dmcrypt_write  11523  sdf     W    236052480 1048576   1.284
126.949090145  dmcrypt_write  11523  sdf     W    236054528 1048576   1.435
127.099531929  kworker/3:1H   4263   sdf     W    236056576 1048576   1.585
128.730211688  kworker/3:1H   4263   sdb     FF   -1        0         6.557
134.114154880  kworker/27:1H  4008   sdd     FF   -1        0         7.014
134.270628181  kworker/3:1H   4263   sdf     FF   -1        0         7.171
135.136450090  swapper/0      0      sdd     FF   -1        0         1.019
136.611427399  kworker/0:1H   4910   sdb     FF   -1        0         7.022
138.633013874  kworker/0:1H   4910   sdb     FF   -1        0         1.193
It seems that tracepoint catches more issues.
I think we can work on multiple requests to the same sector and queuing separately.
 bobrik
on 1 May 2018
bobrik
on 1 May 2018
Linux 4.17 provides raw_tracepoint support and bcc currently supports it as well.
block_rq_insert:
        TP_PROTO(struct request_queue *q, struct request *rq),
block_rq_issue:
        TP_PROTO(struct request_queue *q, struct request *rq),
block_rq_complete:
        TP_PROTO(struct request *rq, int error, unsigned int nr_bytes),
We probably should use raw tracepoints to resolve changing
sector number and rwbs issue related with tracepoint.
 yonghong-song
on 2 May 2018
yonghong-song
on 2 May 2018
@yonghong-song, raw_tracepoint look like a great middle ground between unstable kprobes and annoyances of current tracepoints:
- Sector number changes you mentioned
- Lack of ability to resolve dev name in kernel space (I want
sda, not(8, 1)that maps tosda1) - RWBS field is filled with
blk_fill_rwbsand it's non-trivial to fold back
The problem with raw tracepoints is that they are 4.17+ and 4.17 is not even released, not to mention it's not even LTS. Is there a sane way to make this work on 4.14 (which is the latest LTS)?
cc @4ast
bobrik
on 2 May 2018
Is there a sane way to make this work on 4.14 (which is the latest LTS)?
Probably not. This is a feature so backporting is not possible in general.
In the meantime, maybe tracepoint based solution should be used instead of kprobe.
Although we may not be able to resolve dev name in the kernel, I guess we can still do it in user space using /proc partition table.
yonghong-song
on 3 May 2018
@brendangregg @goldshtn @mcaleavya @osandov @dswarbrick @bobrik @yonghong-song Sorry to bother you, I used iosnoop (which impled by tracepoints) and met similar problem like https://github.com/brendangregg/perf-tools/issues/27, from output, I didn't see LOST.*EVENTS
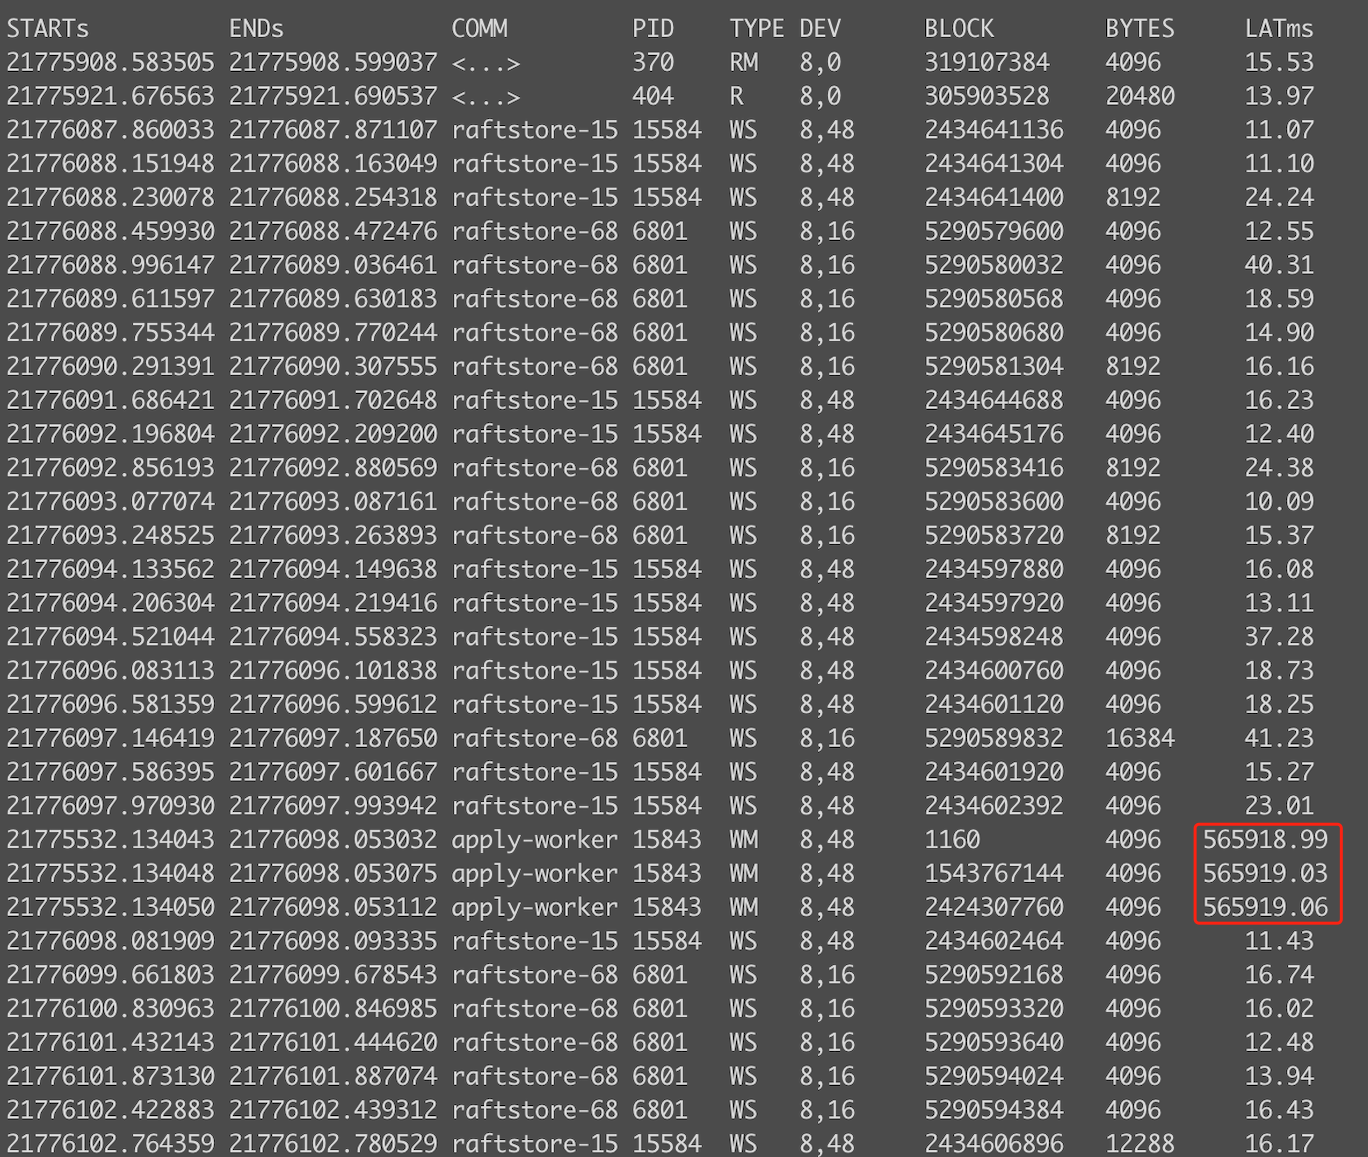 so why the latency is about 9.4 min? It's impossible. So under what circumstances will this problem occur?
 ethercflow
on 9 Sep 2019
ethercflow
on 9 Sep 2019
Related issues
 a0viedo
·
7Comments
a0viedo
·
7Comments
 ChaosData
·
4Comments
ChaosData
·
4Comments
 iaguis
·
4Comments
iaguis
·
4Comments
 paipanka
·
6Comments
paipanka
·
6Comments
 butterl
·
6Comments
butterl
·
6Comments
Most helpful comment
Someone else at Facebook ran into this so I just wanted to share, flushes in the kernel are special-cased so the events are a little tricky.
There are two flushing request flags:
REQ_PREFLUSH(calledREQ_FLUSHin older kernels), which means flush the disk's write cache before writing the request data; andREQ_FUA, which means this write should bypass the write cache. Depending on what the underlying hardware supports, one of these requests might turn into 0-3 different steps.For example, a
REQ_OP_WRITE | REQ_PREFLUSHrequest with no data is a simple request to flush the disk cache. If the disk does not have a writeback cache, this is a noop, so the request can be completed without ever being issued. If the disk does support a writeback cache, we don't issue this request directly, but rather a separate "flush request" which happens to have a sector of -1. We then complete the original request.A
REQ_OP_WRITE | REQ_FUArequest with data also depends on the hardware. If the hardware supports FUA, the original request can be issued directly. If it does not, the request is translated to a write followed by a full flush, which means we issue and complete the original request, and then we issue and complete a special flush request like for preflush.Of course, these can be combined, so a
REQ_OP_WRITE | REQ_PREFLUSH | REQ_FUArequest with data on a device with a writeback cache without FUA support would turn into a preflush, a normal write, and a postflush.The request that XFS is making here is the first example, a simple flush with no data. So the "FW" is the original request, then the "FF" is the special flush request, which is
REQ_OP_FLUSH | REQ_PREFLUSH.The moral of the story is that flushes are messy, so they're going to have to be a special case in these tools. So just keep in mind that
REQ_PREFLUSHrequest with no data will be inserted and completed without being issued.REQ_OP_FLUSHrequest (see here) may be issued after the originalREQ_PREFLUSHrequest is inserted.REQ_OP_FLUSHrequest may be issued after aREQ_FUArequest is completed.