Azure-iot-sdk-csharp: Massive memory leak in RetryDelegatingHandler
We have a massive memory leak in the RetryDelegatingHandler if there is no connection to the IoTHub (we use Http1).
The leaking objects are: System.Threading.Tasks.UnwrapPromise~1[[Microsoft.Azure.Devices.Client.Message, Microsoft.Azure.Devices.Client]]
If you take a deeper look into it, it shows the GC root as:
0:000> !GCRoot -all 25076704
Thread 1b14:
    09a1df64 69fcf89e System.Threading.Tasks.ContinuationResultTaskFromResultTask-2[[System.__Canon, mscorlib],[System.__Canon, mscorlib]].InnerInvoke()
        esi:
            ->  250d28ac System.Threading.Tasks.ContinuationResultTaskFromResultTask-2[[Microsoft.Azure.Devices.Client.Message, Microsoft.Azure.Devices.Client],[System.Threading.Tasks.Task-1[[Microsoft.Azure.Devices.Client.Message, Microsoft.Azure.Devices.Client]], mscorlib]]
            ->  250d2974 System.Threading.Tasks.UnwrapPromise-1[[Microsoft.Azure.Devices.Client.Message, Microsoft.Azure.Devices.Client]]
            ->  250ccf78 System.Threading.Tasks.UnwrapPromise~1[[Microsoft.Azure.Devices.Client.Message, Microsoft.Azure.Devices.Client]]
            ->  250c93e0 System.Threading.Tasks.UnwrapPromise-1[[Microsoft.Azure.Devices.Client.Message, Microsoft.Azure.Devices.Client]]
    <...cut...>
If you then take a look at the root object:
0:000> !do 250d28ac
Name:        System.Threading.Tasks.ContinuationResultTaskFromResultTask`2[[Microsoft.Azure.Devices.Client.Message, Microsoft.Azure.Devices.Client],[System.Threading.Tasks.Task`1[[Microsoft.Azure.Devices.Client.Message, Microsoft.Azure.Devices.Client]], mscorlib]]
You will see this Action:
0:000> !do 250d288c
Name:        System.Func`2[[System.Threading.Tasks.Task`1[[Microsoft.Azure.Devices.Client.Message, Microsoft.Azure.Devices.Client]], mscorlib],[System.Threading.Tasks.Task`1[[Microsoft.Azure.Devices.Client.Message, Microsoft.Azure.Devices.Client]], mscorlib]]
Which points to the following target:
0:000> !do 0140c034
Name:        Microsoft.Practices.EnterpriseLibrary.TransientFaultHandling.AsyncExecution`1[[Microsoft.Azure.Devices.Client.Message, Microsoft.Azure.Devices.Client]]
The AsyncExecution point then to this 'taskFunc':
System.Func1[[System.Threading.Tasks.Task-1[[Microsoft.Azure.Devices.Client.Message, Microsoft.Azure.Devices.Client]], mscorlib]]`
which points to this target: Microsoft.Azure.Devices.Client.Transport.RetryDelegatingHandler+<>c__DisplayClass12_0
So from my point of view, the problem is somehow related to the TransientFaultHandling...
Preliminary solution:
In DeviceClient.cs we commented ot the following lines (RetryDelegatingHandler) in the BuildPipeline which inetrnally uses the TransientFaultHandling from the EnterpriseLibrary:
        static IDeviceClientPipelineBuilder BuildPipeline()
        {
            var transporthandlerFactory = new TransportHandlerFactory();
            IDeviceClientPipelineBuilder pipelineBuilder = new DeviceClientPipelineBuilder()
                .With(ctx => new GateKeeperDelegatingHandler(ctx))
#if !WINDOWS_UWP && !PCL
//                .With(ctx => new RetryDelegatingHandler(ctx))
#endif
                .With(ctx => new ErrorDelegatingHandler(ctx))
                .With(ctx => new ProtocolRoutingDelegatingHandler(ctx))
                .With(ctx => transporthandlerFactory.Create(ctx));
            return pipelineBuilder;
        }
 JochenKalmbach
All 44 comments
By the way: We send only about 5 messages... and get a memory leak of about 6276314 objects of System.Threading.Tasks.UnwrapPromise-1[[Microsoft.Azure.Devices.Client.Message, Microsoft.Azure.Devices.Client]]... consuming 301263072 bytes... and this is produced in a very short time (30 minutes)...
JochenKalmbach
on 12 Apr 2017
Hi @JochenKalmbach, Sorry for the late response. I have ran the DeviceClientHttpSample with slight modification so that it will send 5 messages, one after another despite the exception on failure to send due to no connection to the IoTHub. In my test run, I used the diagnostic tools to monitor memory usage. I saw memory usage climbed to 24MB at start and stayed about the same throughout the test (~15min). Heap size was in the range of 460-470KB in different snapshots.
I am not seeing "massive" memory leak. I have also took snapshots around the time which the previous message sent failed and the sdk is also started on sending the next message. At that point, object count would increased. After GC kicks in, the object counts would drop back to about the same level. The RetryDelegatingHandler and TransientFaultHandling would definitely consume some amount of memory. When any operation failed, retries would start on the sdk until timeout.
If you have the issue repro differently, please let me know. Thanks.
 jasmineymlo
on 26 Apr 2017
jasmineymlo
on 26 Apr 2017
@JochenKalmbach - Can you also provide us the version of the SDK that you're using?
 tameraw
on 2 May 2017
tameraw
on 2 May 2017
We have first used this Version 2017-4-7.
Then we compiled it by our own and used this Version (which should be the same):
https://github.com/Azure/azure-iot-sdk-csharp/commit/0a657f119b84074fc4865c119a0b213804eff693
And in both cases we had (in some situations) a massive Memory leak. Then we removed the ".With(ctx => new RetryDelegatingHandler(ctx))" line (see abouve) and the leak went away.... We already have our own retry mechanism, so we do not need it from the DeviceClient...
Also, just a note: From my Point of view, the DeviceClient assembly is unusable, because it has too many dependencies and does way too much in the background.... please provide a "slim" version for professional usage...
JochenKalmbach
on 3 May 2017
Hello @JochenKalmbach sorry the late on this.
I have done the same tests as @jasmineymlo and I couldn't reproduce the issue when using DeviceClientHttpSample and disconnecting and connecting my network while sending messages every 10 milliseconds.
I did another test that was to don't await deviceClient.sendEventAsync(eventMessage);
I changed it to something like:
deviceClient.SendEventAsync(eventMessage);
instead of
await deviceClient.SendEventAsync(eventMessage);
If I do that I can also see a massive memory leak.
Therefore my questions are:
- Can you reproduce the issue using DeviceClientHttpSample and changing only the loop cycle to send messages every 10 milliseconds?
- Are you awaiting deviceClient.SendEventAsync(eventMessage); ?
Thanks :)!
 asergaz
on 16 May 2017
asergaz
on 16 May 2017
We have invested a little bit more: The problem only appears, if the network-adapter is "off" and the call to "gethostbyname" (and all other network related functions) immediately returns; normally it will go into an timeout... but in some situations (in our case, if we disconnect the cable from the PC), the call immediately returns and then the leak starts...
JochenKalmbach
on 16 May 2017
Hi @JochenKalmbach thanks for investing on it a bit more. And you are using the sample and our sdk as is? Can you share the code with me? Please send me an email on [email protected] . Thanks.
asergaz
on 17 May 2017
Hello @JochenKalmbach do you still see the issue with the new versions of the SDK? Thanks
asergaz
on 8 Jun 2017
We have not yet tested it... we might also never test it again, because we move away from DeviceClient, because it has too many dependencies...
JochenKalmbach
on 9 Jun 2017
Hi @JochenKalmbach
I am trying to gather some feedback on what customers would expect from our SDKs to ensure we are delivering what you need.
Can you please let us know what too many dependencies means for you? The client SDK offers a lot of functionality which indeed come with dependencies requirements. For you to implement these functionalities on your own will require dev time and obviously dependencies as well.
I think the question I am asking is: which features of IoT Hub are you using/not using amongst raw messaging, Device twins, Device direct methods, retry policies,... ?
What would you consider helping you without being in the way (architecture for the SDK, features support,...)?
Thanks
 olivierbloch
on 9 Jun 2017
olivierbloch
on 9 Jun 2017
Hello,
we finally have a working example for .Net 4.5 and .Net 4.6. You can find it here:
https://github.com/K47S/IotHubTesting
Just add your IotHubConnection string to the appsettings and ensure that your computer doesnt have an network connection or a working connection without internet access.
In a short amount of time the CPU on my machine goes to 95-100% and the used memory is growing.
 MD-V
on 14 Aug 2017
MD-V
on 14 Aug 2017
Is there any news on this? In my company we do suffer from the same problem.
 Meandron
on 25 Aug 2017
Meandron
on 25 Aug 2017
Hello @K47S @Meandron ,
I will set the repro of the issue on my machine and let you know if I was able to see the same behavior.
Thanks for setting this up.
asergaz
on 16 Sep 2017
i also have this problem, if there is no active internet connection, if there is a firewall block etc.
 ygulsen
on 25 Sep 2017
ygulsen
on 25 Sep 2017
@sergaz-msft have you had time to look into that? I think this is a very high priority problem. Because we use this in production we had to compile our own version without the problem.... be we aren't able to update the package....
MD-V
on 26 Sep 2017
@JochenKalmbach 's suggestion to comment out RetryDelegatingHandler fixed the memory leak issue on our side, on the other side i am not sure what we have broken
ygulsen
on 28 Sep 2017
An automatic retry is now disabled; but we have already our own retry machanism, so we had not used it at all...
JochenKalmbach
on 28 Sep 2017
can you give some details on how you implement your own retry mechanism?, maybe an example?
anyways, @JochenKalmbach thanks for sharing your findings. It is very disappointing that repo owners dont take this issue seriously as it has been like half a year.
ygulsen
on 29 Sep 2017
Maybe the issue was fixed in release 1.5.0. inital tests showed that retrypolicy none now works. I will update my testing repo and try. @ygulsen: If you have time you could also fork my repo (link in comment above) and try it with tthe new nuget package...
MD-V
on 29 Sep 2017
I would really appreciate if someone from the official site would confirm that the memory leak problem is fixed in version 1.5.0....
Meandron
on 5 Oct 2017
i was already using 1.5.0 when i detected the leak. So it is not fixed. I did not test with retry policy but that does not mean the leak is not there anyways.
ygulsen
on 5 Oct 2017
It is only "fixed" if you disable the retry ;) so the original problem is still there....
JochenKalmbach
on 6 Oct 2017
@sergaz-msft - Any update on this? Thanks.
tameraw
on 18 Oct 2017
I was able to reproduce the issue using @K47S code he provided above. I am seeing a jump from about 11 mb of usage to 22 mb of usage at which point it holds steady. I am looking into what may be causing it now.
@K47S @ygulsen @Meandron @JochenKalmbach is this in line with the kind of memory jump you are seeing?
 ryan-z-johnson
on 24 Oct 2017
ryan-z-johnson
on 24 Oct 2017
@ryan-z-Johnson: In our scenario the memory increases until about 3 GB and then the process crashes... so not really the issue you are seeing... increase to 22 mb should be ok....
JochenKalmbach
on 24 Oct 2017
Would you be able to provide what you are using to track the memory leak, time it takes to crash, and how you have your environment setup so I can try and reproduce as much as possible.
From: Jochen Kalmbach notifications@github.com
Sent: Tuesday, October 24, 2017 11:26:01 AM
To: Azure/azure-iot-sdk-csharp
Cc: Ryan Johnson (AZURE); Mention
Subject: Re: [Azure/azure-iot-sdk-csharp] Massive memory leak in RetryDelegatingHandler (#85)
@ryan-z-johnsonhttps://na01.safelinks.protection.outlook.com/?url=https%3A%2F%2Fgithub.com%2Fryan-z-johnson&data=02%7C01%7Cryjoh%40microsoft.com%7C23edd204673140b4319108d51b0caef3%7C72f988bf86f141af91ab2d7cd011db47%7C1%7C0%7C636444663645157919&sdata=wN50zFii5nWZBKDw7S%2Fp6MeE%2B5Y%2B03kFSREm1js6igI%3D&reserved=0: In our scenario the memory increases until about 3 GB and then the process crashes... so not really the issue you are seeing... increase to 22 mb should be ok....
—
You are receiving this because you were mentioned.
Reply to this email directly, view it on GitHubhttps://na01.safelinks.protection.outlook.com/?url=https%3A%2F%2Fgithub.com%2FAzure%2Fazure-iot-sdk-csharp%2Fissues%2F85%23issuecomment-339086032&data=02%7C01%7Cryjoh%40microsoft.com%7C23edd204673140b4319108d51b0caef3%7C72f988bf86f141af91ab2d7cd011db47%7C1%7C0%7C636444663645157919&sdata=gZRNga7vC8FkYuEhZKag53XmGwaje7GCSPDynORsXtE%3D&reserved=0, or mute the threadhttps://na01.safelinks.protection.outlook.com/?url=https%3A%2F%2Fgithub.com%2Fnotifications%2Funsubscribe-auth%2FAcmch49tT0OmRR-W1npLVB8g-FQH5axCks5sviu5gaJpZM4M7EtQ&data=02%7C01%7Cryjoh%40microsoft.com%7C23edd204673140b4319108d51b0caef3%7C72f988bf86f141af91ab2d7cd011db47%7C1%7C0%7C636444663645157919&sdata=YlKpGAv%2BT5Wcisz%2FZ9Od2fj9NhoEQyo%2FZ7zELbmeX6U%3D&reserved=0.
ryan-z-johnson
on 24 Oct 2017
The comment from @K47S explains what environment we have:
https://github.com/Azure/azure-iot-sdk-csharp/issues/85#issuecomment-322156501
Env: Win7 / 32 Bit process / Disconnect network cable
JochenKalmbach
on 24 Oct 2017
It is quickly to 3gb or over a few hours? @JochenKalmbach
ryan-z-johnson
on 24 Oct 2017
About 2-3 hours
JochenKalmbach
on 24 Oct 2017
@JochenKalmbach is it a linear growth or exponential growth of the memory usage?
ryan-z-johnson
on 24 Oct 2017
Linear...
JochenKalmbach
on 25 Oct 2017
@JochenKalmbach thanks for your patience. @ryan-z-johnson and I are actively working on this issue.
We've found that FileStream objects are being leaked. They don't appear to be originating in our code but in one of the dependencies.
We'll keep this thread up to date with our investigation.
 CIPop
on 27 Oct 2017
CIPop
on 27 Oct 2017
@JochenKalmbach I have some findings, I was able to replicate your issue where it leaked UnwrapPromise objects. I implemented my own retry set it to retry after 1 tick and always retry just to force a fast growth of memory. And in the loop I have it force GC after 10,000 operations.
AMQP_WS

AMQP_WS does not see this issue as you can see the memory bounces back and forth as the GC runs.
MQTT_WS
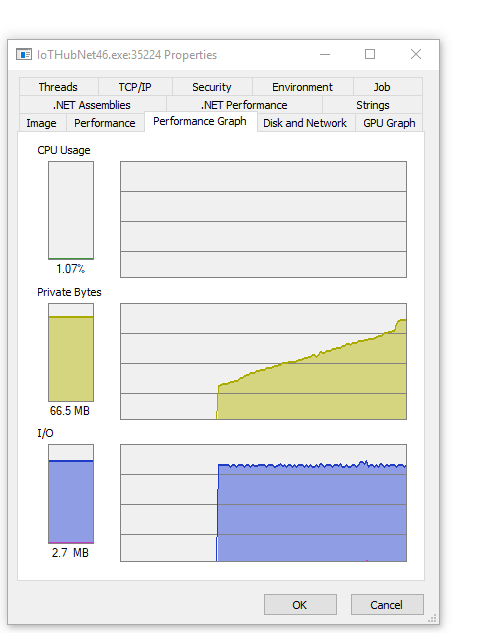
This is using the same code just using MQTT_WS instead and you can see a growth but when GC runs it is not releasing any memory.
HTTP

HTTP is not having this issue as it seems to never be increasing.
AMQP
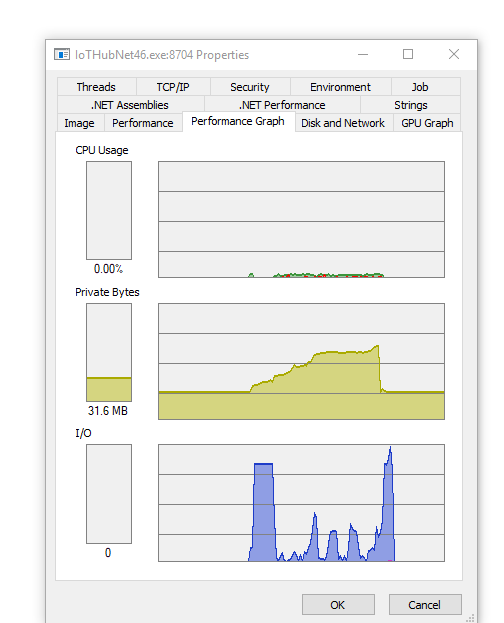
AMQP is not having the same issue, it's leaking byte arrays which could be because every millisecond I am generating a new batch of 5 messages and then forcing a time out of 1 tick and always retrying. This could be how I am reproing the issue.
MQTT
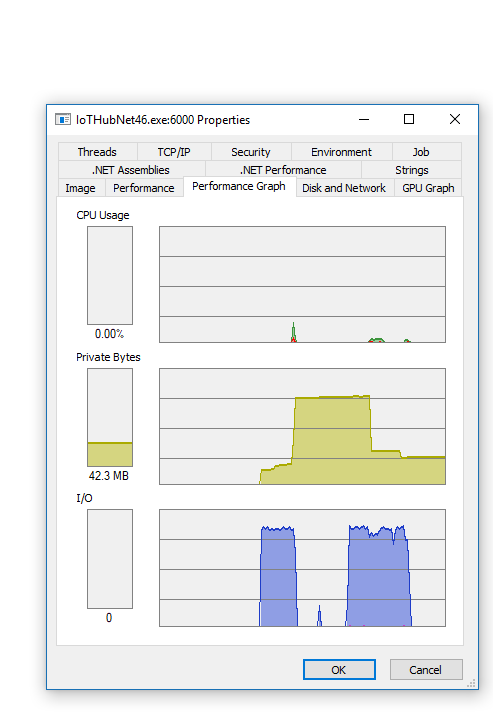
MQTT is allocating memory but it looks to be the same issue as AMQP with allocating a batch of 5 messages every millisecond. Again, could be releated to how I have the repro setup.
Here is the repo for the code I am using
Let me know if you have any questions.
ryan-z-johnson
on 28 Oct 2017
@ryan-z-johnson on windows 7 embedded, disconnect network cable and in a couple of hours memory jumps to maximum avaliable (in our hardware it is 4gb) then crashes
ygulsen
on 30 Oct 2017
@ygulsen what protocol?
ryan-z-johnson
on 30 Oct 2017
sorry, mqtt
ygulsen
on 31 Oct 2017
@ryan-z-johnson Good investigation, but you are using a custom RetryPolicy in your code. We are using:
deviceClient.RetryPolicy = RetryPolicyType.No_Retry;
And this one is still generating MemoryLeaks in the newest version (Windows 7, AMQP_WebSock, nuget version: 1.5.2)...
MD-V
on 17 Nov 2017
@K47S I have submitted a fix to the memory leak issues in pull request #236.
ryan-z-johnson
on 18 Nov 2017
I’ve isolated two issues linked to the leak and have a workaround until we derive a proper fix on our side:
C#
            DeviceClient deviceClient = DeviceClient.Create( ...
            int transientFaultRetryCount = 10;
            deviceClient.OperationTimeoutInMilliseconds = 0;
            deviceClient.SetRetryPolicy(new ExponentialBackoff(transientFaultRetryCount, TimeSpan.FromMilliseconds(100), TimeSpan.FromSeconds(10), TimeSpan.FromMilliseconds(100)));
I’ve tested this with @K47S 's repro but over MQTT (TCP with WS fallback) for 1-2 hrs and did not notice any increase in memory (heap remained around 300k compared with 2MB growth in under 2 minutes before). (Note that WebSockets are handled differently in Win7 vs Win8+.)
@JochenKalmbach, @K47S, @ygulsen @Meandron please let us know if the above code fixes the leak for your scenario.
The code above will:
- Disable operation timeouts which have a design-level bug: while the application regains control after a timeout, the actual operation is not cancelled and will continue to run according to the current (or default) RetryPolicy.
- Set a transient fault retry policy that will eventually give up. The current default policy will retry a max-Int number of times. If the error is transient, we shouldn’t attempt to retry until success. Instead, the application should have control and decide what to do next.
Some examples on what to do in case of long network outages:
a. try to re-connect the physical interface
b. connect via a different physical interface (wifi vs 3G)
c. reboot (in case there is some driver stuck)
d. emit a warning event for a human operator to investigate
e. if the device is using our new Provisioning Service: re-run provisioning
__In Detail__
The error is caused by a mix between the two design issues: the timeout mechanism using OperationTimeoutInMilliseconds will return control to the application while the default RetryPolicy will continue to run the initial operation until it succeeds (forever in the case when the device can never connect). In the 3rd party GitHub repro code, the application will immediately attempt another operation which will repeat the process. After a number of repeats we end up having thousands of operations that retry ad infinitum thus creating the memory leak (of background operations that keep retrying).
I will submit an initial fix on our side to address 2: replace the default policy with a low retry count for transient errors.
1 is harder to fix as we need to rely on cooperative termination mechanisms instead of just returning the control to the application while background operations continue. Since I/O operations don’t always support immediate cancellation, the API behavior will change (e.g. setting a timeout of 2 seconds might mean that cancellation is attempted but may end up actually taking effect after 1 minute, although guaranteeing at that time that all I/O was gracefully terminated).
BTW: @K47S looking at the current code deviceClient.RetryPolicy = RetryPolicyType.No_Retry; has no effect.
CIPop
on 8 Dec 2017
After reverting the code altering the maximum number of retries I've observed that 8% of the requests were never cancelled.
This was caused by a race condition between the cancellationToken getting cancelled and cancellationTokenSource being disposed. If the cts got disposed, the TransientFault code would keep throwing and retrying without actually executing the operation. Removed the cts dispose and relying on GC for cts dispose and collection.
CIPop
on 18 Dec 2017
can we assume the memory leak in op still exists?
ygulsen
on 2 Feb 2018
can we assume the memory leak in op still exists?
@ygulsen Since the bug was closed as resolved by above PR, that wouldn't be a correct assumption.
Are you asking because you are seeing a memory leak with builds >1.6.1?
CIPop
on 2 Feb 2018
I got mixed results from some customers but did not investigate further, thx anyway
ygulsen
on 5 Feb 2018
I got mixed results from some customers but did not investigate further, thx anyway
@ygulsen if you still see high resource (CPU/RAM, etc) utilization using our SDK > 1.6.1 please open a new issue.
CIPop
on 7 Feb 2018
Related issues
 langebo
·
4Comments
langebo
·
4Comments
 JohnKozell
·
4Comments
JohnKozell
·
4Comments
 dmytro-gokun
·
10Comments
dmytro-gokun
·
10Comments
 ynyang
·
3Comments
ynyang
·
3Comments
 andrejohansson
·
6Comments
andrejohansson
·
6Comments
Most helpful comment
Is there any news on this? In my company we do suffer from the same problem.