Azure-functions-host: Function proxy receives 429 response from downstream function app
Our function proxy app occasionally receives a 429 response code from a downstream function app.
The downstream function app is not hitting any concurrent HTTP limits (it only gets 3 total requests per minute). The request can be seen as a failed dependency of the function proxy app in Application Insights logs. The HTTP request is not visible in the logs of the downstream function app. Most of the requests to this app succeed, but we occasionally see a batch of 429 responses.
Investigative information
Please provide the following:
- Timestamp: 12/15/2020, 11:57:25 AM (UTC)
- Function App version: 3
- Invocation ID: 313a6f27-e40c-41e4-aa54-d9f285fde375
- Region: Canada Central (also noticed happening in UK South in other function proxies/apps)
Repro steps
Make an HTTP request to the Function Proxy app.
Expected behavior
The proxy app forwards the request to a function app.
The downstream function app handles the HTTP request and returns a 200 response code.
Actual behavior
The downstream function app returns a 429 response code.
Known workarounds
None.
Related information
The downstream function app is a compiled C# function app. The same code is deployed to other regions and is working OK there. The 429 response code is only received occasionally, with the majority of requests being handled successfully. There are very few requests to this app and there is no way we are hitting concurrency limits. Memory and CPU look to be stable throughout.
 andyblack19
All 36 comments
We've experienced a similar situation.
Since friday 12/11 we've been bombarded with 429s in response from our http triggered functions.
We found that adding the following in our hosts.json worked as a workaround:
"extensions": {
    "http": {
      "dynamicThrottlesEnabled": false
    }
  }
Docs: https://docs.microsoft.com/pt-br/azure/azure-functions/functions-bindings-http-webhook-output
But since we haven't touched our functions when the 429s started, I believe some defaults were changed.
 cjaferre
on 15 Dec 2020
cjaferre
on 15 Dec 2020
Since friday 12/11 we've been bombarded with 429s in response from our http triggered functions.
We found that adding the following in our hosts.json worked as a workaround:
"extensions": {
    "http": {
      "dynamicThrottlesEnabled": false
    }
  }
Docs: https://docs.microsoft.com/pt-br/azure/azure-functions/functions-bindings-http-webhook-output
But since we haven't touched our functions when the 429s started, I believe some defaults were changed.
We also see it starting on Friday 12/11, with nothing new deployed there for a number of weeks.
I've disabled the performance throttling as you suggest and it seems to be OK so far. But as the 429s are sporadic, I will continue monitoring throughout the week.
andyblack19
on 15 Dec 2020
Yesterday I was getting very frustrated trying to get a patch out the door for one of our systems, the automated test suite kept failing due to 429s against a functions app for testing outcomes... The remedy proposed here, is to redeploy all my host.json files? 😢
 t-l-k
on 15 Dec 2020
t-l-k
on 15 Dec 2020
@andyblack19 - do you mind giving me information for both function apps? I think you gave me the information just for the function app with proxy functions. Thanks!
 mhoeger
on 15 Dec 2020
mhoeger
on 15 Dec 2020
Btw - we are investigating this issue and will try to have updates ASAP!
mhoeger
on 15 Dec 2020
Hi @mhoeger,
If it helps...
We are experiencing it with a single function, with no proxies, we call directly the functions httptrigger endpoint.
As a matter of fact we have 5 different functions, all httptriggered, only one of them accessing blob storage, the others do not have any dependency call.
We have each of them mirrored in BrazilSouth, WestEurope and CentralUS. We are seeing the 429s on all functions, in multiple locations.
For the ones we republished with the workaround I've previously posted, the problem seems to be solved, we are still monitoring them.
Thanks
cjaferre
on 15 Dec 2020
I can confirm the problem is still happening even with the setting of "dynamicThrottlesEnabled": false in host.json
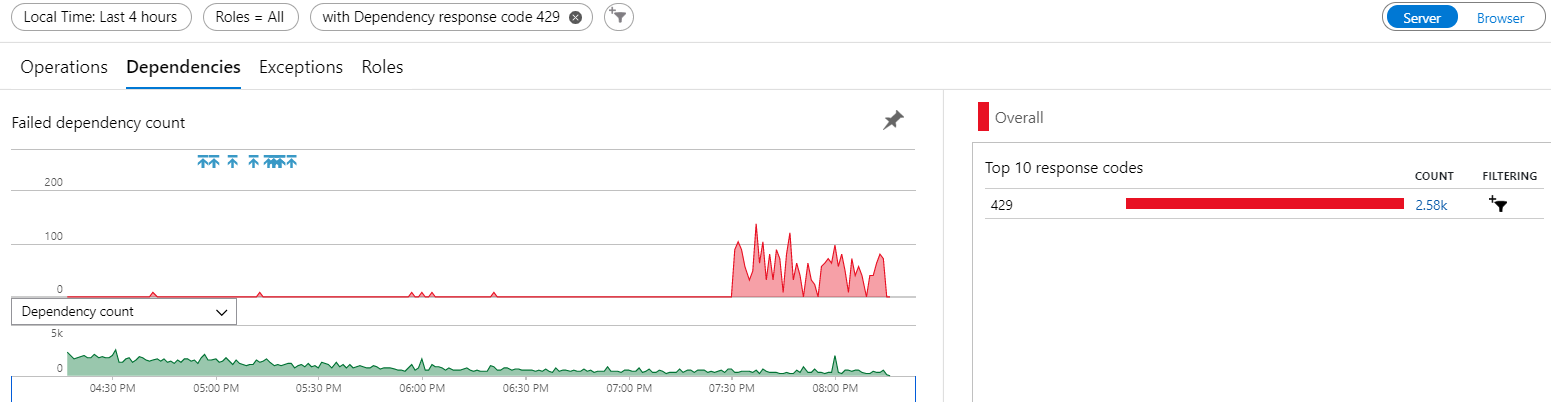
This has now started happening across multiple function apps of ours, seemingly at random. Here's a graph of it happening for a different* function app, starting at 7:30pm UTC, despite no releases around then and with only a fraction of the traffic we had earlier on in the day. All of those blue arrow release tags are me setting that value in host.json across our function apps.
andyblack19
on 15 Dec 2020
Hi @andyblack19 - sorry is this for the app that you gave the Invocation ID for (313a6f27-e40c-41e4-aa54-d9f285fde375)? And do you have that time in UTC?
"dynamicThrottlesEnabled": false in host.json should be the right mitigation for now so I'm surprised to hear that :/
mhoeger
on 15 Dec 2020
@mhoeger No sorry, that was for a different function app, just to show that it is happening for me across multiple function apps - not an isolated problem.
The invocation id in the original post is for the function proxy app, you should be able to see the name of the proxy app and downstream function app as a failed HTTP dependency? I'd rather not post the function app names in public.
I cannot find any request logs for the downstream function app returning a 429, it's as if it's not been invoked or blocked by the infrastructure. All times I've given are in UTC.
andyblack19
on 15 Dec 2020
Yesterday I was getting very frustrated trying to get a patch out the door for one of our systems, the automated test suite kept failing due to
429s against a functions app for testing outcomes... The remedy proposed here, is to redeploy all myhost.jsonfiles? 😢
@t-l-k I also had a lot of 429 response codes today from our function apps straight after a deployment (when adding the dynamicThrottlesEnabled setting).
andyblack19
on 15 Dec 2020
My azure support contact informs me that this is the fix in progress: https://github.com/Azure/azure-functions-host/pull/6986
It looks like I've also been able to prevent this from happening by pinning the FUNCTIONS_EXTENSION_VERSION to the previous version 3.0.15149 in the function app settings
andyblack19
on 15 Dec 2020
@andyblack19 3.0.15149 also has the issue, so I'd be surprised if that pinning is what fixed it for you, instead of the recommended host.json update. Pinning to 3.0.14916 would work.
 mathewc
on 15 Dec 2020
mathewc
on 15 Dec 2020
@andyblack19 3.0.15149 also has the issue, so I'd be surprised if that pinning is what fixed it for you, instead of the recommended host.json update. Pinning to 3.0.14916 would work.
Ah OK, probably coincidence then not monitoring for long enough after the app restart. I'll drop it down further, thanks!
As an aside, we've seen this happening even with the recommended host.json update, as above https://github.com/Azure/azure-functions-host/issues/6984#issuecomment-745545691
andyblack19
on 15 Dec 2020
Just wanted to chime in and let you know I saw the same thing about 18 hours ago, but via Azure Api Management (calling the Function app). 93 of 142 requests got 429 too many connections.
 PatrikNorrgard
on 16 Dec 2020
PatrikNorrgard
on 16 Dec 2020
I'd like to reiterate for anyone else, we are still seeing the 429 problem even with "dynamicThrottlesEnabled": false set in our host.json. It's happened to both a function app and function proxy app since being applied early yesterday (I'm in UK (UTC)).
Only pinning FUNCTIONS_EXTENSION_VERSION to 3.0.14916 is a successful workaround for us.
andyblack19
on 16 Dec 2020
I'd like to reiterate for anyone else, we are still seeing the 429 problem even with
"dynamicThrottlesEnabled": falseset in our host.json. It's happened to both a function app and function proxy app since being applied early yesterday (I'm in UK (UTC)).
Only pinningFUNCTIONS_EXTENSION_VERSIONto3.0.14916is a successful workaround for us.
Same here.
Now I've pinned all functions to this version, let's see how it handles...
cjaferre
on 16 Dec 2020
We are still experiencing this as well, even though we pinned the FUNCTIONS_EXTENSION_VERSION to 3.0.14916. Any news about what is causing this and when it will be resolved?
Anybody opened an Azure support request?
PatrikNorrgard
on 16 Dec 2020
@PatrikNorrgard That's strange, we've not seen it since pinning and have handled ~500k requests. We still have that host.json setting too, just in case.
Yes, I've an active support request open, which they have advised has been escalated internally and is being worked on. My contact is in EST, so should be back online shortly 😁
Update: Our PG team is still working on Internally escalated case based on this ticket. Couple of other customers were also experienced similar behavior and it has been reported to PG team.
We will keep you updated as soon as the fix ready and rolled out.
andyblack19
on 16 Dec 2020
We have the same situation on our end. I will try targeting the function runtime explicitly to rollback to 3.0.14916.

 mathieuisabel
on 16 Dec 2020
mathieuisabel
on 16 Dec 2020
@PatrikNorrgard That's strange, we've not seen it since pinning and have handled ~500k requests. We still have that host.json setting too, just in case.
Yes, I've an active support request open, which they have advised has been escalated internally and is being worked on. My contact is in EST, so should be back online shortly 😁Update: Our PG team is still working on Internally escalated case based on this ticket. Couple of other customers were also experienced similar behavior and it has been reported to PG team.
We will keep you updated as soon as the fix ready and rolled out.
Ah, I didn´t change the host.json file, maybe that´s what works for you.
I did however implement a retry-policy in Api Management now, hoping that it will hide those 429 errors from customers by internal retries.
I was thinking about opening a support case, but as we´re a CSP customer I couldn´t do it via the portal, but have to use email.
PatrikNorrgard
on 16 Dec 2020
@andyblack19 To resolve this on your did you have to both pin the function runtime version and set dynamicThrottlesEnabled to false? Or only pinning the function runtime did the job?
mathieuisabel
on 16 Dec 2020
To resolve this on your did you have to both pin the function runtime version and set dynamicThrottlesEnabled to false? Or only pinning the function runtime did the job?
We have both 'workarounds' applied currently and it seems to be working so far.
I'm not sure if _only_ pinning the version will have worked, as I'd already set the dynamicThrottlesEnabled to false everywhere, which had no effect on its own.
andyblack19
on 16 Dec 2020
To resolve this on your did you have to both pin the function runtime version and set dynamicThrottlesEnabled to false? Or only pinning the function runtime did the job?
We have both 'workarounds' applied currently and it seems to be working so far.
I'm not sure if _only_ pinning the version will have worked, as I'd already set the dynamicThrottlesEnabled to false everywhere, which had no effect on its own.
Thanks for confirming. I'm currently trying with only pinning the version for certain apps and also pinning the version and setting dynamicThresholdsEnabled on others to confirm what's needed. All in all, folks here and Stackoverflow were more helpful than Az support so far, they've been checking the logs for 2 days now... :-D
mathieuisabel
on 16 Dec 2020
The weird thing is that this is only happening to one of 93 Functions for us. And of course it is one used by an important client :)
This Function only sees moderate load, maybe 200 calls a day. Let´s hope the Api Management retry will save us until this gets fixed.
@mathieuisabel, for us it seems ONLY pinning won´t make this issue go away, but it seems to reduce the occurence a lot.
PatrikNorrgard
on 16 Dec 2020
@PatrikNorrgard On our side they're not high volume function apps (i.e. 100s to ~15K requests a day) but pretty much all of our apps are impacted at the moment. One of those days where you tell yourself we have to have better retry logic in the calling application but still, it was working fine before. Oh well!
mathieuisabel
on 16 Dec 2020
We have like 150k requests per day.
Applying both the hosts.json workaround AND pinning did the job.
Right now we are seeing 100 to 200 req/sec and no problems reported so far.
cjaferre
on 16 Dec 2020
I cannot find any request logs for the downstream function app returning a 429, it's as if it's not been invoked or blocked by the infrastructure. All times I've given are in UTC.
@andyblack19 same - I cannot find any evidence the apps are failing in the associated application insights - and mine normally faithfully log _everything_ (including stuff that happens during startup). Upstream services are recording the failure, and annoyingly, 429s are not included in Polly's AddTransientHttpErrorPolicy, it appears. Meh, possibly a good reason for that? (e.g. why continually hammer a server which is reportedly too busy? Not sure)
I'm still experiencing it regardless of the host.json setting, now I read pinning the version ...
I did have all my function apps pinned with runtime version 3.0.14785 (Oct 6th release), but now they're running 3.0.15185.0, without my permission. 2 months old! Come on?! Serverless nightmare. Imma go pin 3.0.14916 and redeploy everything _again_.
t-l-k
on 16 Dec 2020
Setting the function runtime explicitly to 3.0.14916 solved the issues for us. Unfortunately, we don't even see the Rate-Limited requests in Application Insights, they seem to be blocked by a downstream load balancer.
 Sidewinder53
on 16 Dec 2020
Sidewinder53
on 16 Dec 2020
FYI - the hotfix for this is rolling out now. You can track the release progress via release announcement 3.0.15193.
mathewc
on 17 Dec 2020
Great, thanks 👍
As an aside to this, is there any way for us to monitor CPU load in our Function app on a Consumption plan? I cannot find it anywhere in the Function App metrics or in App Insights.
Our support contact was able to show us some internal logs, proving that we were hitting 80%+ CPU and triggering these 429s. [HostMonitor] Host aggregate CPU load 81
If it's something we're limited by on the consumption plan, it would be useful to be able to monitor usage and to see if changes we make have any positive impact.
andyblack19
on 17 Dec 2020
Still experiencing the problem here North Europe, pinning the Runtime Version to 3.0.14916 has resolved the issue for now.
Have we any idea how long the roll out takes to complete?
 andrewhollowaybreward
on 17 Dec 2020
andrewhollowaybreward
on 17 Dec 2020
West Europe: the issue is still there
 alexeymarkov
on 17 Dec 2020
alexeymarkov
on 17 Dec 2020
@mathewc Is there a way to monitor the rollout of runtime releases? Given we've been impacted by a few issues in the last year related to new runtime versions, it might be good to have some visibility/traceability on this. I'm not sure how I can go about making sure our function apps are upgraded to this new release when it's available. Would I need to bounce those apps or the service will do that silently behind the scene?
Looks like Canada Central and East haven't received yet the new release.
mathieuisabel
on 17 Dec 2020
The exact stage a release is in currently isn't shared publicly. When we do a release we walk through progressively wider UDs (upgrade domains), starting from UD0. We're currently in UD1 and are planning on moving through UD3 today. We'll move further on Friday, and likely complete early next week.
As far as apps picking up the new version - no we don't forcefully restart any running app instances. However, any new instances spun up will automatically pick the new version when it's available in your region. In Consumption plans instances spin up/down automatically relatively frequently (depending on your app load), so it'll happen pretty quickly. Since this issue mainly only affected Consumption SKU not Dedicated, your apps should automatically pick up the new version.
mathewc
on 17 Dec 2020
I'm about to unpin our function apps so that they pick up the latest version ~3. I'll assume as the release announcement is closed that this has fully deployed?
This issue caused a P2 outage in my company's SaaS platform.
What steps can be put in place to try and prevent this from happening again?
(I'd rather not be manually updating runtime versions, to handle cases where there's a problem with the latest one...)
As an aside to this, is there any way for us to monitor CPU load in our Function app on a Consumption plan? I cannot find it anywhere in the Function App metrics or in App Insights.
Our support contact was able to show us some internal logs, proving that we were hitting 80%+ CPU and triggering these 429s. [HostMonitor] Host aggregate CPU load 81
If it's something we're limited by on the consumption plan, it would be useful to be able to monitor usage and to see if changes we make have any positive impact.
andyblack19
on 19 Jan 2021
It's been almost a week since we went back to ~3.
Everything is fine so far.
cjaferre
on 19 Jan 2021
Related issues
 silencev
·
3Comments
silencev
·
3Comments
 helgemahrt
·
4Comments
helgemahrt
·
4Comments
 paulbatum
·
4Comments
paulbatum
·
4Comments
 shibayan
·
3Comments
shibayan
·
3Comments
 horihiro
·
3Comments
horihiro
·
3Comments
Most helpful comment
FYI - the hotfix for this is rolling out now. You can track the release progress via release announcement 3.0.15193.