Azure-functions-host: Huge number of requests to Service Bus
I have an Azure function that is set up to be triggered when a message lands in a Service Bus topic, does some work and pushes it to a separate Service Bus queue (yes, I have checked to make sure it is not the same one!). This works, so functionally all good.
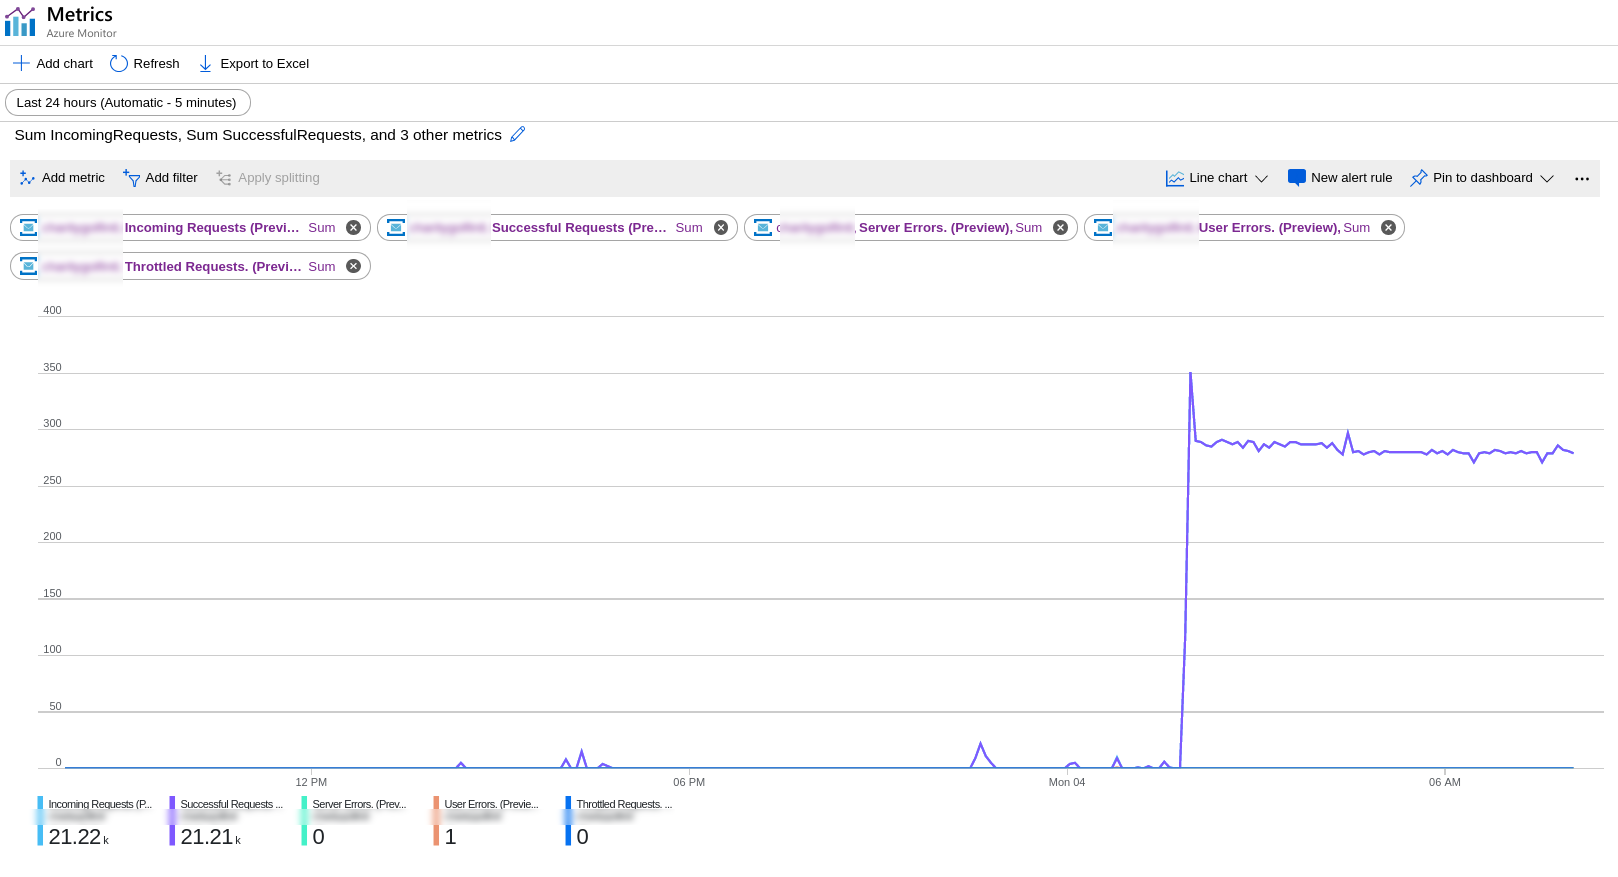
I have switched anything else talking to the SB off and so this is simply running an Azure function that now has a line that outputs "hello" to the log. As shown below, in a 30 minute period I got ~ 22.5k requests (the second requests is a count and there is active connections is a SUM).
Anyone know what is going on? Am i missing something that will be obvious once i know what it is?
The only thing in the middle from my knowledge is Scale Controller.
I have also just ran another test (see last two graphs below) with a new completely empty function (and i did the same two tests against SB with a topic and just with a empty queue that has nothing at all publishing to it ... same results). The dips are when i switched off the Azure functions to try another during debugging.
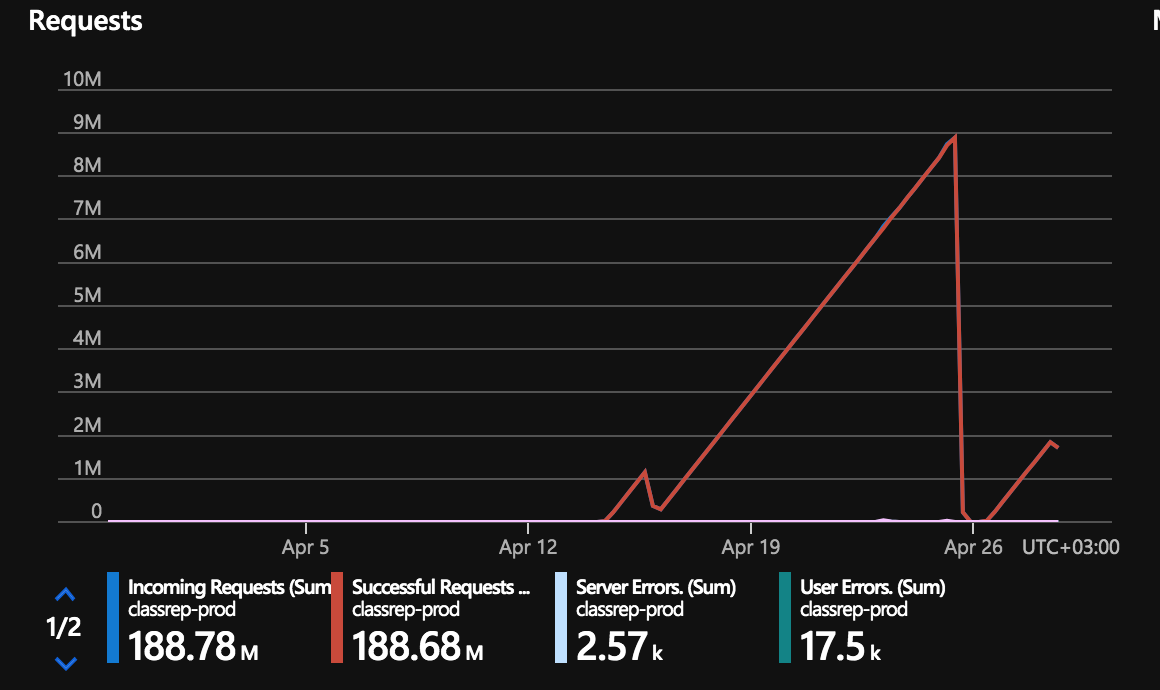
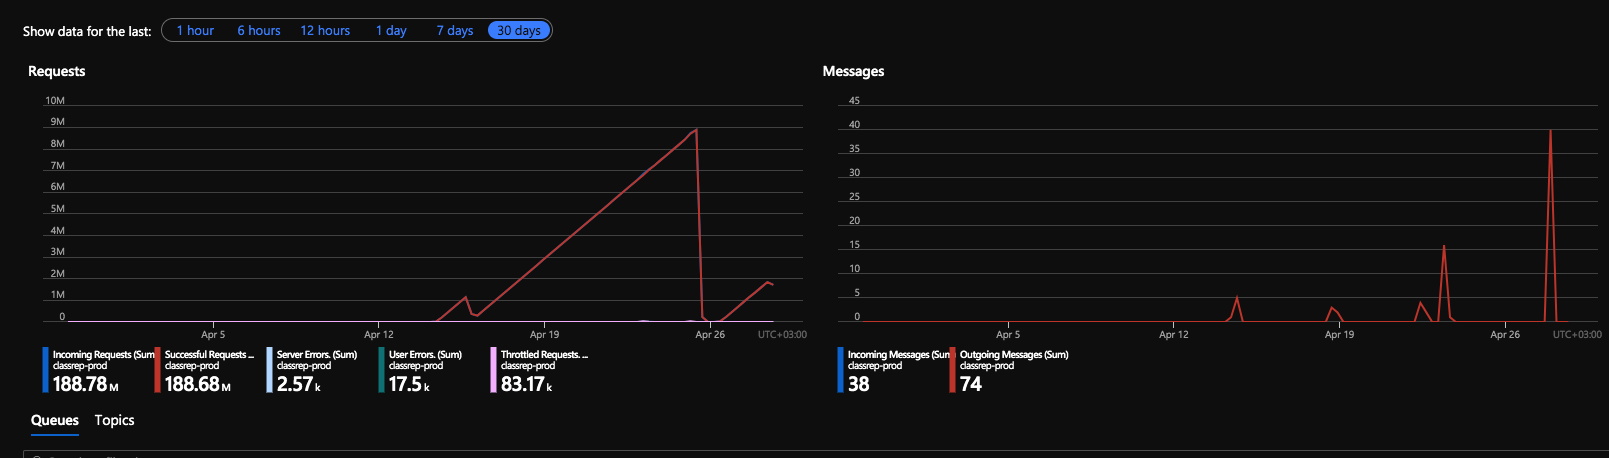
FYIO, I am now at 4.66 million (!) requests for the month and i've hardly done anything with it (i only wish my monthly salary followed a similar pattern). The last graph shows this. I have run some tests over the past few days but nothing major and pretty much zero today at all.
Investigative information
Please provide the following:
Timestamp:
2018-04-20T18:21:55.747Function App version (1.0 or 2.0-beta):
1.0Function name(s) (as appropriate):
TESTServiceBusTopicTriggerCSharp1Invocation ID:
62a6bbe1-3f7f-4e66-b4b5-e9c610532b15Region:
UK South
Repro steps
Provide the steps required to reproduce the problem:
- Start the Function App.
- Start the "TESTServiceBusTopicTriggerCSharp1" function.
Expected behavior
Provide a description of the expected behavior.
The function should run and check service bus [i believe] about every 12 seconds. In any case it should check service bus a certain number of times per minute and hence maybe 360 times in a 30 minute period (please see my note at the foot of this page).
Actual behavior
The requests to Service Bus immediately spike to roughly 23,000 in a 30 minute period. Again this is with a boilerplate function. In fact * any* function I run in that function app that is input bound to ASB has the same behaviour (output binding seems fine). Please note I am not doing anything else against service bus in these tests. Also my diagnostic logs show not errors, not insane requests or anything else to help me debug this. I have had to disable it for now.
Known workarounds
Provide a description of any known workarounds.
Disabling the function stops this behaviour.
Related information
Provide any related information
- C# function
- Single Input binding to a Service Bus queue.
- Only code in the function does the boilerplate log.info() ...
I had ran some tests over the last couple of weeks but nothing major really - those were disabled but the behaviour continues.
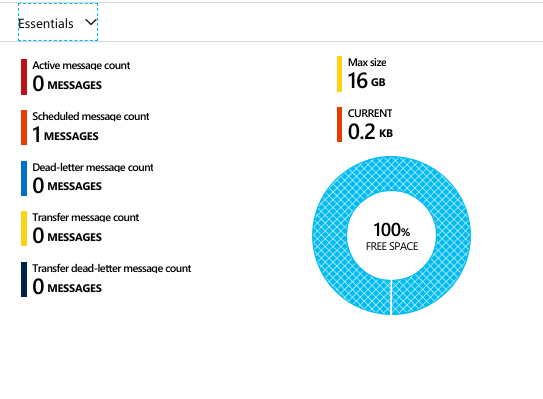
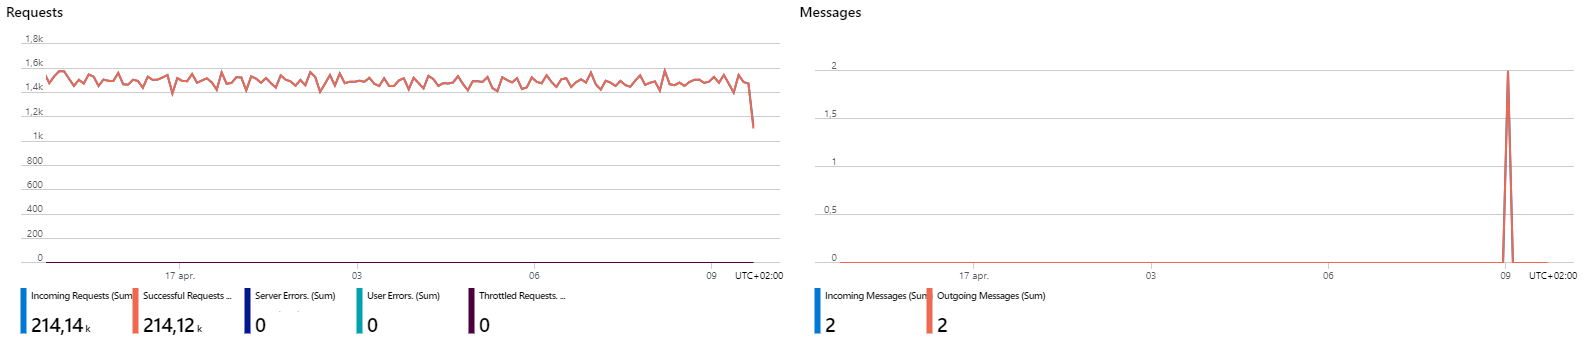
Note - I have replicated this in another function app (using the same service bus queue) and it behaves correctly as below. The numbers still look high but i guess this is just how the binding works.

I know I could just delete the other one outlined above but (a) there may have been an impact on my billing and (b) it is worth knowing what is causing this so it doesn't happen again.
Note that my estimates were for 360 in a 30 minute period and in fact there at 3,000 so I may be missing something from how it does these requests and that in itself would be really useful to know (i am using SUM rather than COUNT on the ASB metrics graph). However this is still 1/10th the number going through the initial problem above. It would be really useful to have some indicative metrics on what we'd typically expect to se with this binding (unless it is already out there and i can't find it) - this would be hugely useful in figuring out billing etc.
I had previously posted this on the msdn forum but this may be a better place for it.
 stevenlivz
All 18 comments
Might be related to https://github.com/Azure/azure-functions-host/issues/2679.
cc @tohling
 paulbatum
on 23 Apr 2018
paulbatum
on 23 Apr 2018
Possibly. Only thing is there are no messages at all in SB, so don't think it could be deferred messages? In fact I created a brand new [empty] queue and added a new function in that same function app and it immediately went crazy. I don't quite know what happens in the middle but not sure why it behaves that way even with a brand new queue that the function was never aware of.
stevenlivz
on 23 Apr 2018
@stevenlivz, I checked out internal logs and it seems that on 2018-04-20T18:21:55.747 (per your recorded timestamp when this issue occured), we did not scale out to any worker because there were no messages in the service bus associated with the Function TESTServiceBusTopicTriggerCSharp1 As a sanity check, used the time-window of +- 2 hours, between 2018-04-20T16:21:55 and 2018-04-20T20:21:55
Could you kindly double check your logs on the ServiceBus side to make sure that the requests to the service bus topic occurred during this 4-hour window for this particular service bus topic? If you have Application Insights set up, you should be able to see the allocated worker count for your Function App as well.
 tohling
on 24 Apr 2018
tohling
on 24 Apr 2018
@tohling Thanks for looking into that. I'm not sure what is happening but the graph below is what i captured just now for that time period. It has the times etc on it which will hopefully help. As you can see it shows ~ 36k requests in a 30 minute time window and 18:21 per the timestamp is in there.

I haven't had to use the SB logs much but i did have some logging on at that point. I attach one of the traces which i hope is useful. I'm really hoping i haven't screwed up the name of the function i gave you but fairly sure i didn't as that particular function was only ever talking to that SB instance (and still does). Slightly confused :-)
Anyway a snippet of around 18:21 is shown below:
        {
             "count": 61,
             "total": 784,
             "minimum": 1,
             "maximum": 48,
             "average": 12.8524590163934,
             "resourceId": "/SUBSCRIPTIONS/56CE49DB-053C-47B2-9554-6B10EFF6B3AC/RESOURCEGROUPS/GLASGOW-LIVE-HELPERS/PROVIDERS/MICROSOFT.SERVICEBUS/NAMESPACES/FNSBTEST",
             "time": "2018-04-20T18:20:00.0000000Z",
             "metricName": "IncomingRequests",
             "timeGrain": "PT1M"
        }
        ,
        {
             "count": 69,
             "total": 797,
             "minimum": 1,
             "maximum": 48,
             "average": 11.5507246376812,
             "resourceId": "/SUBSCRIPTIONS/56CE49DB-053C-47B2-9554-6B10EFF6B3AC/RESOURCEGROUPS/GLASGOW-LIVE-HELPERS/PROVIDERS/MICROSOFT.SERVICEBUS/NAMESPACES/FNSBTEST",
             "time": "2018-04-20T18:21:00.0000000Z",
             "metricName": "IncomingRequests",
             "timeGrain": "PT1M"
        }
        ,
        {
             "count": 64,
             "total": 787,
             "minimum": 1,
             "maximum": 48,
             "average": 12.296875,
             "resourceId": "/SUBSCRIPTIONS/56CE49DB-053C-47B2-9554-6B10EFF6B3AC/RESOURCEGROUPS/GLASGOW-LIVE-HELPERS/PROVIDERS/MICROSOFT.SERVICEBUS/NAMESPACES/FNSBTEST",
             "time": "2018-04-20T18:22:00.0000000Z",
             "metricName": "IncomingRequests",
             "timeGrain": "PT1M"
        }
I didn't have app insights on in the function but i did have the web logs etc on it and it showed no activity. It seems to be behaving now which does't help i guess. Please let me know if there is anything I can help with and thanks for your time.
stevenlivz
on 24 Apr 2018
@stevenlivz, I tried creating a brand new ServiceBus resource and Function with no messages and was unable to repro the issue. Did you have another Function that was using the same SB resource prior to enabling TESTServiceBusTopicTriggerCSharp1 in or around the time of the incident? Just wanting to double-check as we've seen incidents before where some out-of-band console app/Function was consuming the same resource endpoint around the time of the incident.
tohling
on 26 Apr 2018
@tohling I had a few functions on the same function app and when any or them ran the queuing went crazy. My functions had no logs output as they weren't running but something was on their behalf. I had removed others during debugging as i was able to get the same behaviour with just the one and the more there were it seemed harder to track. A different function app against the same queue had no issues.
It is now behaving so my suspicion is something to do with a stuck message or other ... i really don't know. Maybe it's something to put into the watch column as i will be doing a lot in this space in the coming weeks - thanks for your help.
stevenlivz
on 26 Apr 2018
I've been seeing some of the same numbers in our Consumption based Function app (1.0) as well. A 30 day window reports >4 million if I use the Count aggregation, and >14 million if I use the Sum aggregation.
But, selecting Average reports only 3.5 for each 5 minute period. So, I put it down to the Metrics being in Preview, but maybe this is an issue after all...
 bjarnesl
on 7 May 2018
bjarnesl
on 7 May 2018
I have been experiencing the same issue. I initially posted this issue in azure-webjobs-sdk .It is not a problem with metrics I presume, because if the SampleHost project from that repo is used, the metrics are correct.
The MessageReceiver class that is used (from Microsoft.Azure.ServiceBus) should only generate one request per minute. At the moment I have a Function App with 7 ServiceBusListeners and I average about 40 million requests per month ;)
Can it have anything to do with the large number of ServiceFault exceptions that the Microsoft.Azure.ServiceBus library is generating that can be seen when debugging a Function App with ServiceBus triggers?
 mrwatts
on 16 May 2018
mrwatts
on 16 May 2018
@tohling Where are we with a solution for this? Thanks!
 ChristianWeyer
on 5 Oct 2018
ChristianWeyer
on 5 Oct 2018
According to @bjarnesl, it seems like there may be an issue with the Metrics calculation. @ChristianWeyer are you experiencing the same issue? If not, kindly open a new issue with the details of your Function App so that we can investigate.
tohling
on 5 Oct 2018
Thanks. All seems fine on my side. Just stopped by to see whether this is a blocking issue for others.
ChristianWeyer
on 7 Oct 2018
Any updates on this? We are experiencing the same issue. @tohling
 volkancoskun
on 21 Jan 2019
volkancoskun
on 21 Jan 2019
In my case, I have a cloud function triggered by service bus queue (shouldn't have processed anything). Initially, I was trying to get 1 message into the queue to test ScheduledEnqueueTimeUtc in my workflow. When I finally got one in, it spiked and has stayed like that.
 leblancmeneses
on 4 Feb 2019
leblancmeneses
on 4 Feb 2019
We are observing the same issue. A large number of requests with almost no messages
 Magnus12
on 17 Apr 2020
Magnus12
on 17 Apr 2020
Hi, was this solved?
Do you have any news? We are having really big cost spikes and we cannot justify this.
Thanks
 flaviusdemian
on 28 Apr 2020
flaviusdemian
on 28 Apr 2020
@slown1 That volume looks excessively large for sure. Can you please share your function app name? If you have multiple function apps that have triggers based on this service bus namespace, share them all.
If you don't want to share your Function App name or Functions names on GitHub, please be sure to provide your Invocation ID, Timestamp, and Region - we can use this to look up your Function App/Function
paulbatum
on 28 Apr 2020
@paulbatum we do not use azure functions. We have a setup in which we have our web api and web app sending messages to a console application. We also have another class library which can send a message to a topic when some conditions are met. The thing is that we have almost no messages sent and we have millions of incoming requests...I have paid already a few thousands of euro for this and it is clearly not a dev issue.
I can maybe share some code but we really have a basic setup. I can give you our connection string to check it in more details. I think that would help. I could not find anything with ServiceBusExplorer.
Thank you for your help.
flaviusdemian
on 28 Apr 2020
@slown1 You are commenting on an issue in the Azure Functions git repo. If you're not using functions then your problem doesn't apply to what is being discussed here (the impact of requests made to service bus by the Azure Functions scale infrastructure).
@Magnus12 I can have someone take a look at your case, assuming you're using functions. I need the info I mentioned above.
paulbatum
on 28 Apr 2020
Related issues
 krillehbg
·
3Comments
krillehbg
·
3Comments
 silencev
·
4Comments
silencev
·
4Comments
 ElvenSpellmaker
·
3Comments
ElvenSpellmaker
·
3Comments
 slim-souissi
·
3Comments
slim-souissi
·
3Comments
 ahmelsayed
·
4Comments
ahmelsayed
·
4Comments
Most helpful comment
In my case, I have a cloud function triggered by service bus queue (shouldn't have processed anything). Initially, I was trying to get 1 message into the queue to test ScheduledEnqueueTimeUtc in my workflow. When I finally got one in, it spiked and has stayed like that.