Azure-functions-host: Consumption Plan Scaling Issues
I am attempting to measure some performance metrics of Azure Functions and other serverless platforms, and am having trouble getting a test function to scale in a Consumption plan. I am creating a Node.js function that busy-waits in a loop for 1 second, and then exits. Then, I am triggering that function once per second on a new Consumption plan. I continue this request rate for five minutes. Here is a graph of one of these tests, where the vertical axis is the response time minus the function duration (1 second), and the horizontal axis is the number of seconds into the test:

The idea is that a few of these requests come in while the first instance is being assigned to the function, and then the instance tries to play catch-up with the requests (to no avail because the instance is receiving 1 second of work per second). It seems like either these unhandled requests and/or CPU load (from the busy-waiting) on the instance should trigger scaling, but I'm not seeing any additional instances added to the function. Is there something I'm doing wrong here?
Repro steps
Create function app inside an App Service with a Consumption plan
Deploy the following function with an HTTP trigger to the function app:
'use strict';

var id;

module.exports.test = function (context, req) {
  var start = Date.now();

  if (typeof id === 'undefined') {
    id = uuid();
  }

  while (Date.now() < start + req.body.duration) {}

  context.done(null, { body: {
    duration: Date.now() - start,
    id: id
  }});
};

function uuid(a) {
  return a?(a^Math.random()*16>>a/4).toString(16):([1e7]+-1e3+-4e3+-8e3+-1e11).replace(/[018]/g,uuid);
}
- Trigger this function once per second with the following request body:
{
    "duration": 1000
}
Collect the response times of the function under the 1 request per second load for a few minutes.
Observe that the returned id does not change, and the response times are consistently longer than 1 second.
Expected behavior
The first request begins execution somewhere between 4 and 30 seconds (I've been seeing a large range in cold execution response times, is this typical?) after the start of the test, presumably because there were no instances assigned to the function and it takes some time to add the first instance. It seems like a second instance could be assigned to the function in a similar amount of time (at which point the function can complete 2 seconds of work per second), and then the response times will linearly decrease to near 0. Am I wrong about the behavior I suspect, and if so, what should I be seeing scalability-wise?
Actual behavior
Described above. This behavior is contrasted by running the same experiment again, except without any waiting by sending this as the request body:
{
    "duration": 0
}
Which results in a graph with a similar cold start latency, but is easily able to catch up to the requests because they are not causing work:

Known workarounds
Hoping to find one.
Related information
Let me know if you want me to provide any additional information.
 mgarrettm
All 36 comments
Assigning to @davidebbo for response
 lindydonna
on 24 Feb 2017
lindydonna
on 24 Feb 2017
I finally has a chance to look at this. First, thanks @mgarrettm for the very clear steps and report.
Basically, the root of the issue is what you have identified: the function app is not properly scaling out to multiple instances. And since Javascript is single threaded, all the calls end up getting serialized (in the one instance), and it can never catch up.
Generally, the scaling logic in Azure Functions currently works well when the function is triggered by things like queues or Event Hubs, but still need some work to properly handle http. This is particularly true in scenarios like this where the request frequency is very low, but the processing is expensive.
Note that if your scenario had done async work for one second (e.g. outgoing http calls, file i/o, ...), this would not have happened. But I realize that you were deliberately testing the busy wait scenario, as would be seen for things like image processing.
We will work to improve this scenario going forward.
 davidebbo
on 27 Feb 2017
davidebbo
on 27 Feb 2017
Similar, 'scaling out not working' issue in my case.
Mine is c# azure function (http trigger) that refers my compiled c# dll for CPU intensive computation. Tried to load test with JMeter for concurrent users.
Symptoms:
- When I run test in portal, response time for typical parameters is, 2-3 secs.
- When a single user scenario is run with JMeter for same parameters, response time is 2-3 secs
- When 5 concurrent users are set in JMeter with concurrent http requests, average response time grows to (20 secs for cold start) 13 odd secs, i.e. 13 * 5 = 65 secs total. All request receive response with code 200.
- When 20 concurrent users are set in JMeter with concurrent http requests, average response time still grows to 27 odd secs, i.e. 27 * 20 = 540 secs total. All request receive response with code 200.
- When 200 concurrent users are set in JMeter with concurrent http requests, Many requests get rejected (code 500) . Very few (10-15) receive code 200. So no point having average response time.
So, overall, this seems serial operation with load not being handled at the scale of 100 concurrent requests.
My issues are
- Single request gets delivered in 2-3 secs, then why each request in concurrent requests requires increasing time to process? And surprisingly, time increases by order of 10s. This issue should be resolved independent of whether instances are scaled out or not. If serially processed, at least what should happen is, all requests should be delivered in
2 or 3 sec * number of requeststime. - scaling out is also not working to add to above issue, worsening situation further. _I tried to trace whether there are multiple instances being used or not, by using environment variable 'WEBSITE_INSTANCE_ID'. But same value is reported for all requests._
- For concurrent request of the order of 100-200, majority requests get 500 status code
My code is:
#r "MyAPILib.dll"
#r "Newtonsoft.Json.dll"
using System.Net;
using MyAPILib;
using MyAPI.Models;
using Newtonsoft.Json;
using System.Net.Http;
using System.Net.Http.Headers;

public static async Task<HttpResponseMessage> Run(HttpRequestMessage req, TraceWriter log)
{
    log.Info("C# HTTP trigger function processed a request.");

    var mylib = new MyLib();

    // parse query parameter
    string username = req.GetQueryNameValuePairs()
        .FirstOrDefault(q => string.Compare(q.Key, "name", true) == 0)
        .Value;

    // Get request body
    dynamic data = await req.Content.ReadAsAsync<object>();

    var instanceId =
        Environment.GetEnvironmentVariable(
            "WEBSITE_INSTANCE_ID",
            EnvironmentVariableTarget.Process);

    log.Info($"Body read for {username}, instance: {instanceId}");

    var parameters = JsonConvert.DeserializeObject<MyContentProfile>(data.ToString());

    log.Info($"Body deserialized for {username}, instance: {instanceId}");

    var resd = mylib.CPUIntesiveProcessedData(parameters);

    var res = JsonConvert.SerializeObject(resd);

    var result = new HttpResponseMessage(HttpStatusCode.OK);
    result.Content = new StringContent(res);
    result.Content.Headers.ContentType = new MediaTypeHeaderValue("application/json");

    return result;
}
 vinaydate
on 14 Mar 2017
vinaydate
on 14 Mar 2017
@vinaydate that's a variant of @mgarrettm scenario, which today does not work well. The difference with his is that you're using C#, which is multi-threaded. So we end up starting multiple requests at the same time, which ends up blowing up as they're all sharing a core.
Both scenarios are equally valid, and clearly we need to improve them (and we are working on it).
davidebbo
on 15 Mar 2017
I've come across a similar issue with an image processing function. It typically goes from 0 instances to being called ~30 times within a few seconds over an HTTP trigger, each call containing a few MB of images and about 5 seconds of processing workload. This results in most calls failing with Out Of Memory exceptions. My current workaround is to throttle the rate at which the requests are sent, but this loses the benefits of parallelism.
I wonder whether there could be an option to set the maximum number of concurrent function calls per instance? So in use cases where functions are known to be CPU and/or memory intensive, we don't need to rely on a heuristic to spin up enough instances.
Also out of interest, if I used a queue trigger instead of HTTP would the function know not to bite off more than it can chew at once (i.e. avoid the Out of Memory)?
 jamesgurung
on 12 Apr 2017
jamesgurung
on 12 Apr 2017
I wonder whether there could be an option to set the maximum number of concurrent function calls per instance?
Yep, we are adding this very option! See https://github.com/Azure/azure-webjobs-sdk-script/wiki/Http-Functions#throttling for details. This should be available by the middle of next week.
davidebbo
on 13 Apr 2017
I am seeing similar issues with a httpBinding in and a tableStorage out binding.
The performance just isn't there, even on a consumption plan.
 GuyHarwood
on 19 Oct 2017
GuyHarwood
on 19 Oct 2017
I created an Azure Function that busy waits 30 ms. I created a simple load test that creates an http request every 20 ms, for a total of 1000 requests. The results are simply horrible! I see average of almost 30 seconds per request. After limiting the concurrent http requests in host.json to 1 (!) I managed to get to 7-10 seconds per requests. As far as I can tell, scaling does not work at all in my case - I see a single instance ID.
When running the same test with 200 ms delay, I get what I expect: an average of ~190 ms per call.
Is there a workaround to make scaling work with http trigger on consumption plans?
Here is my Azure Function:
static ILogger log;
        [FunctionName("DataQuery")]
        public static async Task<HttpResponseMessage> Run(
            [HttpTrigger(AuthorizationLevel.Anonymous, "post", Route = null)]
            DataQueryRequest dataQueryRequest,
            ILogger _log)
        {
            var stopper = new Stopwatch();
            stopper.Start();
            BusyWait(30);

            var resultObj = JObject.FromObject(new
            {
                Duration = stopper.ElapsedMilliseconds,
                InstanceId = Environment.GetEnvironmentVariable("WEBSITE_INSTANCE_ID", EnvironmentVariableTarget.Process),
            });

            return new HttpResponseMessage(HttpStatusCode.OK) { Content = new StringContent(resultObj.ToString(), System.Text.Encoding.UTF8, "application/json") };
        }

private static void BusyWait(int ms)
        {
            var stopper = new Stopwatch();
            stopper.Start();
            do
            {
                // wait
            }
            while (stopper.ElapsedMilliseconds < ms);
        }
 sinapis
on 30 Oct 2017
sinapis
on 30 Oct 2017
So I stumbled upon this article and thought, well maybe Azure Function can finally scale. I created AF with .Net Core 2, set WEBSITE_HTTPSCALEV2_ENABLED to 1 in app settings and deployed this code to East US region:
[FunctionName("DataQuery")]
public static IActionResult Run(
        [HttpTrigger(AuthorizationLevel.Anonymous, "get", "post", Route = null)]
        HttpRequest req)
        {
            return new OkObjectResult($"Test 123");
        }
I've executed bombardier using this command:
.\bombardier.exe -c 200 -H "Content-Type: application/json" -H "Accept-Encoding: gzip" -d 20s -t 20s -m POST -l https://af-test.azurewebsites.net/api/DataQuery
This is the result I got (after warmup!):
Statistics        Avg      Stdev        Max
  Reqs/sec        53.77      36.58     285.72
  Latency         3.91s      7.16s     29.63s
  Latency Distribution
     50%      1.02s
     75%      2.39s
     90%     16.60s
     99%     28.82s
  HTTP codes:
    1xx - 0, 2xx - 1277, 3xx - 0, 4xx - 0, 5xx - 0
    others - 0
  Throughput:    90.61KB/s
I've deployed the following .Net Core 2 code to AWS East US (Ohio):
        public class Response
        {
            public int statusCode;
            public object body;
            public Dictionary<string, string> headers;
        }

        public Response FunctionHandler(ILambdaContext context)
        {
            var logger = context.Logger;
            logger.Log("Test 123");
            return new Response { statusCode = 200, body = "Test 123" };
        }
Added API Gateway as trigger and executed bombardier:
.\bombardier.exe -c 200 -d 20s -t 20s -m GET -l https://dlfkj3j33.execute-api.us-east-2.amazonaws.com/dev/Test
This is the result I got:
Statistics        Avg      Stdev        Max
  Reqs/sec       753.19     244.87    1947.34
  Latency      263.05ms   195.31ms      3.82s
  Latency Distribution
     50%   212.00ms
     75%   223.01ms
     90%   430.00ms
     99%      1.00s
  HTTP codes:
    1xx - 0, 2xx - 15295, 3xx - 0, 4xx - 0, 5xx - 0
    others - 0
  Throughput:   485.04KB/s
~15x better latency in AWS, and ~15x more requests per seconds.
I'm migrating all of our company Azure Functions to AWS Lambda.
Goodbye Azure Functions, everything was great until I had to scale.
sinapis
on 14 Mar 2018
@sinapis thanks heaps for the repo code! I'm going to give this a try also in our Australian Azure/AWS POP's to see similar things. I'm expecting as such.
Very frustrating re: Azure Functions just not working that great for anything other than simple scenarios.
 PureKrome
on 14 Mar 2018
PureKrome
on 14 Mar 2018
@sinapis @PureKrome please see https://github.com/Azure/app-service-announcements/issues/90. This flag right now gives a preview of the new behavior, which improves from the current situation (which is admittedly bad). But is also much more limited to what you will get once the feature is fully released (about 4 weeks out). At that point, it will reach a level where scale should no longer be a factor in mosr scenarios when deciding between Azure Functions and alternatives.
davidebbo
on 14 Mar 2018
@sinapis would you mind also sharing the test Function App name that you used, and the approximate UTC time of your run? That will help us make sure that it behaved as expected given the current limits on the Preview scale changed. Thanks!
davidebbo
on 14 Mar 2018
@sinapis actually, re-reading what you wrote above, you are using the v2 Preview runtime, which right now does not scale well. That is very likely the primary factor that led to these results. The v1 runtime is the one that is much more optimized and gives good numbers.
You had us a bit worried for a while :)
davidebbo
on 15 Mar 2018
@davidebbo thanks for the reply. Give me an email address and I'll share the function name with you privately. How do I set the V1 runtime?
sinapis
on 18 Mar 2018
@sinapis My email is david.ebbo (at) microsoft.com.
v1 is the default when you create a Function App in Azure. And in Visual Studio, it's a drop down at Function App creation time to choose between v1 and v2 Preview.
davidebbo
on 19 Mar 2018
Just to drop my 2 cents:
Today I did the tests with VSTS load tests, spamming one of our endpoints (HTTP trigger, precompiled C#, running on consumption plan, v1). All tests were conducted from same region as function app.
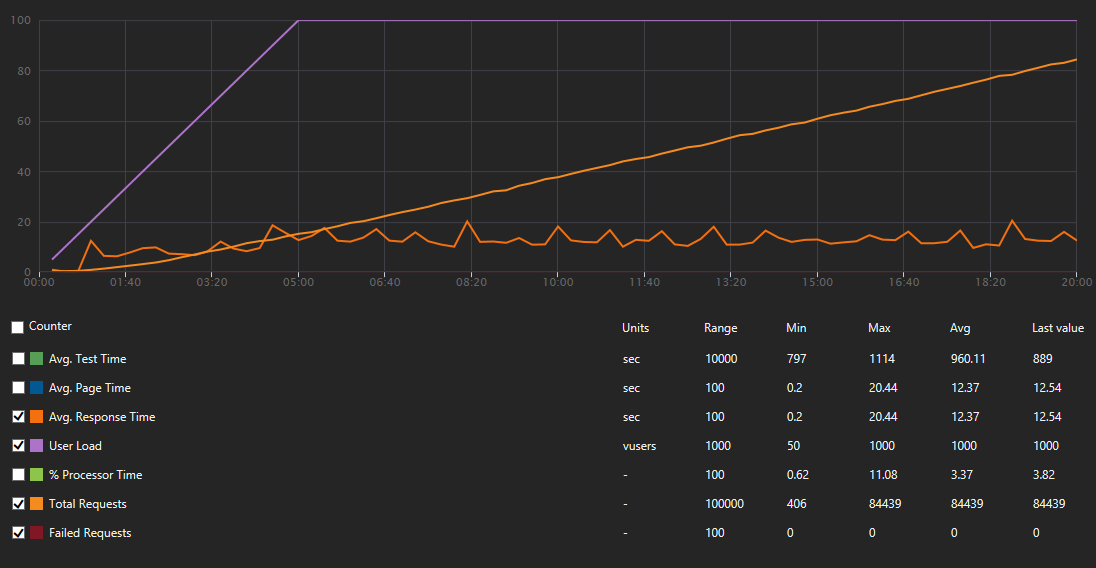
- 1k virtual users (VU), step load pattern with initial 50 VUs with 15s steps of 50VUs with step ramp time of 12s. Test ran for 20min.
- 10k VUs, step load pattern with initial 200VUs with 10s steps of 200VUs with step ramp time of 9s. Test ran for 25min.
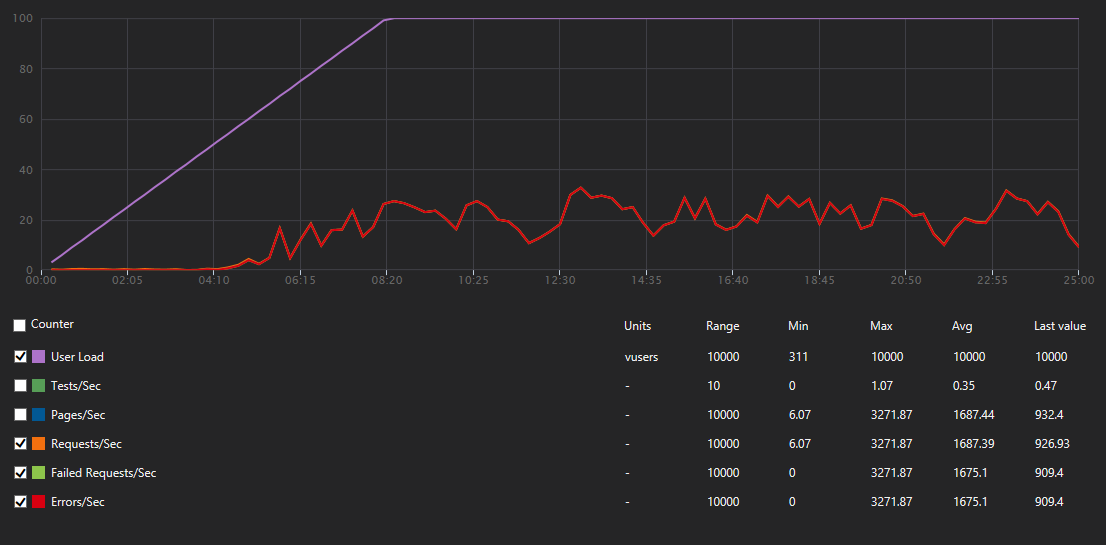
- 5k VUs, step load pattern with initial 200VUs with 10s steps of 100VUs with step ramp time of 9s.
In general this http triggered function is data ingestion endpoint so we simply read content as string and put it on event hub (EH) for further processing. EH has 32partitions, so pretty much maxed out, autoinflation ON.
Results were... gently speaking... disappointing:
Managed to finish without errors, stats as below:
- Avg. response time: 12.4s (min. 0.2s, max. 20.44)
- Requests Per Sec: 70.37RPS (max. 121.27RPS)
- Failed Requests: 0
- Total requests: 84439

Here situation went from bad to tragic circa 3:30 (4200VUs) mark in test, where amount of failed requests more or less aligned themselves with amount of requests, stats as below:
- Avg. response time: 4.8s (max. 88.03s) (error responses are generated quickly ;)
- Requests Per Sec: 1687.39RPS (max. 3271.87RPS)
- Failed Requests: 2512646 (99%)
- Total requests: 2531080
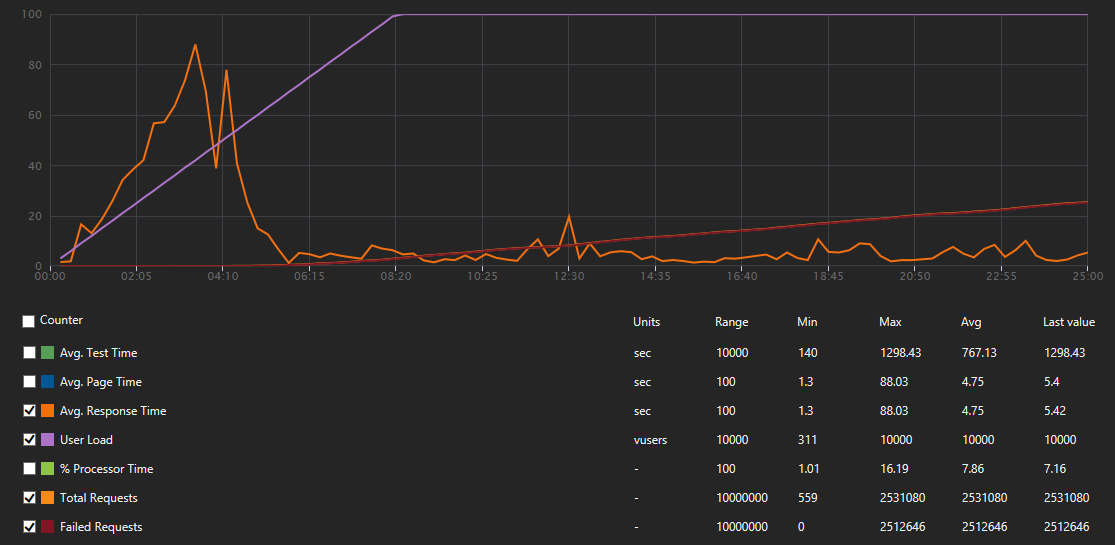
_Here orange and light green are covered by red_
This one was bit different from others as after complete failure in 2nd attempt I did minor research and set
WEBSITE_HTTPSCALEV2_ENABLEDto 1. We ended with such result:- Avg. response time: 77.4s (max. 166.83s) (response times were terrible)
- Requests Per Sec: 43.2RPS (max. 103RPS) (I think that lousy response times had sth todo here, I expected sth like 500-1000RPS but got order of magnitude less)
- Failed Requests: 209 (1%)
- Total requests: 39544


Any help here? Cause with such metrics I'm thinking about conducting ritual harakiri as I was one of those which pushed us on this mine.
 zawor
on 28 Mar 2018
zawor
on 28 Mar 2018
@zawor so your first and second test did not have the WEBSITE_HTTPSCALEV2_ENABLED? Let's ignore those as the new mode is about to become default within another week or two.
For the 3rd, if you provide the app name and approximate UTC time, we can look from our end and analyze what we see. /cc @suwatch
davidebbo
on 28 Mar 2018
Let myself to send you mail on address provided above.
zawor
on 28 Mar 2018
Just found out that I have overlooked proxy function app which wraps all of the apps under one api when setting WEBSITE_HTTPSCALEV2_ENABLED... after applying it there i spawned quick test from my machine and managed to to pull out ~4800RPS from 5kVUs but got plenty of error responses with 401, 503 or WebTest errors complaining about too many redirects, which was not a case before... Will try to repeat that 10kVU test again tomorrow. Anyway if someone will have a look this test from local machine was between 2018-03-28T18:05:13Z and 2018-03-28T18:20:13Z on the app which i have sent you in the mail
zawor
on 28 Mar 2018
@zawor We took a look at the time provided above. We could see 3 distinct sites whose names started with wfl and ended with -20180314. They have regionapi, positions and run in the name respectively.
Could you explain how they are related? Especially, when you load test, were you load test all of them at the same times? From the log, it seemed like
regionapiandpositionsreceived lot of load.One with
regionapiin the site name has HttpsOnly enabled. Unfortunately, we had a bug for HttpScaleV2 where this will cause repeated 301. This bug is resolved in the next release (ETA mid April). To workaround and get going with the test, please temporary disable HttpsOnly.
We have not looked at 503 and 401 - but I suggest you should disable HttpsOnly first, rerun the load tests and provide us the start/end time in UTC for us to analyze.
 suwatch
on 29 Mar 2018
suwatch
on 29 Mar 2018
@suwatch regionapi is proxy function to bind all underlying under one api, so whole incoming traffic goes through it. positions is one which will get most of the beating as it does ingestion of the telemetry traffic. run is simply the thing which usually gets 2 requests in this context, one before and other after, simply to notify guts with metadata that we have start and end of transmission to do its stuff on the fly, post analysis and paper wrapping.
Anyway regionapi probably should be replaced with sth like Application Gateway, but have not done enough of reading to do that switch confidently, so for now it stays (at least till after the Easter).
Thanks for the hint, will run 10kVU test today without HttpsOnly enabled, circa 11:00 UTC. Will leave results and exact time stamps of test when done.
zawor
on 29 Mar 2018
ok so I've made the tests. Initial enthusiasm after 1st test from local machine was obliterated by test result of VSTS Load test.
So to the details:
- Local Test:
- start: 2018-03-29T12:59:16Z
- end: 2018-03-29T13:19:16Z
- spec:
- User Load: 5000
- Duration: 20m
- Pattern: Step
- Initial user count: 100
- Step duration: 10s
- Step ramp time: 9s
- Step user count: 100
- Results:
- Avg. response time: 12.4s (min. 0.2s, max. 20.44)
- Requests Per Sec: 4602RPS (max. 4193RPS)
- Failed Requests: 12123 (0.24%) (where ~1/3 was probably result of connections timing out, rest were 503s)
- Total requests: 5031844
- General impression: Woohoo! Twice as much and we are home
- VSTS test:
- start: 2018-03-29T13:48:52Z
- end: 2018-03-29T14:13:59Z
- spec:
- User Load: 10000
- Duration: 25m
- Pattern: Step
- Initial user count: 200
- Step duration: 10s
- Step ramp time: 9s
- Step user count: 200
- Results:
- Avg. response time: 12.4s (min. 0.2s, max. 20.44)
- Requests Per Sec: 5217.98RPS (max. 6492RPS)
- Failed Requests: 7797111 (99.62%) (1st 39k of errors were 500 and 503 with ratio 3:1, later it simply rfuse to record them)
- Total requests: 7826682
- User Load from execution: 8000
- General impression: Oh man! What the h...?!
- Local Test again:
- start: 2018-03-29T15:03:16Z
- end: 2018-03-29T15:28:16Z
- spec:
- User Load: 2000
- Duration: 25m
- Pattern: Step
- Initial user count: 100
- Step duration: 10s
- Step ramp time: 9s
- Step user count: 100
- Results:
- Avg. response time: 0.46s (min. 0.14s, max. 1.02s)
- Requests Per Sec: 3943RPS (max. 4610RPS)
- Failed Requests: 5898566 (99.72%) (it gave up logging after 10k of 500 and 10k of 503)
- Total requests: 5915179
- General impression: Nice... Really, nice! Dammit!
Help... ;)
zawor
on 29 Mar 2018
@zawor Before we start analyzing, let me try to understand the request flow. When you run a test, you only run against regionapi hostname. This is a proxy which in turn making a HTTP call to positions. Are they 1-to-1 relationship (meaning one request to regionapi will make one request to positions)? The proxy also calls run twice for every requests? Looking at the total requests from our ends, it does not seem to represent that. If I misunderstood completely, do write/share flow simple chart.
I also suggest to start with lighter load (let say User Load of 500) to get a stable baseline functionality before increasing to a higher magnitude?
As for 500 error on the your VSTS run. Seems to be 404 talking to table storage. Is the Accumulator class part of your function? Might be something wrong with Table storage?
Microsoft.Azure.WebJobs.Host.FunctionInvocationException : Exception while executing function: FinishRun ---> System.AggregateException : One or more errors occurred. ---> The remote server returned an error: (404) Not Found. ---> The remote server returned an error: (404) Not Found.
   at System.Threading.Tasks.Task.WaitAll(Task[] tasks,Int32 millisecondsTimeout,CancellationToken cancellationToken)
   at Accumulator.FinishRun.Run(RunFinishedMessage runFinishedMsg,CloudTable latestPositionsTable,CloudTable userLocations,ExecutionContext ctx,ILogger log)
   at lambda_method(Closure ,FinishRun ,Object[] )
   at Microsoft.Azure.WebJobs.Host.Executors.VoidMethodInvoker`2.InvokeAsync(TReflected instance,Object[] arguments)
   at async Microsoft.Azure.WebJobs.Host.Executors.FunctionInvoker`2.InvokeAsync[TReflected,TReturnValue](Object instance,Object[] arguments)
ok so 1st, the image, simplified and only parts you mentioned:
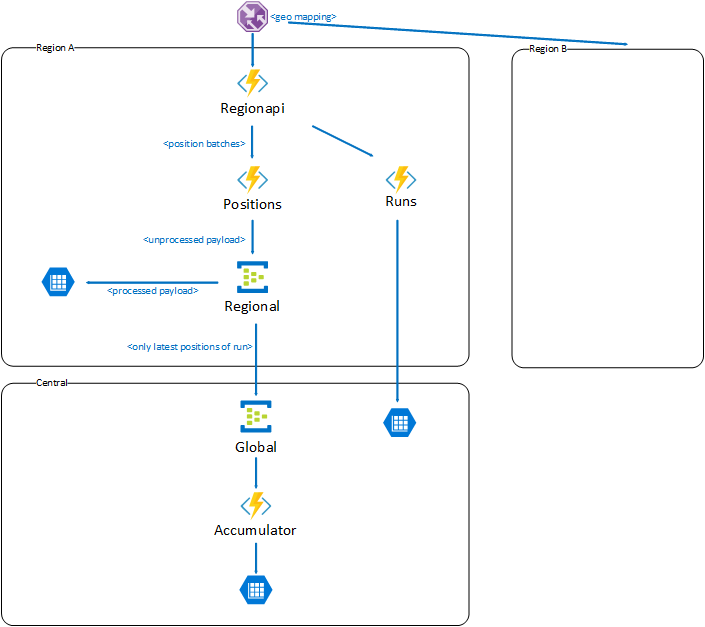
and now story behind, initial version of my plan looks like this:
We are preparing for multi region deployment. Entire traffic is steered by Traffic Manager with Geo-mapping to proper regions. HTTP traffic hits regionapi which is Function App with nothing more than Proxies defined (you know, the thing which is offered as a part of Azure Functions bundle) and serves role of front facing api for given region. It maps simply some urls to given Function Apps beneath like runs or positions. So unless Proxies hide some dirty tricks, with doing one request to the api (regionapi) you should end up with one request on one of the Function Apps sitting under it.
So now scenario:
Mobile clients do runs with positions. They start with sending one request _start run_ which ends up hitting runs (but goes through regionapi). Hendler (HttpTrigger) of _start run_ takes it and puts it on the storage queue which will trigger some machinery in the guts of the region.
After that mobile clients start to send positions in batches in for of request once a while, which hits positions (but goes through regionapi). There without much of processing (actually we read content as string and don't process it anyhow yet). and put it on EventHub from which it will be taken by few consumers (EventHub Triggers). One will store it those in local Storage Table, other will take a batch, extract only latest position and passes it to global EventHub to be consumed by accumulator but it has nothing to do with handling incoming traffic. 404s there from storage table are completely unrelated here and are result that some data should be deleted on run end but was not prefilled so on delete from Table Storage we get 404 in return. Accumulator in our test may appear as bit hit by traffic but it is result of test scenario data which simply has single position in the batch so that it end up always updating latest position, but again it should have nothing to do with ability to handle traffic as it is behind 2 event hubs in completely different function app buried deep down in the guts of the system.
Finally when mobile clients decide that run has ended they send _end run_ request which ends up hitting runs (but goes through regionapi). Handler (HttpTrigger) of _end run_ takes it and puts it on the storage queue which will trigger some machinery in the guts of the region doing post run analysis, archivization, etc...
Anyway (correct me if i'm wrong) positions as separate FunctionApp scales independently from others so incoming HTTP traffic should only affect it, doing ingestion of incoming traffic through EventHub without immediate processing should only make things batter as we don't waste time on processing and other fancy stuff till we respond.
If sth is unclear simply write. If you need any further details about internals of the system or our business case I opt for moving our discussion on some less public field than GitHub.
zawor
on 30 Mar 2018
Thanks for the details explanation!
Anyway (correct me if i'm wrong) positions as separate FunctionApp scales independently from others so incoming HTTP traffic should only affect it, doing ingestion of incoming traffic through EventHub without immediate processing should only make things batter as we don't waste time on processing and other fancy stuff till we respond.
Correct, Each FunctionApp will scale independently.
Right github may not be appropriate to going into details very specific to your works. Feel free to send email to me to continue our conversation (suwatch @ microsoft.com).
suwatch
on 30 Mar 2018
@suwatch If this convo is taken offline (which is totally fine) could we (the public) please get some info to any solutions/resolution/bugs/not-fixing etc .. to the issue. It's _very_ interesting and I've been following it, intently.
PureKrome
on 31 Mar 2018
Will sure do.
suwatch
on 31 Mar 2018
I'd like to know the outcome of this as well.
 steve-warren
on 31 Mar 2018
steve-warren
on 31 Mar 2018
I'm using WEBSITE_HTTPSCALEV2_ENABLED option in my CPU intensive function (v1 deployed in West Central US). When executed for the first time it takes between 4 and 20 sec to respond. After that with low load (smaller than 1 req per 2 sec) I get consistent 2 sec responses. When I'm running load tests from VSTS (20 users) I'm getting average times time of response in range of 11-15 sec.
My objective is to get lower response number during scale out even at the cost of some requests failing. I've being trying to figure out if http settings in host.json defining host concurrency and request queue length can help here. Can you provide any guidance and explain more how scale controller behavior is influenced by those settings?
 tmasternak
on 3 Apr 2018
tmasternak
on 3 Apr 2018
@tmasternak mind opening another gissue to discuss specifically about this cpu-bound function?
suwatch
on 3 Apr 2018
To update the thread, last conversation with @zawor, I was using simple WCAT against the site using @zawor's suggested payload. The results (2 iterations) were 2K RPS with 500 concurrent users. There was issue with during start up causing 500/503 tracked by #2650.
@zawor did you have any chance to repeat the run since our conversation a week back? Anyway, do share us the result/experience if you do.
suwatch
on 16 Apr 2018
@suwatch I will run some tests today maybe tomorrow not quite sure when, time will show... anyway for sure will be back with results when done
zawor
on 17 Apr 2018
Azure Function (Node.js) often returns ECONNREFUSED
Update: I now see that Linux Consumption Functions are in preview. I will look for a better place to submit this feedback.
I have filed https://github.com/Azure/azure-functions-host/issues/4378
~ ~ ~ ~
The function works fine most of the time. But testing with single threaded requests one immediately after the next sometimes results in a ECONNREFUSED error.
The rate of these errors so far is 6 ECONNREFUSED errors for 56 HTTP POST attempts. Not good.
Are there any switches or settings I should check?
Is this expected behavior? I'm happy to share my code.
Details
I set up a new Azure Function App for Node.js. It's using the WestUSLinuxDynamicPlan (Consumption) plan.
My Node.js function is triggered via HTTP. It creates a Service Bus message from the HTTP call's payload. That's it.
 LarryKlugerDS
on 2 May 2019
LarryKlugerDS
on 2 May 2019
Hello @suwatch and @zawor, it looks like our expanded concurrency controls make it possible to close this issue?
This thread is causing a bit of confusion, and if we've mitigated the initial issue at the top of the thread I'd love to close this out and keep tracking all of the issues that have forked off of this one in their own threads.
 alexkarcher-msft
on 6 Aug 2019
alexkarcher-msft
on 6 Aug 2019
when it comes to me I'm fine with closing...
PS, for those which wanted to see retest results: i forgot about posting them and now i'm unable to find them (even though only to historical reasons)... :P sorry
zawor
on 7 Aug 2019
Awesome! It's been a wild 2.5 years in this thread 🙌🙌. Feel free to open a new thread and reference this one if this issue crops up again.
alexkarcher-msft
on 7 Aug 2019
Related issues
 rati3l
·
3Comments
rati3l
·
3Comments
 shibayan
·
3Comments
shibayan
·
3Comments
 ElvenSpellmaker
·
3Comments
ElvenSpellmaker
·
3Comments
 mathewc
·
3Comments
mathewc
·
3Comments
 JasonBSteele
·
3Comments
JasonBSteele
·
3Comments
Most helpful comment
Yep, we are adding this very option! See https://github.com/Azure/azure-webjobs-sdk-script/wiki/Http-Functions#throttling for details. This should be available by the middle of next week.