Azure-functions-durable-extension: Long delay in processing control queue items for Durable entities
Description
Hi - I'm not sure but I think we're seeing this behavior described in #344 in our Functions App. For reference, we're on Consumption plan - but can likely move to Premium if this is the root cause. I just wanted to confirm what I'm seeing.
To set up, we have an Azure Function that is using a batching, session-enabled ServiceBusTrigger. The Function signals a Durable Entity to aggregate the messages. This is intended to be a high-throughput function. The service bus queue flushes pretty quickly thanks to batching but there are thousands of messages sitting in the control queue.
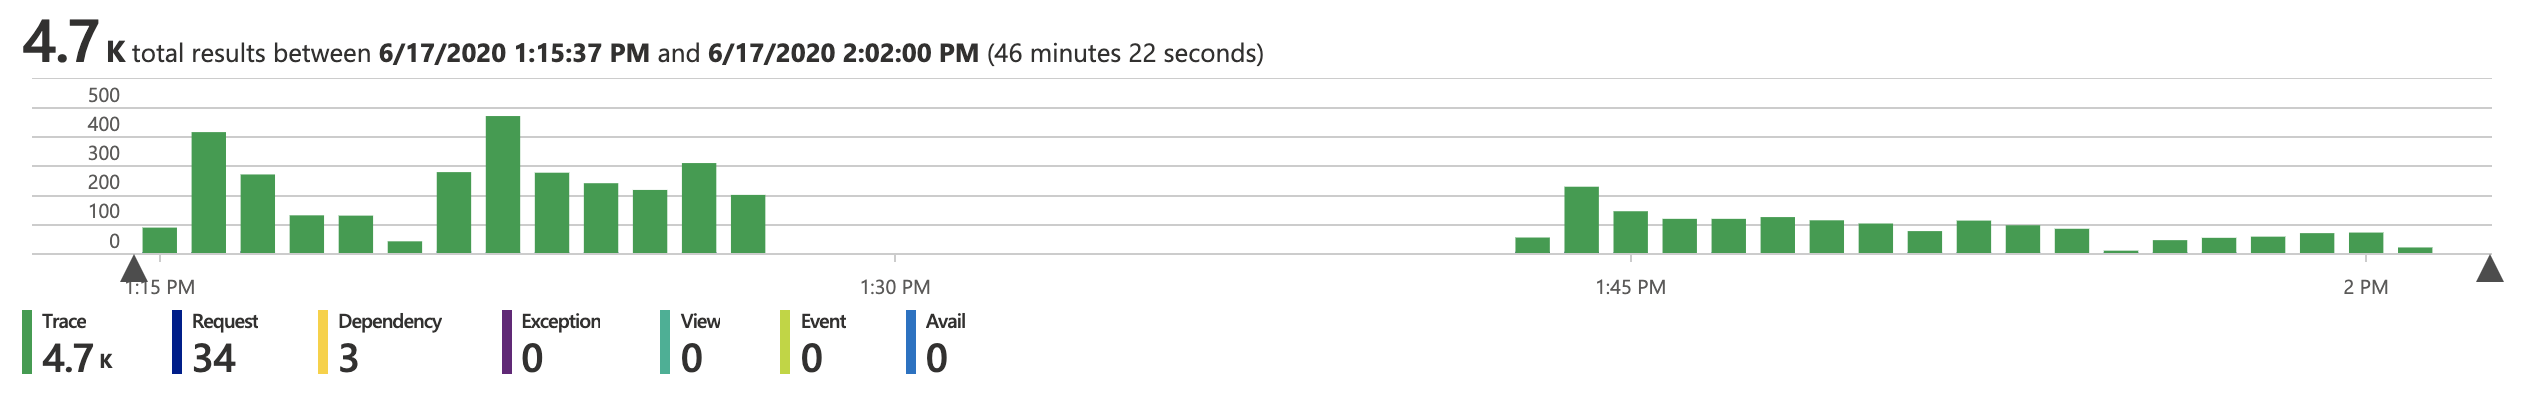
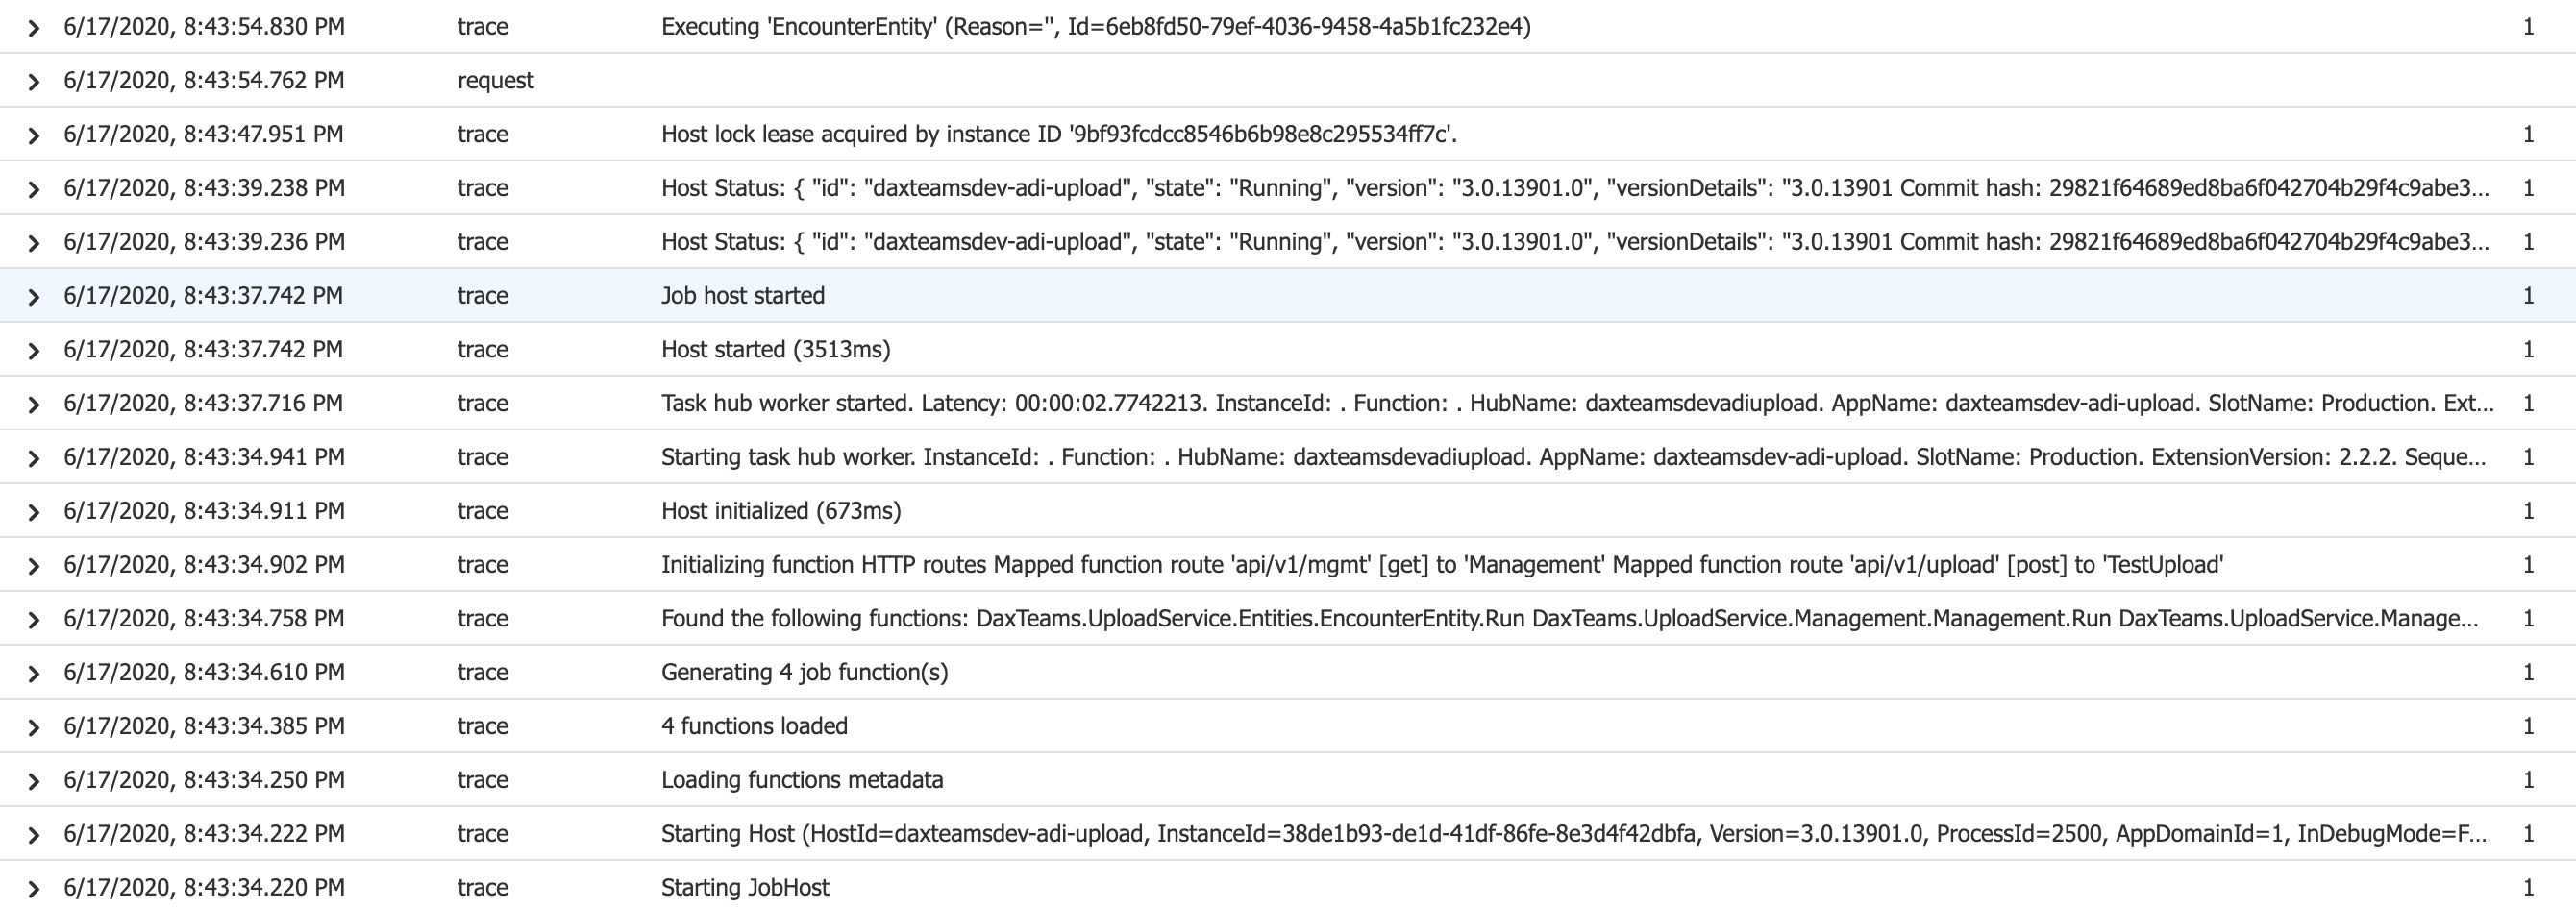
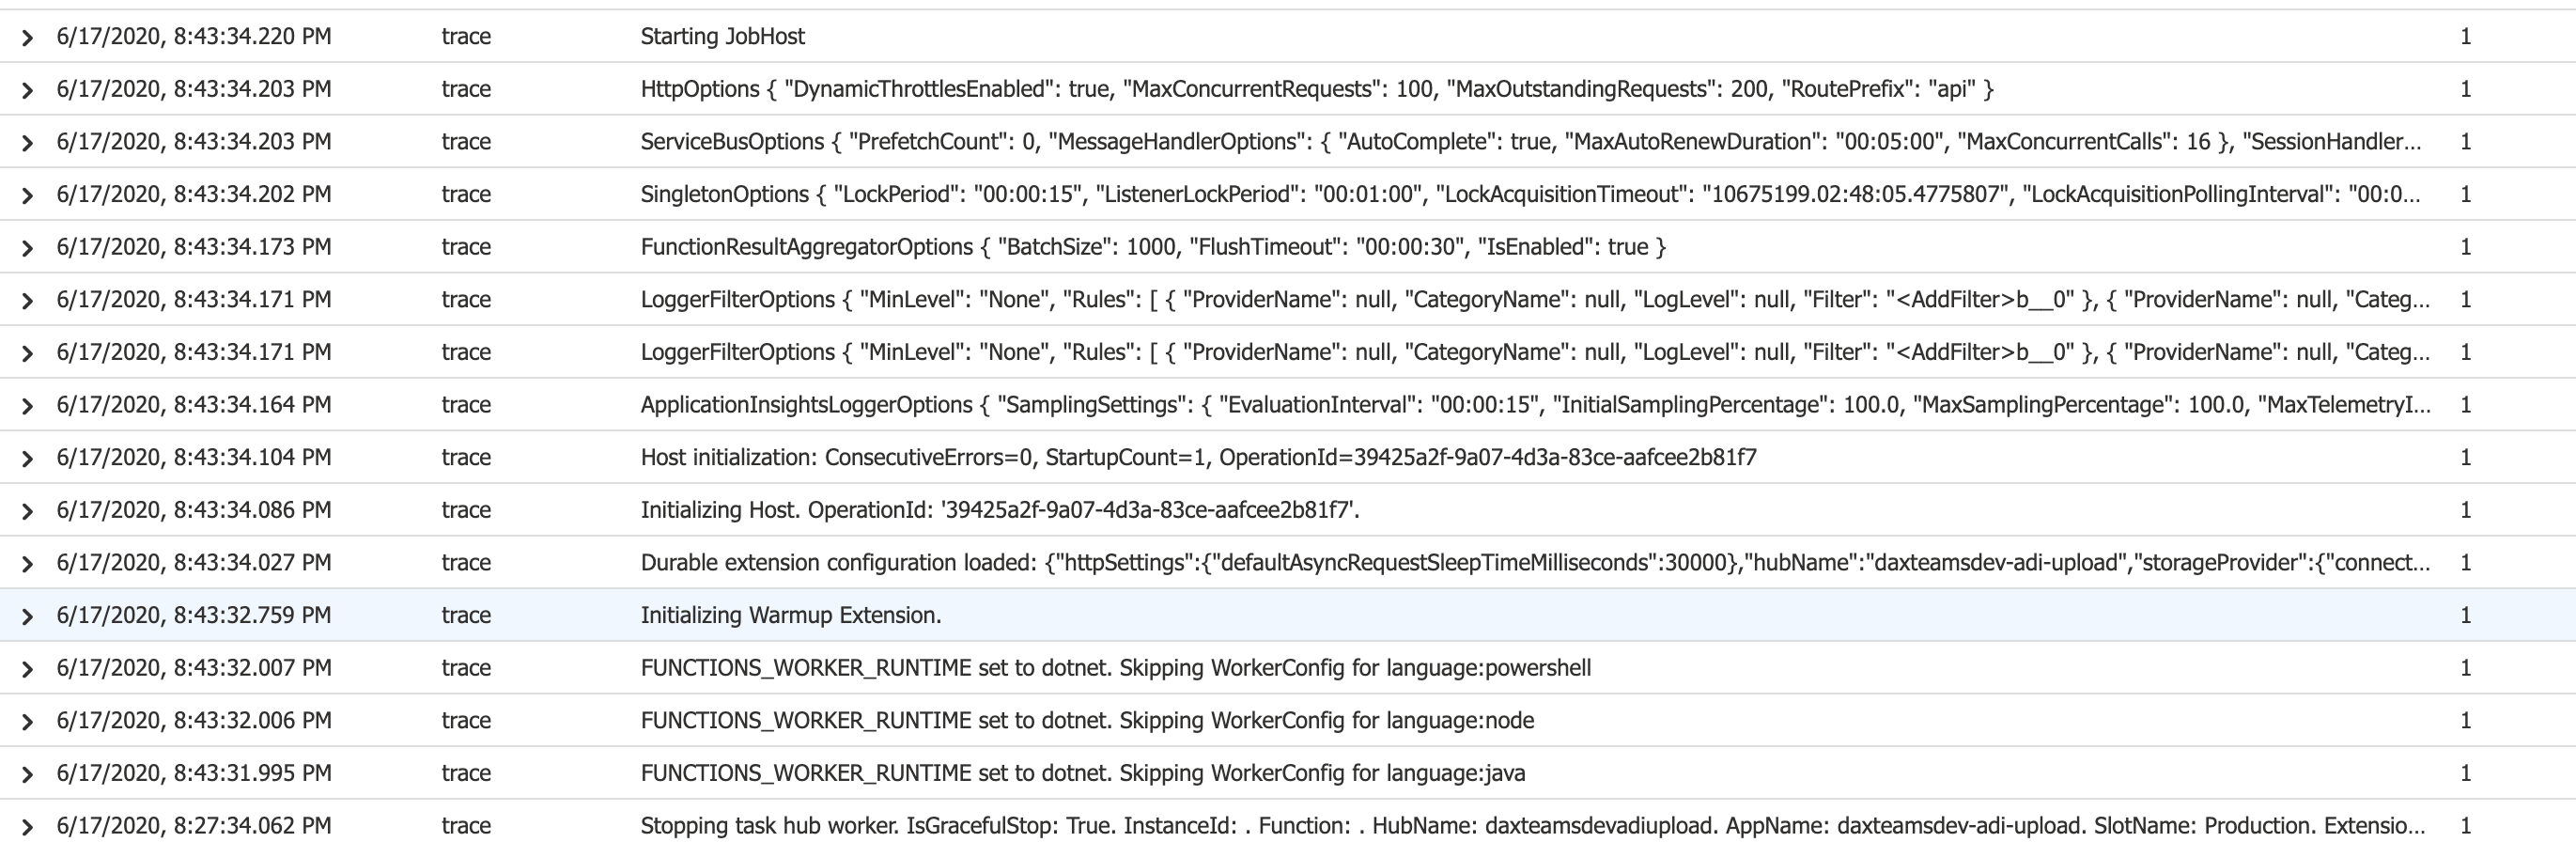
If we have hundreds of thousands of messages being sent through Service Bus and then that number dwindles to a few hundred, Azure Functions starts scaling in and eventually all workers get removed even though there are thousands of items waiting in the control queue. Occasionally, a worker starts up, processes a few hundred messages, and then stops. You can see in the bottom entries in this 2 page log that there is a big gap of time (15+ minutes) between when the task hub worker stops and the function job host / task hub worker start up and start executing the entity.
Do you know if this behavior that we're seeing is because we're on the Consumption plan? Or is it something different/inherent with Durable Entities?
Thanks in advance for any help you can provide here.
Expected behavior
I would have expected a task hub worker to remain started, and process the remaining control queue messages quickly
Actual behavior
A worker occasionally starts up, processes a few hundred messages, and then stops for a few minutes
Relevant source code snippets
This is our host.json:
{
  "version": "2.0",
  "extensions": {
    "durableTask": {
      "extendedSessionIdleTimeoutInSeconds": 30,
      "extendedSessionsEnabled": true,
      "useGracefulShutdown": true
    }
  },
  "functionTimeout": "00:10:00",
  "logging": {
    "logLevel": {
      "default": "Information"
    }
  }
}
Known workarounds
If I restart the Function app, a worker starts up, processes a few messages, but then stops. We haven't tried switching to premium plan yet
App Details
- Durable Functions extension version (e.g. v1.8.3): v2.2.2
- Azure Functions runtime version (1.0 or 2.0): 2.0
- Programming language used: C#
If deployed to Azure
We have access to a lot of telemetry that can help with investigations. Please provide as much of the following information as you can to help us investigate!
- Timeframe issue observed: 6/17/2020 1:26:30 PM to 6/17/2020 1:43:55 PM
- Function App name: daxteamsdev-adi-upload
- Function name(s): ProcessAudio
- Azure region: westus2
- Orchestration instance ID(s): @encounterentity@4f1f1300-4c1f-4be4-8740-fbcbbd99d8fc
- Azure storage account name: daxteamsdevadiupload
If you don't want to share your Function App or storage account name GitHub, please at least share the orchestration instance ID. Otherwise it's extremely difficult to look up information.
 adiun
adiun
All 18 comments
Tested this out last night and we're seeing this on Elastic Premium (EP2) plan as well.
This seems to be happening primarily when there's a spike in usage that immediately drops off. If the drop-off in usage is gradual it seems the workers will process everything faster.
adiun
on 18 Jun 2020
@adiun I’m not sure if this is relevant, but I notice that you are using extended sessions.
What happens if you don’t use extended sessions? Do you get the same problem?
 olitomlinson
on 19 Jun 2020
olitomlinson
on 19 Jun 2020
@adiun another thing to try would be to remove the useGracefulShutdownsetting. it appears to be in preview so its worth a shot.
 mpaul31
on 24 Jun 2020
mpaul31
on 24 Jun 2020
Thanks all - Sorry for the delay. I have some new data:
Context
For some context, we are using Durable Entities to do store+forward of audio from online meetings. We record audio at 50 fps, where each frame is 20ms.
We have a separate recorder service sending each frame immediately to service bus (no send batching yet). So a 15 minute meeting is 45k messages.
A ServiceBusTrigger'd Azure Function consumes these messages, using batch and session capabilities, then sends the entire batch directly to a durable entity corresponding to the meeting where we quickly add each message in the batch to a list. After the meeting ends we do some more expensive processing on it.
Updates
Since I filed this issue we moved to AzFunc ElasticPremium2 plan + Service Bus Premium with messaging units = 2. The infra works well with spikes - many concurrent short meetings. For example, 100 concurrent 5 minute meetings: with durable entities this system drains all calls in about 2 minutes.
New Azure Functions App Name: daxteamsdev-adi-uploadprem
We're seeing this problem with soak scenarios: 10 concurrent 20-minute calls.
Important Note:
- On standard tiers for AzFunc/ServiceBus, we were seeing many periods of time when control queues were not being processed.
- On premium tiers, although we are still seeing this, those delays are few/far between. However control queues are being processed very slowly as the data below indicates.
host.json
This is the base host.json. I added autoComplete: false for the sessions and closing the session after processing a batch; the thinking was for batches in a long-running session, we can allow other function instances to compete for batches in the same session.
{
  "version": "2.0",
  "extensions": {
    "durableTask": {
      "storageProvider": {
        "partitionCount": 16
      }
    },
    "serviceBus": {
      "sessionHandlerOptions": {
        "autoComplete": false
      }
    }
  },
  "functionTimeout": "00:10:00",
  "logging": {
    "logLevel": {
      "default": "Information"
    }
  }
}
No extended sessions
- Here, the last outgoing message left from ServiceBus at 8:30pm.
- The last meeting's durable entity gets its last batch at 11:50pm.
- Durable entity id for last-drained meeting:
@encounterentity@4f1f1300-4e1f-4200-9608-2086d0f71fb6
No graceful shutdown and no extended sessions
- Last outgoing message left from ServiceBus at 11am. (the last meeting actually ended at 10:57am)
- Here are a few initial data points - will update as it finishes:
- Meeting ended 10:36, drained at 11:02 (26 minutes)
- Meeting ended 10:38, drained at 11:13 (35 minutes)
- Meeting ended 10:40, drained at 11:23 (43 minutes)
- Meeting ended 10:44, drained at 11:44 (56 minutes)
- Meeting ended 10:57, drained at 12:21 (24 minutes)
- Note this is actually the last meeting. At 12:21 we haven't drained all of the meetings though.
Hope this is enough additional information. Will update with additional findings but please let me know if there's any flaw in my logic or if we're not doing things in an optimal way.
adiun
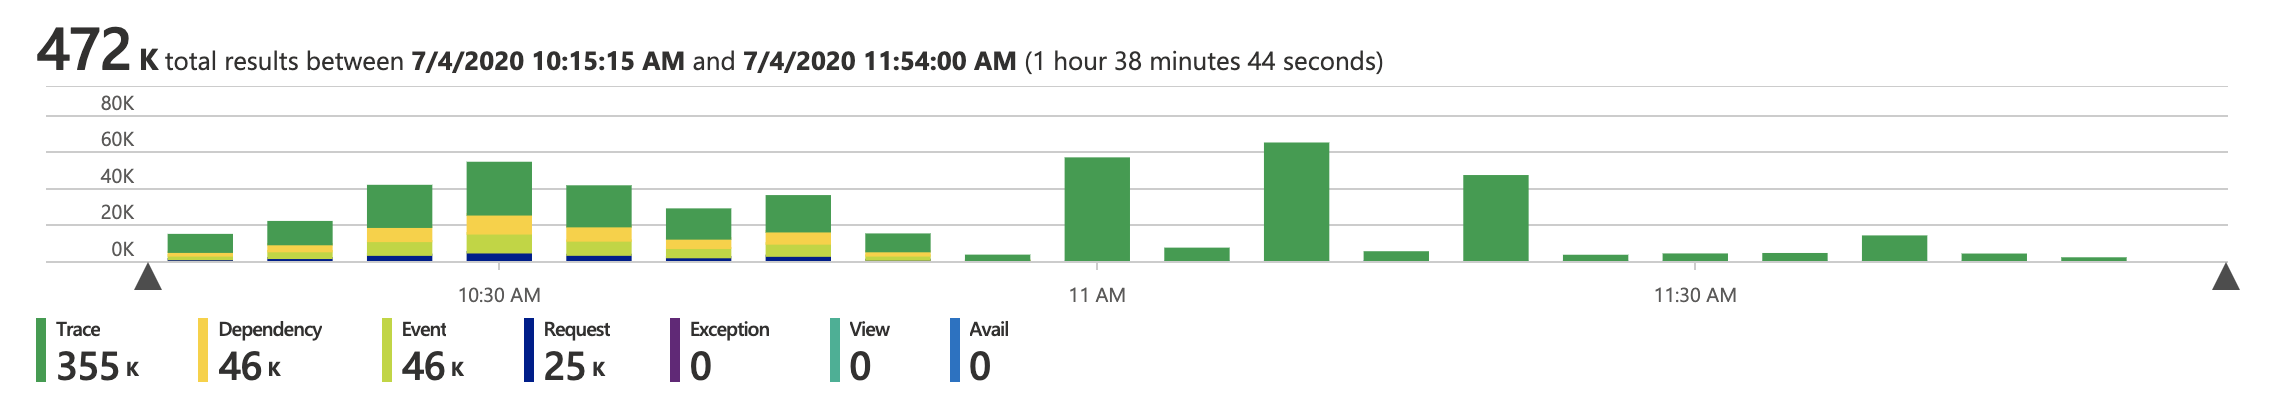
on 4 Jul 2020
@cgillum wanted to ping on this thread again - do you have any recommendations for mitigation/diagnosing here? We are seeing this behavior consistently for long meetings. Note again that I am on EP2 plan, fixed number of instances (to avoid split brain issues).
I'm considering adding client-side batching to service bus so that more data is processed on each entity signaling.
Here's a run going on right now - throughput decreases dramatically and the meeting takes hours to process - this will ultimately be a product blocker for us.
@olitomlinson I noticed you filed a few issues that seem similar to this - any ideas here?
EDIT:
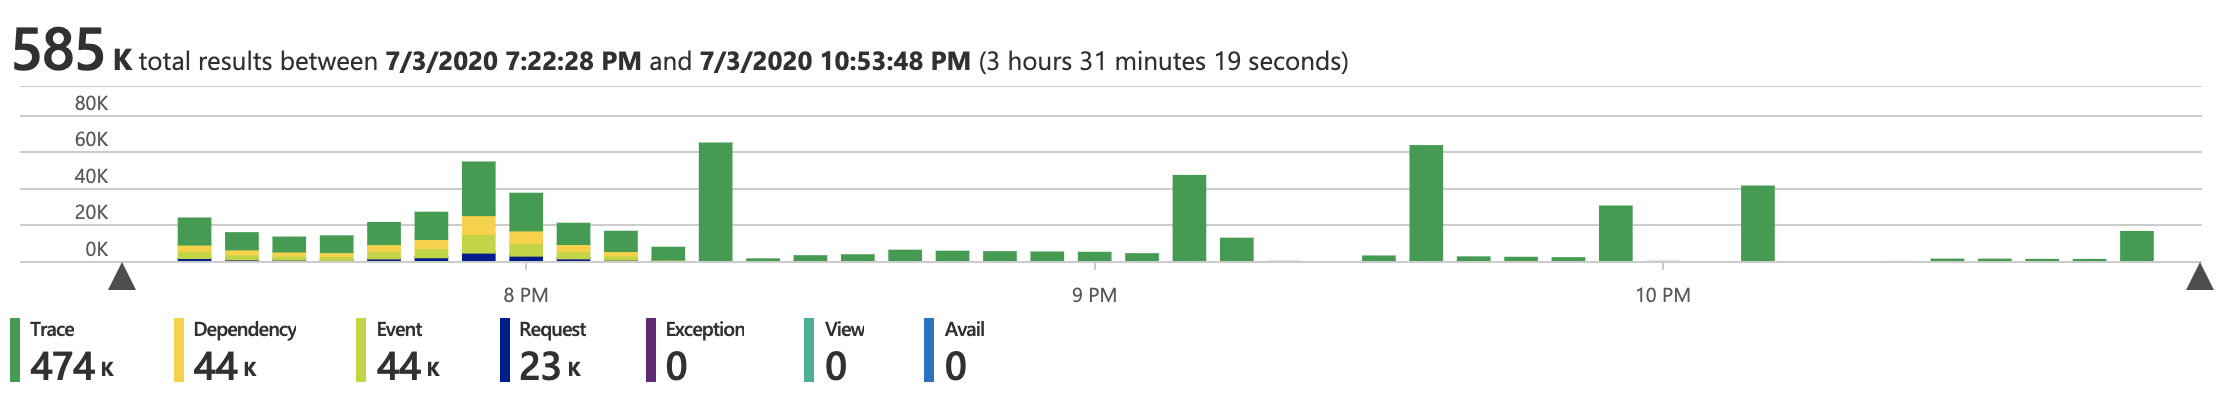
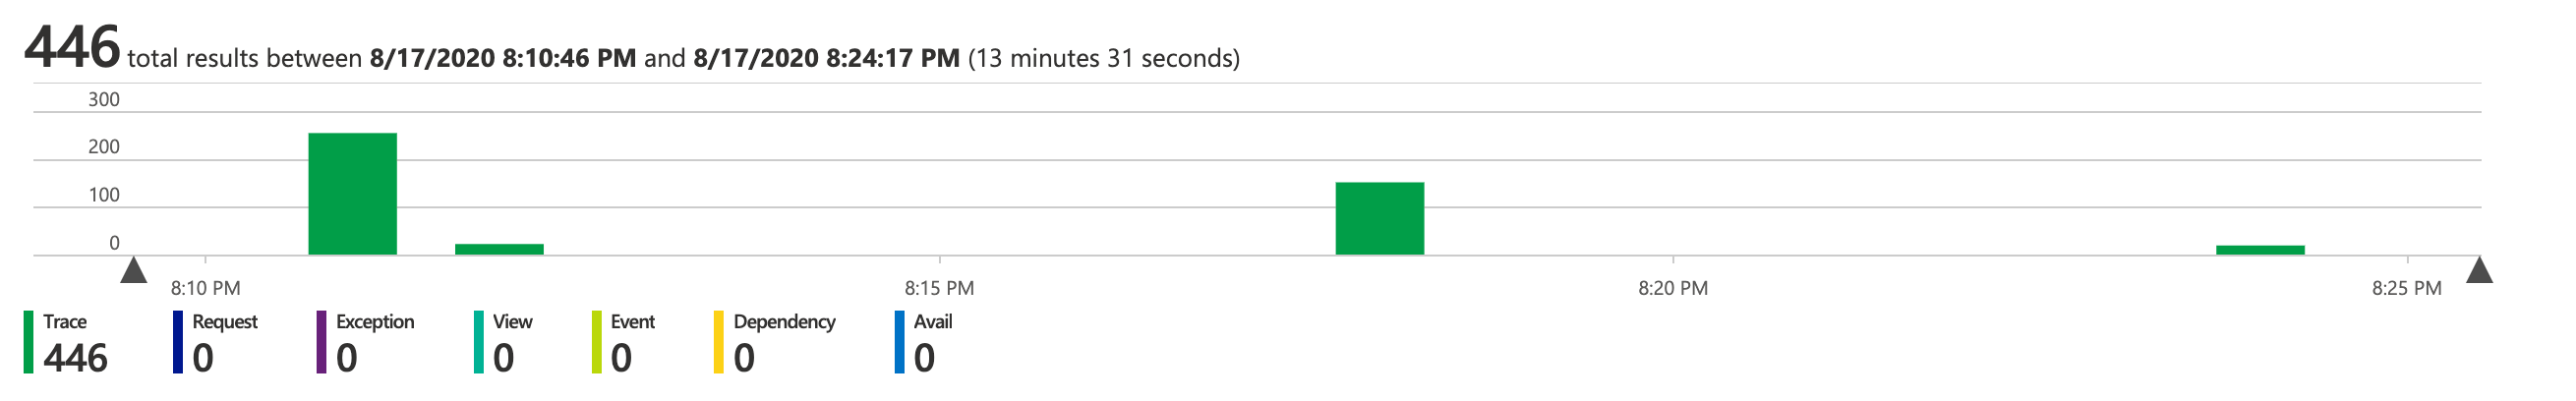
Here's a very specific interesting case:
Orchestration instance ID: @encounterentity@4f1f1300-421f-4f5b-bc11-79b3d37cf1e8
Around 8:17:33 PM PST is when the last SignalAsync call was made. At this point there are thousands of pending signals.
Between 8:18:51 PST and 8:24:11 PST, this Durable Entity did not process any signals.
The Entity started processing signals at 8:24:11.
There are minutes of idle time between processing, as this indicates:
adiun
on 18 Aug 2020
@adiun yes it is similar. I’m hoping that the new Partition Management strategy will improve the situation, I believe it should be available soon!
olitomlinson
on 18 Aug 2020
Thanks @olitomlinson - Reading through the Partition Management proposal I can see how it resolves split brain issues but it's less clear to me how it addresses these idle time/delay issues. Could you elaborate on that?
adiun
on 18 Aug 2020
@adiun curious but have you tried lowering the partitionCount to see if this makes any difference? i wonder if something is going on when the scale controller add a bunch of instances to handle the load and when the get removed things start to stall. just a thought..
mpaul31
on 18 Aug 2020
@mpaul31 Thanks, I tried lowering the partitionCount to the number of instances (5) but still seeing the same issue. By the way, I'm on EP2 for now but because of split brain issues I'm keeping the number of instances constant at 5. When I initially filed this issue I wondered if the scale controller was incorrectly scaling in, possibly because it was only taking into account the service bus queue. But even with a fixed number of instances I'm seeing this issue.
adiun
on 19 Aug 2020
@olitomlinson looks like you were right...
@cgillum, @ConnorMcMahon I just tried 2.3.0 with the useLegacyPartitionManagement: false flag and ran through the same scenario as before (10 concurrent 20-minute meetings).
This is a huge improvement:
Before (span of 4 hours):
- The last outgoing message was completed in ServiceBus at 8:30pm.
- The last meeting's durable entity gets its last batch at 11:50pm.
- Minutes of idle time
Complete drain: ~3.5 hours
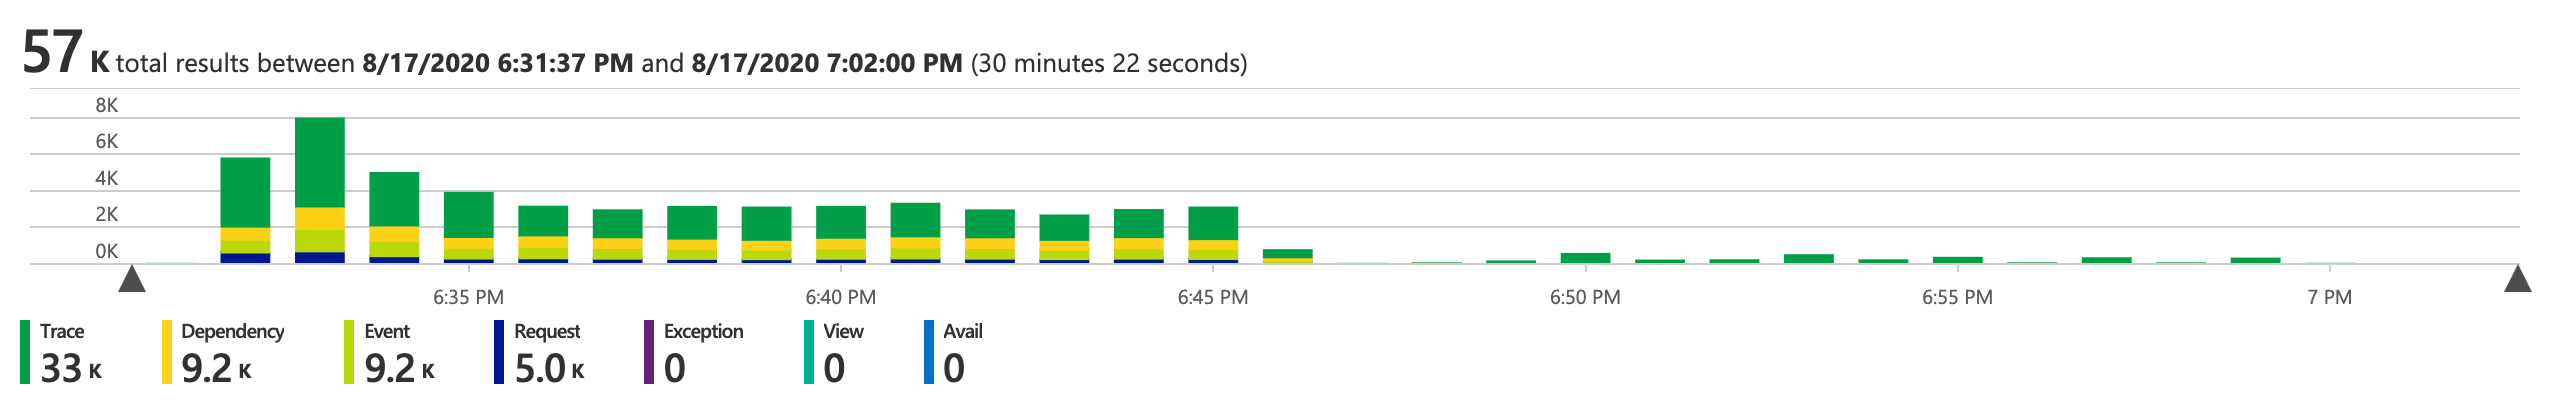
After (span of 1 hour):
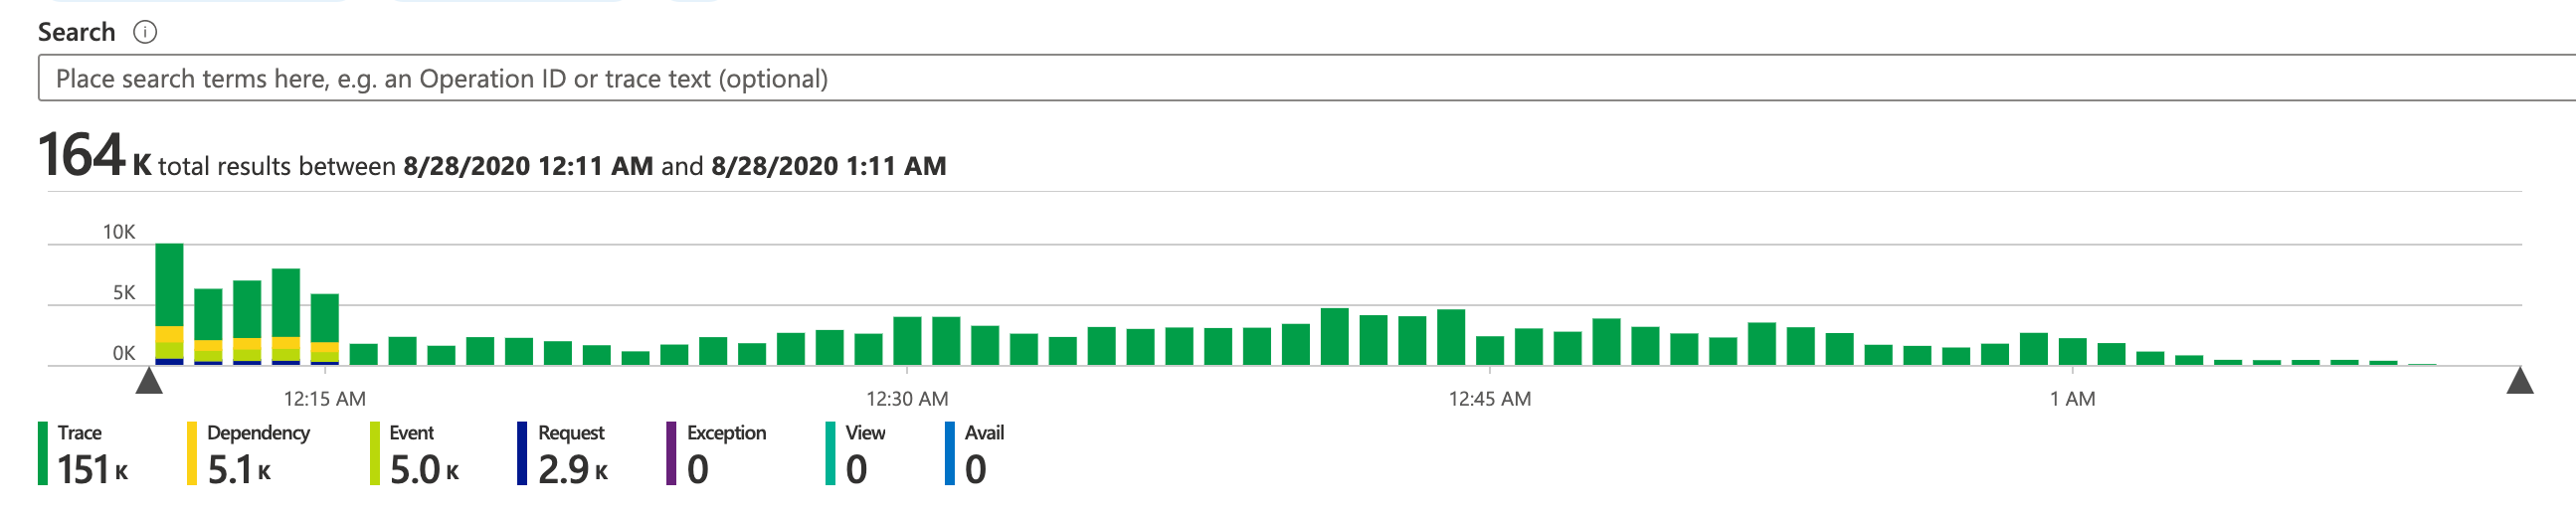
- The last outgoing message was completed in ServiceBus at 12:15am
- The last meeting's durable entity processes its last batch at 1:04am
- No noticeable idle time
Complete drain: ~45 min
As a side note, to improve this more I might try send-batching which would hopefully coerce the AzFunc service bus extension to fetch more messages in a batch. This ultimately means that the entity message sizes would increase. I know I'll have to experiment to see if storage latency starts becoming a contributing factor, but any advice you can give to mitigate this (or other ways to improve throughput) would be greatly appreciated.
Anyway, I'll run more tests - but these initial results are awesome. Let me know if you'd like me to close this issue or keep it open and run more tests. I can't thank you all enough for tackling this!
adiun
on 28 Aug 2020
@adiun, this is great news!
As for recommendations regarding batch size and storage latency, as long as you keep your UTF8 encoded message size below 45KB, you should still be able to fit your entire message on the queue. After that, we have to throw the message into blob storage, which will definitely impact latency, though it may be by an acceptable margin considering the potential gains you will get from batching.
In general, for entities we already attempt to do a best effort for batching messages together, but you may have better results batching yourself with a service that has built-in batching support.
 ConnorMcMahon
on 28 Aug 2020
ConnorMcMahon
on 28 Aug 2020
Batching definitely improves performance - for a 20 minute virtual meeting processing time went from 15 minutes down to <2 minutes! Also made sure to keep it under that 45kb limit - good tip!
One thing I wanted to bring up - I was thinking if I could increase the controlQueueBufferThreshold I could reduce latency even more.
However I saw a few strange things when I set controlQueueBufferThreshold = 1000. The following symptoms suggest that control queue items are dequeued and in memory, but they are being continually requeued/dequeued/processed by the entity for some reason:
- Note this is happening after the meeting has been completely processed and the completed audio has been uploaded, which makes this even stranger because we have integrity checks in place to make sure that the audio can't be uploaded until after all chunks/messages have been processed (there should be no gaps/missing messages).
- I use AppInsights's Live Metrics view and it shows a bunch of incoming telemetry items like this:
@encounterentity@41203000-b21f-41aa-89ca-593391ca06f1: Function 'encounterentity (Entity)' completed 'Append' operation 5bc7b24c-ddc8-4e06-8ef9-527a4e0910a9 in 505.7701ms. IsReplay: False. Input: (222324872 bytes). Output: (null). HubName: dxtadunnithuploadfn. AppName: dxt-adunnith-upload-fn. SlotName: Production. ExtensionVersion: 2.3.0. SequenceNumber: 6516. - The Storage Explorer view for the appropriate control queue shows the same message
0 of 469 messages in the queuefor hours. - At one point I could see the actual messages in the control queue and the messages showed a
dequeueCountof 14. - Live Metrics shows that this is taking up CPU cycles.
- Finally, the strangest part is that Kusto logs don't show any of this. Live Metrics is the only view that shows the telemetry in (2).
If I restart the function app, I see that 0 of 469 number eventually decrease. Any debugging tips/ideas you have to figure out why those messages are being requeued?
adiun
on 14 Sep 2020
@adiun _oftopic_:
i know batching from the service bus trigger is somewhat of a new feature and was wondering if you have experienced any issues with it? haven't tried it out yet but i'm assuming you have to manage the message completion and dead lettering yourself?
also, the issue i just raised might also be relevant to you:
1467
mpaul31
on 14 Sep 2020
@adiun, could you provide a timestamp for when you were seeing this odd behavior? To my knowledge, increasing controlQueueBufferThreshold should not generally result in repeated dequeuing.
It would be partially expected if you were scaling out agressively, and you had grabbed many messages, and then a new lease owner grabbed the partition, so those messages had to be abandoned for the new lease owner to process those messages. However, I would not expect to see a dequeue count of 14, more like 2 or 3 for even the most aggressive of scale outs. Seeing the telemetry might make this more clear.
ConnorMcMahon
on 14 Sep 2020
@ConnorMcMahon -
Start: 2020-09-14T03:15:12.596Z
End: 2020-09-14T03:32:12.596Z
Function App name: dxt-adunnith-upload-fn
Function name(s): ProcessAudio
Azure region: westus2
Orchestration instance ID(s): @encounterentity@41203000-b21f-41aa-89ca-593391ca06f1
Azure storage account name: dxtadunnithuploadstrg
Azure durable storage account name: dxtadunnithupldstrgdrbl
Note we have an 'EncounterUploaded' event that fires when we have received all of the audio - in this case we received it at 2020-09-14T03:16:59.222Z. It is definitely not normal if the entity continues to do some processing after that (in fact, we delete the entity when that event occurs).
@mpaul31 we've been using service bus trigger batching for a while in AzFunc. When we started using it, it made a huge difference in throughput. One of the biggest side effects is that it reduced the amount of durable entity signals. We can send one signal for a large batch of messages and this reduces overhead significantly. I think the Durable Task framework picks 32 messages from the control queue at a time, so it's in our entity's best interest that there's as much data per message as possible. We haven't hit issues with batching yet.
The most recent batching changes I introduced are for the other side of the service bus, on the producer side of the messages. Before, the producer was pushing messages immediately into the queue and the AzFunc consumer was pulling them almost immediately via the trigger batching logic. The problem was the consumer batch sizes were pretty small so there were still more messages than we wanted. As mentioned before, we want to max out the size of these batches. So in order to do that the producer collects a batch of messages and puts it on the queue all at once. The (fast) consumer now has enough messages to create a 'full' batch - where the size is almost equal to 45kb. This feature of AzFunc ServiceBus batching was undocumented - you can cap it with the serviceBus.batchOptions.maxMessageCount option.
adiun
on 15 Sep 2020
@adiun, I am taking a look at this case now, thanks for the detailed information.
ConnorMcMahon
on 23 Sep 2020
@adiun
I think I have diagnosed the issue.
So it turns out that our "RefreshWorkItem" logic in the DurableTask.Core is lacking (this issue is a bit of an overexaggeration, but we do not call the method on a frequent basis at all). Because of this, when your entity execution takes longer than 5 minutes (the default visibility timeout) from when we read the message to when we finish executing it's batch, we have retrieved the message a second time, invalidating the queue message's pop receipt. This means we can't delete the queue message we just processed, resulting in us trying to reprocess it. This forms a feedback loop, as your batches get larger and larger and take longer and longer to process.
In general, you can workaround this problem by keeping your entity execution time shorter than your queue visibility timeout (default is 300 seconds). You can tweak this by either decreasing controlQueueBufferThreshold to keep your batch sizes smaller and you entity executions shorter running, or you can increase the queue visibility timeout. Note that if you increase queue visibility timeout, and there is a crash on one of your workers, the latency for processing those queue messages will increase.
I am going to file a new issue on the Durable Task repo, and then I will close this issue, as the original issue has been fixed, and the fix for this new issue involves some work in that repository.
ConnorMcMahon
on 24 Sep 2020
Tracking this issue as https://github.com/Azure/durabletask/issues/112.
ConnorMcMahon
on 24 Sep 2020
Related issues
 shibayan
·
4Comments
shibayan
·
4Comments
 cgillum
·
4Comments
cgillum
·
4Comments
 pacodelacruz
·
3Comments
pacodelacruz
·
3Comments
 SimonLuckenuik
·
3Comments
mpaul31
·
3Comments
SimonLuckenuik
·
3Comments
mpaul31
·
3Comments