Azure-functions-durable-extension: Durable Function fan-out (with Activity Triggers) scales too slowly
Hi,
We are prototyping the standard Durable function Fan-Out scenario.
We have a loop that calls around 700 Activity Functions and then waits for them to complete.
My issue is that the activity functions don't appear to causing the functions to scale out - at least not any any reasonable amount of time.
I see HTTP triggers will scale every 1 second, but other are 30 seconds?
My Durable function is HTTP triggered and a I want to do a lot of identical work in parallel. If the Fan-Out situation doesn't cause the function to scale, I'm not sure how useful it is.
Am I missing something or is Fan-Out not good at scaling out?
Thanks,
Scott
 scott-aptuity
All 13 comments
Do you see zero scaleout -- or slower scaleout than you expect? The scaling logic will add instances when it sees that the backlog of messages is growing faster that it's able to keep up. Http scales much faster than other triggers, so that may be what you're experiencing.
+@ConnorMcMahon / @cgillum who may have more to say. If you want to share your app name (either explicitly or privately), we may be able to see if there was any specific issue in your case.
 brettsam
on 10 Sep 2019
brettsam
on 10 Sep 2019
I think its scaling out slower (30 second poll) than I would expect. I would like to have the Activity Triggers scale out much quicker so the Fan Out can be done in parallel. With the 30 second poll, the activity is basically being done serially since its not Scaling Out. I was hoping it would Scale Out quickly and all the activities could be done in parallel. This seems like a fairly typical Fan-Out scenario.
Each Fan Out Activity downloads a json file from blob and does some processing on it. Nothing massive, maybe about 250ms total work time. If we are doing 1000, I was hoping to speed it up with on demand resources.
scott-aptuity
on 10 Sep 2019
I second this.
I'm also testing a durable function fan-out scenario. The orchestrator creates a blast of about ~300 activity functions and waits from them to complete. Each activity function takes around 4 seconds. What I end up seeing is the fan-out taking ~1200 seconds because the scale controller never adds instances. What I was hoping to see was the scale controller adding a bunch of instances to process this data as fast as possible, but unfortunately it's just happy to plug away with a single instance.
Is this because the activity function calls aren't piling up (because it's just a single blast of 300 and then nothing)?
Is there a way to tell the scale controller to be super aggressive in adding instances? I was hoping to see it just process the activity functions with 100 instances and thus be 100 times faster (ignoring overhead and whatnot).
 ChuckEdx
on 27 Nov 2019
ChuckEdx
on 27 Nov 2019
@scott-aptuity Yes, the scale controller currently scales out every 30 seconds in the Azure Functions Consumption plan. For Elastic Premium plans, it's once instance per 15 seconds. The reasons we originally had that disparity are no longer valid so we're looking into fixing soon so that non-HTTP workloads can scale as responsively as the HTTP workloads.
@ChuckEdx for your case it sounds like you're just not scaling at all, which isn't expected given the number of messages and the total time to process them all. The algorithm we use to scale Durable Function apps is pretty simple: has a message been sitting in the work-item queue waiting for more than 1 second? If so, scale out. That's obviously not happening for you so I think it would be good for us to investigate. If you have an Azure support plan, I suggest opening a case. Otherwise if you can share some information about your function app (the Azure region and the app name or some other unique identifier like an orchestration instance ID) and the timeframe, then we can take a quick look to try and figure it out.
(Also, I'm transferring this to the Durable Functions GitHub repo).
 cgillum
on 28 Nov 2019
cgillum
on 28 Nov 2019
@cgillum an example would be instance id dd81b56c5b6d4084904a6cf5b548442b, Central US region
edit: time 2019-11-27T19:07Z to 2019-11-27T19:33Z
ChuckEdx
on 28 Nov 2019
The reasons we originally had that disparity are no longer valid so we're looking into fixing soon so that non-HTTP workloads can scale as responsively as the HTTP workloads.
@cgillum when is this likely to land? this would be incredible for my use-case!
 olitomlinson
on 17 Dec 2019
olitomlinson
on 17 Dec 2019
Hi,
We have noticed a similar issue to @ChuckEdx while prototyping Durable Functions for our use case. What we are seeing is that queueing up 100s or 1000s of activities from an orchestrator produces unexpected processing times. Below is a graph of 10 independent runs where an orchestrator was initiated from a HTTP trigger. The orchestrator calls an activity 1000 times asynchronously and waits for each activity to complete (the code sample for the Fan-Out scenario was only slightly modified to track execution/queue times). The time an activity is called is passed to each activity as its input. All the activity does is record the time it was able to process and send back the stats as output. Nothing intensive is being done. Each activity on average takes a few ticks to complete.
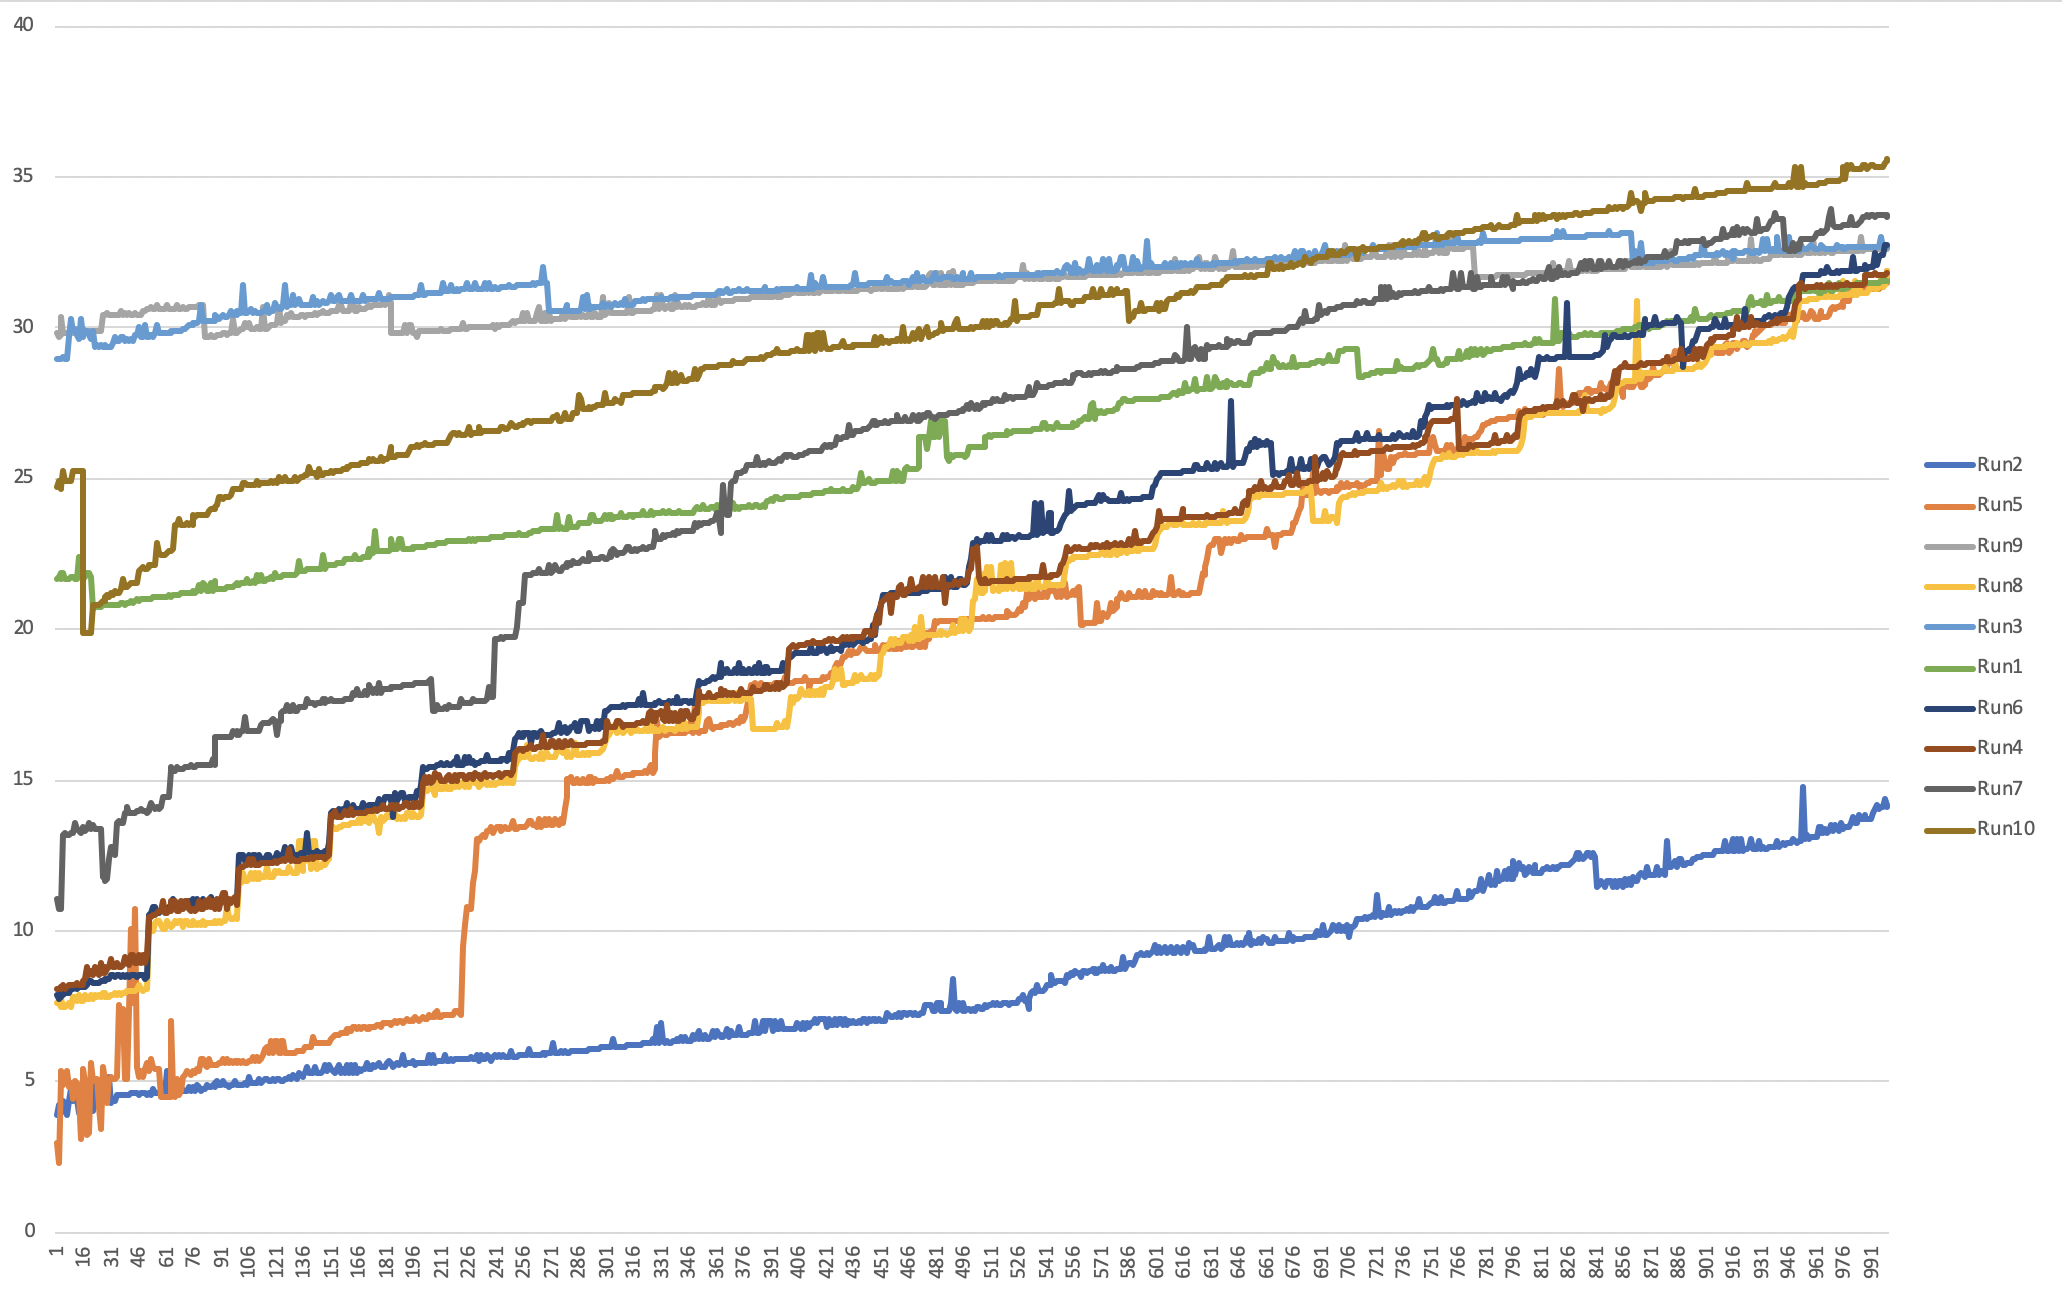
The y-axis is duration in seconds the activity waited to be processed. The x-axis is the activity index. In the runs above some activities waited a maximum of 30 seconds before they were processed. I have included a snippet of the code used to generate the above data for the graph:
public static class DurableFunctionBenchmark
    {
        [FunctionName("Orchestrator")]
        public static async Task<List<ActivityOutput>> RunOrchestrator(
            [OrchestrationTrigger] IDurableOrchestrationContext context)
        {
            var outputs = new List<ActivityOutput>();
            var parallelTasks = new List<Task<ActivityOutput>>();

            var contextInput = context.GetInput<FunctionInput>();
            var amountToProcess = contextInput.Amount;
            var enableParallelism = contextInput.EnableParallelism;
            var degreeOfParallelism = contextInput.DegreeOfParallelism;

            for (int i = 0; i < amountToProcess; i++)
            {
                if (enableParallelism && parallelTasks.Count(p => !p.IsCompleted) >= degreeOfParallelism)
                {
                    await Task.WhenAny(parallelTasks.Where(p => !p.IsCompleted));
                }

                Task<ActivityOutput> task = context.CallActivityAsync<ActivityOutput>("FanOut", new ActivityInput { ExecutedAt = DateTime.Now.ToString(), Index = i + 1, TestCase = contextInput.TestCase });
                parallelTasks.Add(task);
            }

            await Task.WhenAll(parallelTasks);

            outputs.AddRange(parallelTasks.Select(t => t.Result));
            return outputs;
        }

        [FunctionName("FanOut")]
        public static async Task<ActivityOutput> FanOut(
                [ActivityTrigger] ActivityInput input, ILogger log,
                [DurableClient] IDurableEntityClient client)
        {
            var start = DateTime.Now;

            var end = DateTime.Now;
            return new ActivityOutput(input.Index, DateTime.Parse(input.ExecutedAt), start, end, input.TestCase);
        }

        [FunctionName("FunctionTest_HttpStart")]
        public static async Task<HttpResponseMessage> HttpStart(
            [HttpTrigger(AuthorizationLevel.Anonymous, "get", "post")]HttpRequestMessage req,
            [DurableClient] IDurableOrchestrationClient client,
            ILogger log)
        {
            var content = JsonConvert.DeserializeObject<FunctionInput>(await req.Content.ReadAsStringAsync());
            // Function input comes from the request content.
            string instanceId = await client.StartNewAsync("Orchestrator", null, content);
            log.LogInformation($"Started orchestration with ID = '{instanceId}'.");

            return client.CreateCheckStatusResponse(req, instanceId);
        }
    }
It might also be important to note that introducing a throttle on the number of activities being enqueued at a time didn’t significantly reduce the total amount of time taken to process all activities. The wait times in the queues were reduced. This can be seen in the graph below were 3 runs:
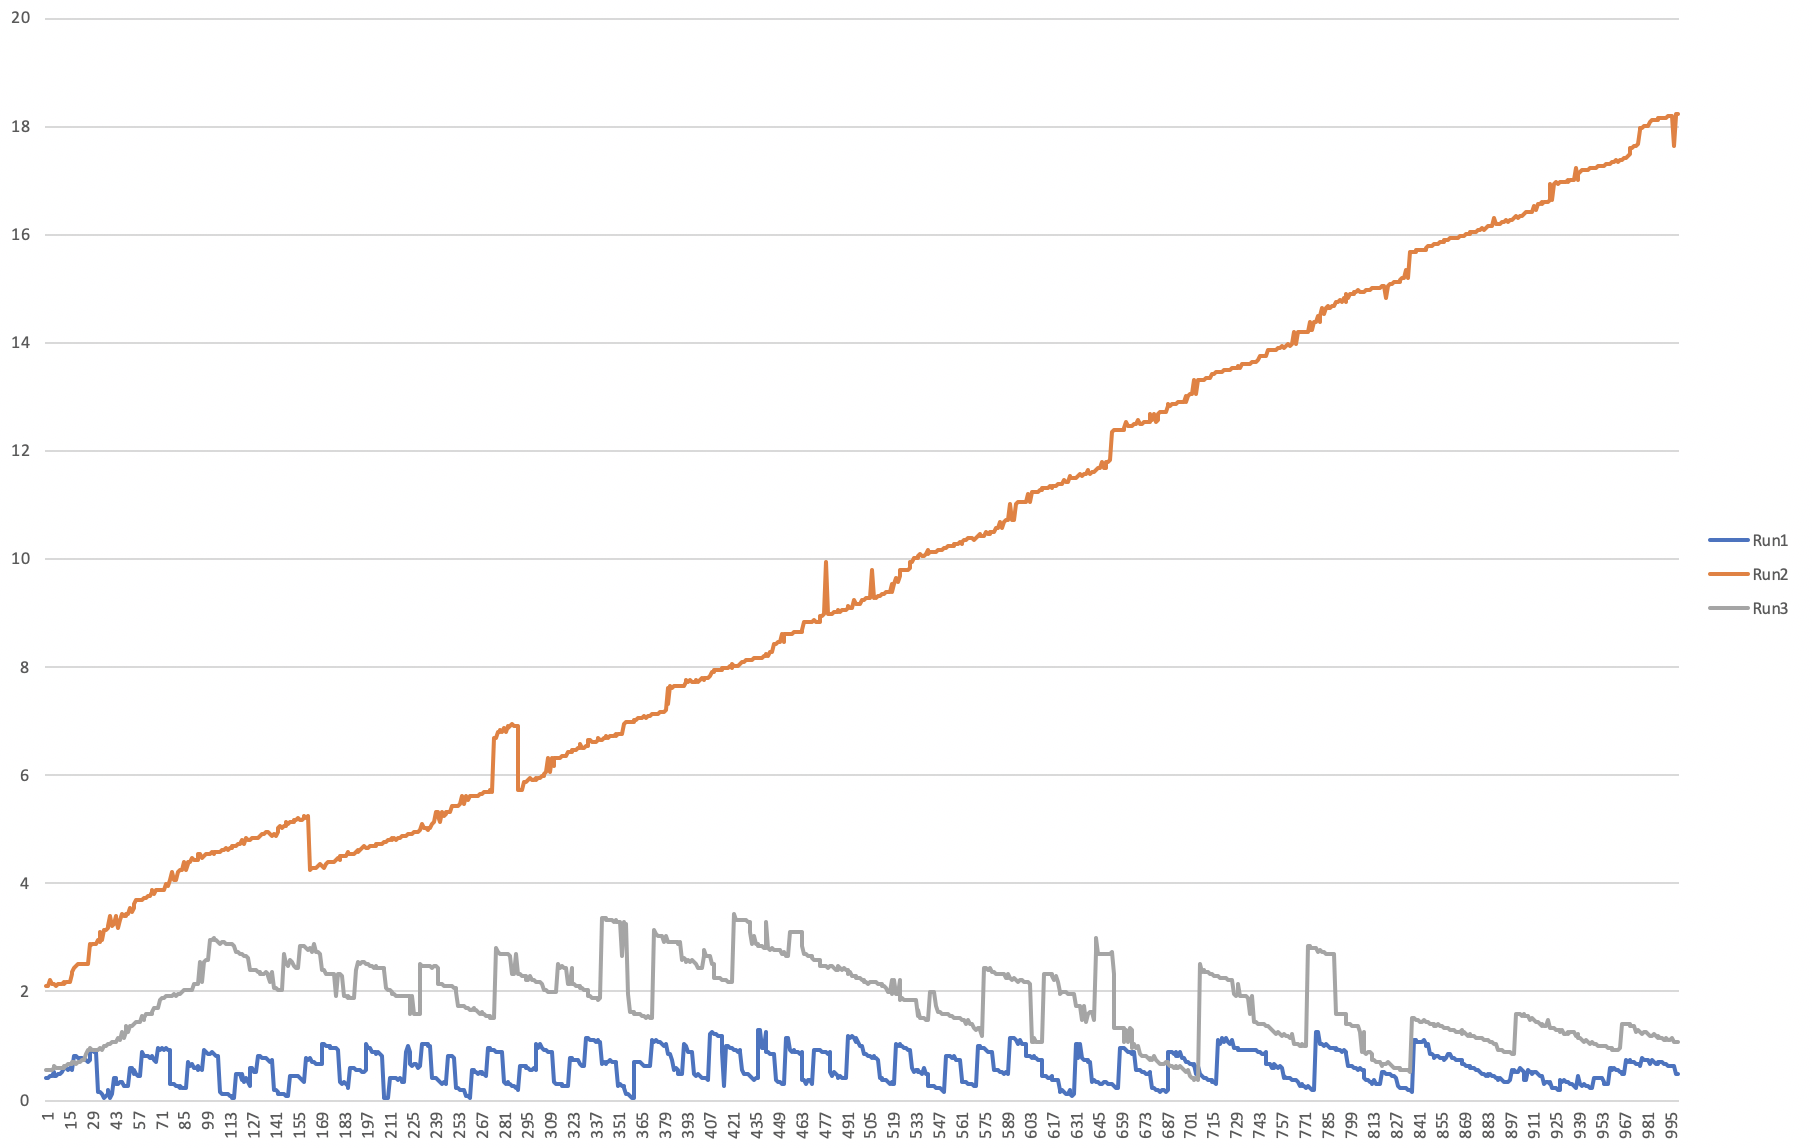
What isnt visible above in the batched runs is the time taken while waiting for activities to dequeue and complete.
- Run1 with 10 batches at a time
- Run2 with no batching at all. Enqueueing all activities as quickly as possible.
- Run3 with 100 batches at a time
We would ideally like to kick off 1000s maybe even 10000s of activites from an orchestrator to then aggregate the results once all activities are complete. I cannot find any documentation on what the best practice is when calling activities from an orchestrator.
AppID: 5770f21b-6583-465c-90b8-0ecd8b6b0038
Region: Australia Southeast
Times: 2019-12-11 -> 2019-12-18. Data for the graphs were generated on the 2019-12-18 AEDT
 mikestichling
on 18 Dec 2019
mikestichling
on 18 Dec 2019
@cgillum Is there any update on this?
ChuckEdx
on 28 Feb 2020
@ChuckEdx There are two different issues being discussed on this thread and unfortunately your specific case fell off my radar. Would you mind opening an Azure support ticket for your case, and provide a more recent instance where you observed that your app wasn't scaling? Alternatively if you open a new GitHub issue with a recent repro we can try looking into it there, but a support ticket will provider a higher guarantee of a resolution.
cgillum
on 29 Feb 2020
@cgillum No worries. I meant in terms of the activity trigger scaling, because that's relevant for me as well.
ChuckEdx
on 29 Feb 2020
Ah, you were asking about the speed of scale? We're still having internal discussions about this. The main concern is making sure rapid scale out for non-HTTP workloads doesn't create too much capacity pressure. This is something we're currently planning on looking at over the next 6 months or so.
In the meantime, there are a couple workarounds you can consider:
- Use an App Service Plan with a fixed set of VM instances and/or include scheduled based auto-scale rules. Unfortunately this is not very "serverless" but it is an option that gives you more control over the resources your app uses.
- Use an Elastic Premium Plan and configure a minimum instance count. The premium VMs are more powerful and can have as many as 4 cores. They also scale a bit faster than the consumption plan, so you effectively get a much faster rate of CPU scaling with a configurable floor.
These options are not cheap, but they are options. We will definitely make public mention of when the faster scaling becomes available for the Consumption plan.
cgillum
on 29 Feb 2020
@cgillum Yes. Thank you for the update. I've tried the App Service Plan route, and I can confirm that it does scale rapidly. However, as you said, it's not very "serverless" and is probably less cost efficient. I look forward to seeing what you guys come up with for the Consumption Plan.
ChuckEdx
on 29 Feb 2020
Any updates on this?
 emanuel-virca
on 14 Dec 2020
emanuel-virca
on 14 Dec 2020
Related issues
 kaftw
·
4Comments
kaftw
·
4Comments
 mpaul31
·
3Comments
mpaul31
·
3Comments
 shibayan
·
3Comments
shibayan
·
3Comments
 YodasMyDad
·
3Comments
YodasMyDad
·
3Comments
 danielearwicker
·
3Comments
danielearwicker
·
3Comments
Most helpful comment
@cgillum Yes. Thank you for the update. I've tried the App Service Plan route, and I can confirm that it does scale rapidly. However, as you said, it's not very "serverless" and is probably less cost efficient. I look forward to seeing what you guys come up with for the Consumption Plan.