Azure-docs: Microsoft.Compute/virtualMachines - Network In Total - Network Out Total
[Enter feedback here]
For Microsoft.Compute/virtualMachines
Network In Total
Network Out Total
What's the period of this metric? One sec? One Minute? One Hour? It's not clear in the document.
Document Details
⚠ Do not edit this section. It is required for docs.microsoft.com ➟ GitHub issue linking.
- ID: a0a586c4-71fd-e60b-9c4c-1a3eb2443c74
- Version Independent ID: 2f3706cc-073b-a310-8da4-2a5a90da6473
- Content: Azure Monitor supported metrics by resource type - Azure Monitor
- Content Source: articles/azure-monitor/platform/metrics-supported.md
- Service: azure-monitor
- Sub-service: metrics
- GitHub Login: @rboucher
- Microsoft Alias: robb
 yeswps
All 11 comments
@yeswps Thanks for your comment! We will review and provide an update as appropriate.
 KrishnaG-MSFT
on 26 Jun 2020
KrishnaG-MSFT
on 26 Jun 2020
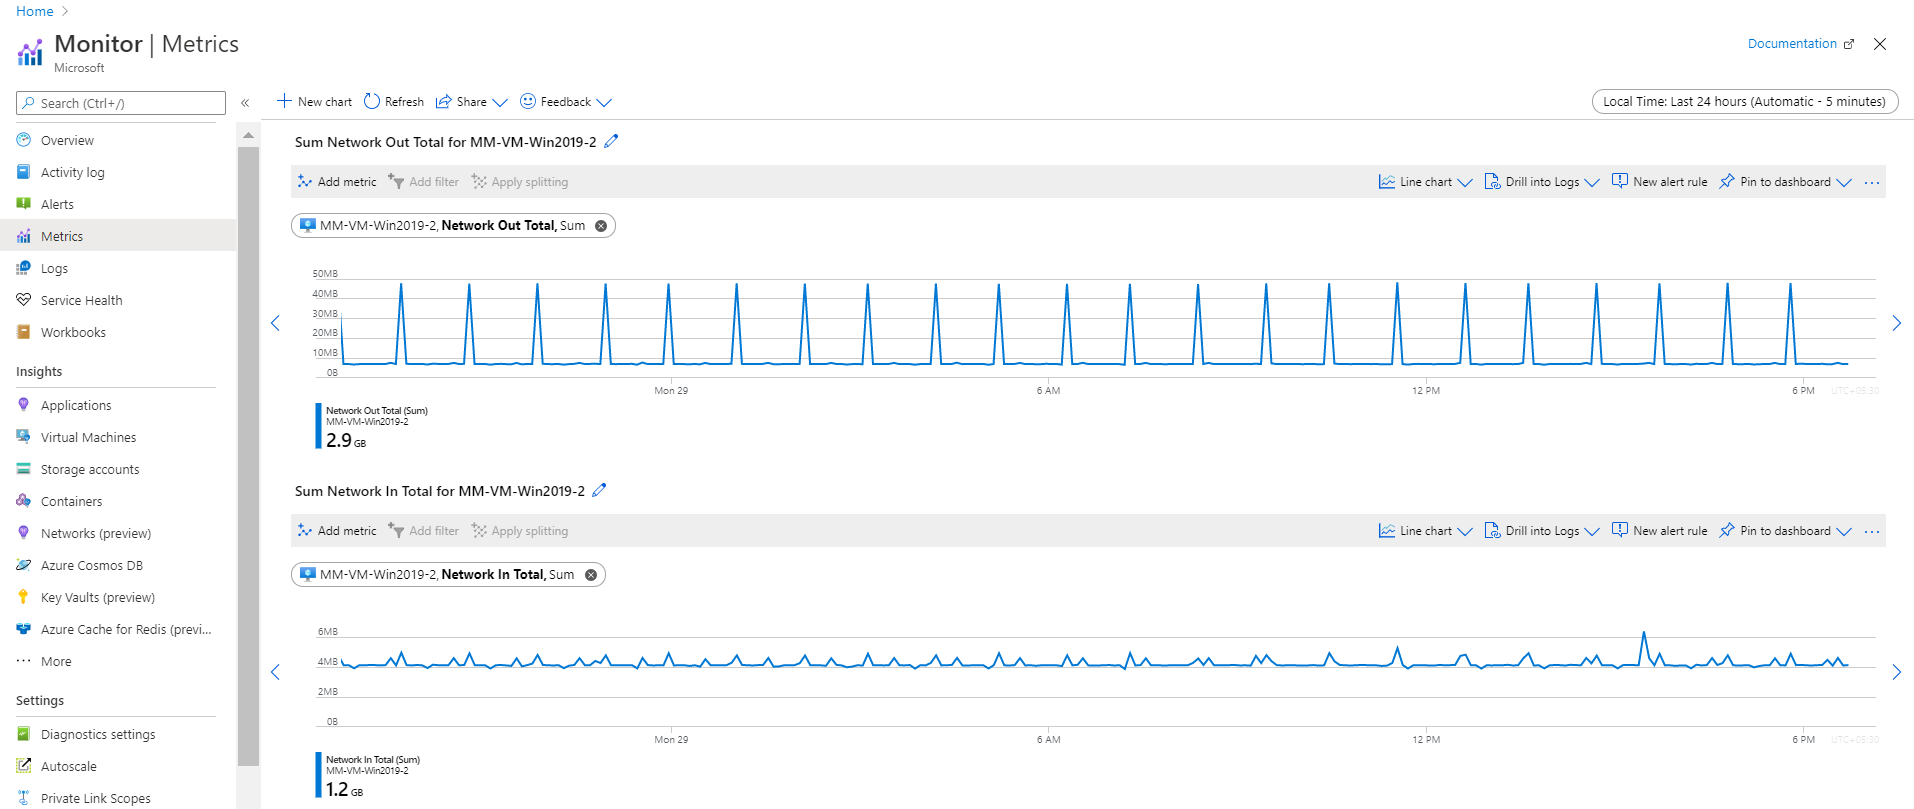
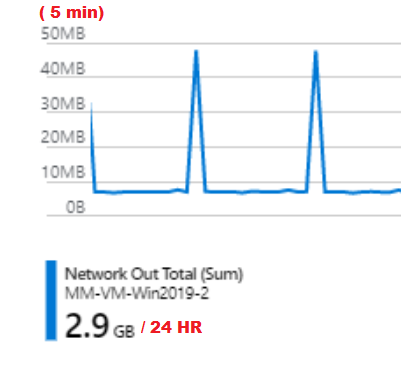
@yeswps This referred Azure document is intended to provide complete list of all platform (that is, automatically collected) metrics currently available with Azure Monitor's consolidated metric pipeline. However, to answer your question, it always monitor's this metrics continuously. For illustration, check below screenshot.
KrishnaG-MSFT
on 29 Jun 2020
@KrishnaG-MSFT
Take your screenshot for example
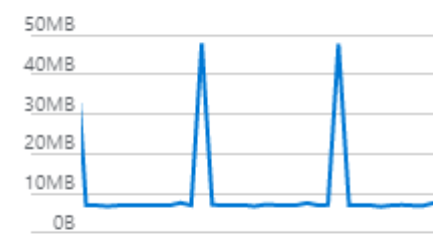
top chart Network Out Total, Sum, vertically, it jumps between 10MB to 40MB, is this measurement an indication of current throughput of the outbound traffic, which translates to 10MB/s to 40MB/s?
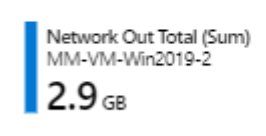
On left corner of Network Out Total, Sum chart, it shows 2.9GB. Is this 2.9GB of outbound traffic accumulated in last second, or last minute, or last hour?
yeswps
on 1 Jul 2020
@yeswps That depends on the time period you pick. I think you may be confusing what "Total" means. The description of the metric says " The number of bytes out on all network interfaces by the Virtual Machine(s) (Outgoing Traffic)". So it's totaling up all the network interfaces, not a time period on a chart. It, like most other metrics, is likely tracking the bytes every minute. Then it aggregates that information over the time period you choose. When you see "Network Out Total (Sum)", that's a sum of everything in the time period. In the screenshot above, the period is 24 hours and each graphic point represents 5 minutes of data summed together. See https://docs.microsoft.com/azure/azure-monitor/platform/metrics-charts#changing-aggregation for more information. That help?
 rboucher
on 1 Jul 2020
rboucher
on 1 Jul 2020
@rboucher
Thanks Rob! Now this starts to make sense. Take Krishna's screenshot for example, the sampling interval is every 5 minutes, and the total sampling period is 24 hours.
For Network Out Total, Sum
In last 24 hours, total sum is 2.9GB, break down to 5 minutes sampling interval:
2.9GB = 2.9 x 1024 MB = 2969.6MB
2969.6MB / 24 hours = 123.733 MB / Hour
5 minutes sampling = 12 samplings in each hour
123.733 MB / Hour / 12 sampling/hour = 10.31 MB per sampling period, which matches the chart
The throughput should be: (assuming a single NIC)
10.31 MB per 5 minutes = 35.19KB per second
For Network In Total, Sum
In last 24 hours, total sum is 1.2GB, break down to 5 minutes sampling interval:
(1.2 x 1024 / 24) /12 = 4.26MB per sampling period, which also matches the chart.
yeswps
on 1 Jul 2020
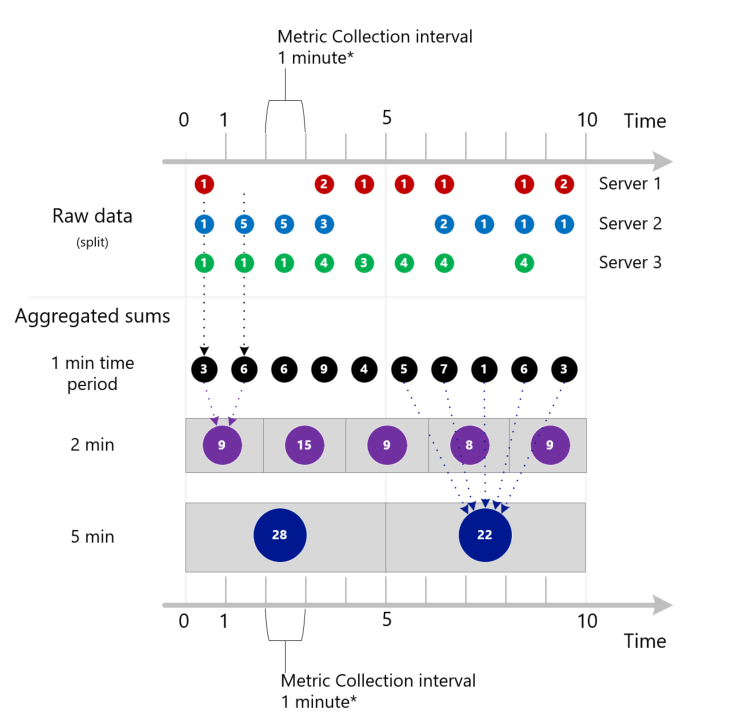
@yeswps Glad that helps. Given your question, I think it makes sense for me to include this example in the documentation section I just referred you too. Keep in mind that we are doing averages when we aggregate periods together. So the jump to an average of 35.19kb per second while accurate could be hiding significant peaks and valleys. It could have been any combination of numbers that added up to 10.31 MB. I have a graphic I'm working on to show aggregations. Attaching. Feel free to critique.
rboucher
on 1 Jul 2020
@rboucher The graph makes sense, it would be better to accompany some explanation, such as:
- For one minute time period, from minute 0 to 1 , server 1 to 3 total counts are: 1+1+1 = 3. From minute 1 to 2, server 1 to 3 total counts are: 5+1 = 6
- For two minutes time period. From minute 0 to 2, server 1 to 3 total counts are: (1+1+1) + (5+1) = 9
- For five minutes time period. From minute 0 to 5, server 1 to 3 total counts are: (1+1+1) + (5+1) + (5+1) + (2+3+4) + (1+3) = 28
From Azure portal GUI interface point of view, it's better to include the collection interval, as time unit to avoid confusions, or having to lookup into documentations.
In windows performance monitor, when you add counters, it clearly indicates the collection interval to avoid confusions, example, it shows collection interval is per second for the counters.
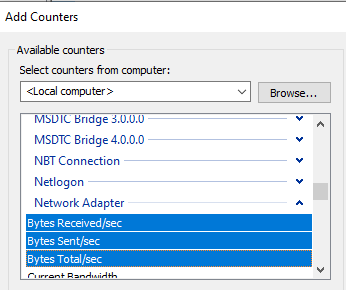
I wish Azure metric would dynamically indicate the collection interval to avoid confusions, such as:
yeswps
on 1 Jul 2020
@yeswps Thanks for the feedback. I did have an explaination I was working on. I'll make sure I include what I've learned from your feedback. Thanks for asking! I'll also contact the product team about your UI feedback. @vgorbenko . Can we close this issue for now? I'm scheduled to update the doc I referred to above in July 2020.
rboucher
on 1 Jul 2020
@yeswps I have an extensive update about this topic if you'd like to be the first to review it. I need a non-Microsoft person to take a look. No obligation though. Let me know if you are interested by replying here.
rboucher
on 17 Jul 2020
@rboucher yeah, it will be my pleasure! Please let me know what I can do to contribute.
yeswps
on 17 Jul 2020
@yeswps at microsoft.com I'm "robb" . Email me.
rboucher
on 17 Jul 2020
Related issues
 paulmarshall
·
3Comments
paulmarshall
·
3Comments
 bityob
·
3Comments
bityob
·
3Comments
 ianpowell2017
·
3Comments
ianpowell2017
·
3Comments
 jharbieh
·
3Comments
jharbieh
·
3Comments
 Favna
·
3Comments
Favna
·
3Comments