Azure-docs: How to view input and prediction using Application Insights Log Analytics
How can i view the following images of the steps in the "Evaluate data" section? I can't get this information in the trace table even if I go through the steps.
I want to be able to see input and prediction as in the image above.
Document Details
⚠ Do not edit this section. It is required for docs.microsoft.com ➟ GitHub issue linking.
- ID: 12f83c8d-8ec9-0b56-00c3-cdafc53c90f1
- Version Independent ID: 9fb32434-54da-9789-ec8e-1d192343feb5
- Content: Monitor and collect data from Machine Learning web service endpoints - Azure Machine Learning
- Content Source: articles/machine-learning/how-to-enable-app-insights.md
- Service: machine-learning
- Sub-service: core
- GitHub Login: @Blackmist
- Microsoft Alias: larryfr
 damochiz
All 8 comments
@damochiz Thanks for the question. We will update you shortly.
 ram-msft
on 1 Jun 2020
ram-msft
on 1 Jun 2020
@damochiz Thanks for the details. Please follow the below to see logs for deploy model to use application insights with python SDK or azure machine learning studio.

Monitoring Model Serving Service
AML service allows native integrated support of AppInsights into ACI and AKS to collect metrics at the service level.
Below are some metrics that can be collected to monitor overall service health.
Request rates, response times, and failure rates.
Dependency rates, response times, and failure rates.
Exceptions.
Ex: Sending a simple event telemetry item
Identify the service in your workspace. The value for ws is the name of your workspace

Update your service and enable Application Insights:
There are two options to enable Application Insights using AML services SDK:
Setting enable_app_insights to True direct on the

Enabling AppInsights diagnostics direct on deployed model blade:

ram-msft
on 5 Jun 2020
@ram-msft Thank you for quick response. But I already know that I can see the logs from the request table. What I want you to confirm is that I can't see Input and Prediction data in customDimensions from the traces table, as shown in the image.
damochiz
on 5 Jun 2020
Hi @damochiz , thanks for reporting this problem. I'll check with engineering and see if there's any missing steps or info from the document.
 Blackmist
on 5 Jun 2020
Blackmist
on 5 Jun 2020
@damochiz I've mailed engineering and am waiting on a response. While I had some spare time, I deployed to ACI and enabled logging to App Insights. What I'm seeing for that deployment is a customDimensions that has the _container ID_ and _response value_. The response value seems to be the prediction that's returned, but there's no input logged.
Anyway, I've confirmed that the experience is different from what is in the doc. Waiting on engineering so we can understand if this is a change that was made and the document wasn't updated, something that shows for specific types of deployments (AutoML or pipeline maybe), a bug, or something else.
Blackmist
on 5 Jun 2020
@damochiz , thanks again for reporting this and sorry for the confusion. The screenshot is old and needs to be replaced. It was based on using the azureml-monitor package, which is being retired. These docs were updated a while back to remove mentions of the package, but this screenshot wasn't removed.
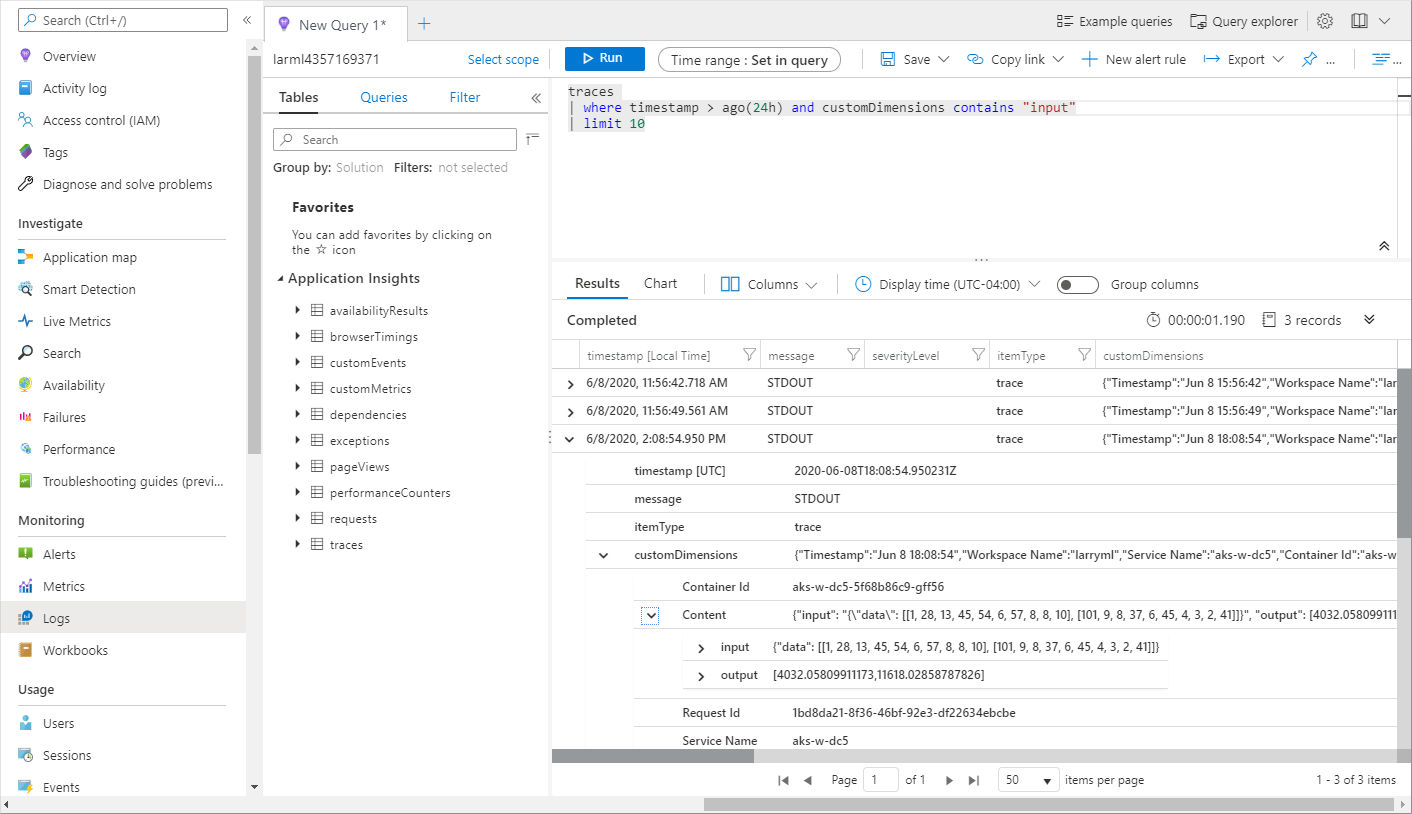
When using the 'new' method of printing output from the code, it gets pushed into the customDimentions.Content field.
From experimenting around a bit, I found that you can print a JSON object, and it will give you a nested structure in the log analytics query view, similar to the screenshot in the image. Just that everything shows up under the Content field instead. For example, here's what I added to a deployment that gave me a nested output:
def run(raw_data):
    try:
        data = json.loads(raw_data)['data']
        data = numpy.array(data)
        result = model.predict(data)
        info = {
            "input": raw_data,
            "output": result.tolist()
            }
        print(json.dumps(info))
        # you can return any datatype as long as it is JSON-serializable
        return result.tolist()
The output in the analyzer view is an expandable Content element, with Input and Output elements under it.
I'll update the screenshots in the docs, along with adding a tip about this approach to emitting multiple data items in one print statement.
Blackmist
on 8 Jun 2020
@Blackmist , I could get the expected output from traces table by editing the script as you mentioned. It was a very big help. Thank you very much :)
Also thank you for updating the screenshots in the docs!!
damochiz
on 9 Jun 2020
@damochiz You're welcome! And thanks again for reporting this so we can improve the docs.
please-close
Blackmist
on 10 Jun 2020
Related issues
 spottedmahn
·
3Comments
spottedmahn
·
3Comments
 JamesDLD
·
3Comments
JamesDLD
·
3Comments
 bityob
·
3Comments
bityob
·
3Comments
 varma31
·
3Comments
varma31
·
3Comments
 mrdfuse
·
3Comments
mrdfuse
·
3Comments
Most helpful comment
@damochiz , thanks again for reporting this and sorry for the confusion. The screenshot is old and needs to be replaced. It was based on using the azureml-monitor package, which is being retired. These docs were updated a while back to remove mentions of the package, but this screenshot wasn't removed.
When using the 'new' method of printing output from the code, it gets pushed into the
customDimentions.Contentfield.From experimenting around a bit, I found that you can print a JSON object, and it will give you a nested structure in the log analytics query view, similar to the screenshot in the image. Just that everything shows up under the Content field instead. For example, here's what I added to a deployment that gave me a nested output:
The output in the analyzer view is an expandable Content element, with Input and Output elements under it.
I'll update the screenshots in the docs, along with adding a tip about this approach to emitting multiple data items in one print statement.