Azure-docs: what is the meaning of 50th, 95th, 99th percentile in perfomance page
In section "Start monitoring in the Azure portal", the 3rd part:
what is the meaning of 50th, 95th, 99th percentile?
Document Details
⚠ Do not edit this section. It is required for docs.microsoft.com ➟ GitHub issue linking.
- ID: 0aac1b63-5869-0b8b-bf20-af6a6e5caaac
- Version Independent ID: f818c3a1-24fd-db14-ec1c-ec8db4d2d7fe
- Content: Quickstart Monitor Websites with Azure Monitor Application Insights
- Content Source: articles/application-insights/app-insights-website-monitoring.md
- Service: application-insights
- GitHub Login: @mrbullwinkle
- Microsoft Alias: mbullwin
 imeya
imeya
All 7 comments
@imeya "A percentile (or a centile) is a measure used in statistics indicating the value below which a given percentage of observations in a group of observations fall. For example, the 20th percentile is the value (or score) below which 20% of the observations may be found."
I hope that clears things up for you. There are several good examples of percentiles online if you would like to learn more.
We are going to close this thread as resolved but if there are any further questions regarding the documentation, please tag me in your reply and we will be happy to continue the conversation.
 kobulloc-MSFT
on 26 Oct 2018
kobulloc-MSFT
on 26 Oct 2018
Why you close the the thread , your answer is very lean and
incomprehensible
 KamenYovchev
on 18 Jul 2019
KamenYovchev
on 18 Jul 2019
@KamenYovchev Let us know what you are having difficulty with in the answer and we'd be happy to clear it up for you.
kobulloc-MSFT
on 18 Jul 2019
I'm also curious as to what the exact meaning is.
I am getting an average response time of 4.8s on a specific api call. When I select 99th, it jumps to 11.6. Which I thought to mean: Take the average, find the 1 percent samples that are furthest away from that average and ignore them. Then calculate a new average.
Mij problem being, that the in 270+ samples, there is 1 sample at 100ms, 1 sampe at like 12s, and no other samples above the 99th value.
So how come that the 99th is then that value?
 remcolam
on 25 May 2020
remcolam
on 25 May 2020
@remcolam Percentiles can be a bit confusing the first time you encounter them. They are commonly used when examining test scores and that is probably the best example for understanding what is meant by the 99th percentile.
Imagine that 100 people take a test. The lowest score would be the 0th percentile, meaning that 0% of the test takers scored less than the lowest score. The highest score would be the 99th percentile, meaning that 99% (or 99 other test takers aside from the 1 person with the highest score) scored less. For that reason, it's impossible to be in the 100th percentile (as you always have at least one score, or in this case a data point, that is included).
This is helpful when trying to figure out where a data point sits in a group. You can find a better explanation here if you'd like to learn more:
https://magoosh.com/gre/2012/gre-math-percentiles-and-quartiles/
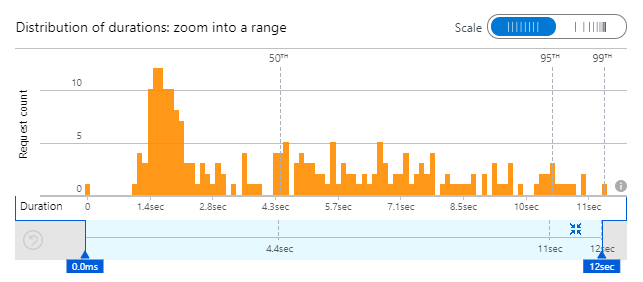
In looking at your data, you can see that the longest response was 12s with 99% of the durations being shorter. Half of your durations were less than 4.4s (this would be the median), even if that wasn't necessarily the average duration.
kobulloc-MSFT
on 26 May 2020
Thanks for the explain. It does not mean what I thought it meant... Especially since it is showing it incorrectly.
You are telling me, for 99th, you mean the top 1% . I think we can all agree, fast is better. So Application Insights is actually showing the 1st, and 5th percentile scores. Not the 99th and 95th. It is throwing away the worst scores, not the best.
Besides that, what use are those percentiles? I think dropping outliers makes much more sense. Drop the items furthest from the median, and give the average for that. For response speed, you are primarily interested in finding what most people encounter. Not the occasional hiccup which cause outliers.
remcolam
on 26 May 2020
@remcolam No worries! I'm glad we could help clear that up.
Just like with numbers, higher percentiles are not always what you want. When looking at race results (or perhaps response times), lower percentiles are better. A lower percentile race time, for example, would mean that it was faster than other racers.
Using percentiles helps to separate outliers that would otherwise skew averages just like you mentioned. If you would prefer different options for viewing your data, we'd love to have you submit your feedback here:
https://feedback.azure.com/forums/357324-azure-monitor-application-insights
kobulloc-MSFT
on 26 May 2020
Related issues
 JeffLoo-ong
·
3Comments
JeffLoo-ong
·
3Comments
 paulmarshall
·
3Comments
paulmarshall
·
3Comments
 AronT-TLV
·
3Comments
AronT-TLV
·
3Comments
 Favna
·
3Comments
Favna
·
3Comments
 bityob
·
3Comments
bityob
·
3Comments
Most helpful comment
@remcolam Percentiles can be a bit confusing the first time you encounter them. They are commonly used when examining test scores and that is probably the best example for understanding what is meant by the 99th percentile.
Imagine that 100 people take a test. The lowest score would be the 0th percentile, meaning that 0% of the test takers scored less than the lowest score. The highest score would be the 99th percentile, meaning that 99% (or 99 other test takers aside from the 1 person with the highest score) scored less. For that reason, it's impossible to be in the 100th percentile (as you always have at least one score, or in this case a data point, that is included).
This is helpful when trying to figure out where a data point sits in a group. You can find a better explanation here if you'd like to learn more:
https://magoosh.com/gre/2012/gre-math-percentiles-and-quartiles/
In looking at your data, you can see that the longest response was 12s with 99% of the durations being shorter. Half of your durations were less than 4.4s (this would be the median), even if that wasn't necessarily the average duration.