Azure-cosmos-dotnet-v2: Http 400 errors
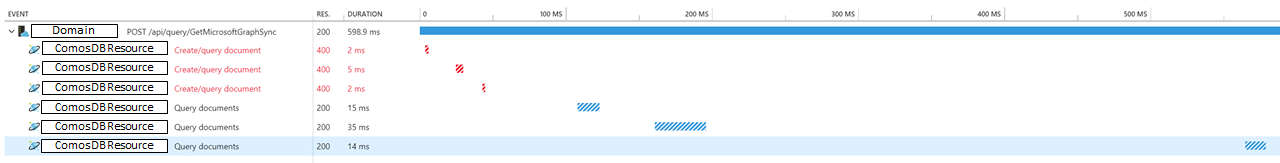
I'm seeing a lot of HTTP 400 errors from CosmosDB that I don't quite understand. To my understanding the 400 error code is used for bad requests like invalid formats and such, however to me the pattern here looks more like throttling with increasing back-off.
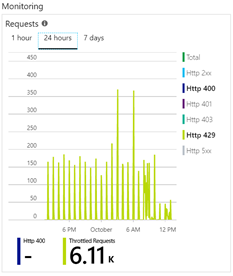
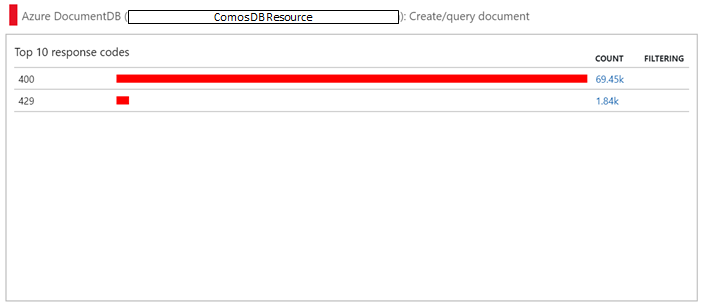
Furthermore, when I look in the CosmosDB metrics tab, I see no 400's, but plenty of 429's.
But as it turns out, some 429's show up in application insights, when I look in the Dependencies tab:
Note that all the data is from the same 24hour period, and the request trace was from a request that happened in that period.
I am using the DocumentDB client with the Graphs package (queries are in gremlin).
I know that the throttling is far from ideal (currently re-writing queries to be less expensive), but I know how to deal with that and what 429 means.
How should I interpret the 400's? Is it just throttling? Is it an issue with the dependency logging in the DocumentDB client?
 BenjaBobs
All 11 comments
When executing cross partition query, the service returns the query plan to the SDK with a 400 error code, and then SDK using the query plan will locally execute the cross partition query. However this specific 400 response will never surface to the user code.
If you are using a proxy or wire dump and see 400 errors which don't reach the end user code, please be aware that they are safe and part of the our protocol. Please just ignore them as they are not really errors.
 moderakh
on 8 Oct 2018
moderakh
on 8 Oct 2018
Thank you, with that information I can safely write a telemetry processor to filter out those specific 400's from application insights.
BenjaBobs
on 8 Oct 2018
@moderakh
When executing cross partition query, the service returns the query plan to the SDK with a 400 error code, and then SDK using the query plan will locally execute the cross partition query. However this specific 400 response will never surface to the user code.
I don't understand how this can be okay or expected behavior.
- Returning 400 on a successful request seems like a violation of the HTTP protocol.
- The use of monitoring tools like App Insights is widespread and even encouraged by Microsoft. Do you expect everyone who uses application insights and cosmos db to write a Telemetry Processor to filter this stuff out?
I don't get it and I want to. Please explain...
 mayoatte
on 9 Jan 2019
mayoatte
on 9 Jan 2019
Do I understand this issue correctly?
Hiding all 400 responses could also hide bugs in our programming code, because it is used by cosmos db for invalid queries.
400 Bad Request: The specified request was specified with an incorrect SQL syntax
 joerg-wegener
on 13 Feb 2019
joerg-wegener
on 13 Feb 2019
I totally agree with @mayoatte and also please someone to explain this issue.
 tslavik
on 2 Mar 2019
tslavik
on 2 Mar 2019
Seeing the same behaviour, and we need an explanation.
 HaakonL
on 20 Mar 2019
HaakonL
on 20 Mar 2019
You can see the source code in the new v3 SDK. There is an issue that is tracking a fix for the v3 SDK.
Here is a high level overview of the query process:
- SDK receives a query from the users. It takes the optimistic route and assumes it's a single partition query and sends it to gateway.
- If it is a single partition query the gateway will execute the query and return the results. If it is cross partition query then it will fail with a 400 bad request since gateway can not execute cross partition queries. In the response of the 400 bad request it will return the optimized query info.
- The SDK will catch the exception from gateway and realize that it is a cross partition query. It will then parse the optimized query info, and use it to execute the cross partition query.
 j82w
on 12 Apr 2019
j82w
on 12 Apr 2019
 kirankumarkolli
on 10 Jul 2019
kirankumarkolli
on 10 Jul 2019
EDIT: just wanted to add that this can be reprod ~in Direct mode~ MaxDegreeParallelization != 0 only.
 ferantivero
on 12 Jul 2019
ferantivero
on 12 Jul 2019
Imo this should be reopened. We have monitoring based on dependencies collection to find out failed dependency calls. How to distinguish good bad requests from bad bad requests?
 nosalan
on 27 May 2020
nosalan
on 27 May 2020
@nosalan this should be fixed in the latest v2 SDK. This is also not an issue if you are running an x64 application on Windows.
j82w
on 27 May 2020
Related issues
 atulloh
·
4Comments
atulloh
·
4Comments
 wingfeng
·
8Comments
wingfeng
·
8Comments
 bowen5
·
4Comments
bowen5
·
4Comments
 cgelon
·
7Comments
cgelon
·
7Comments
 rave1502
·
4Comments
rave1502
·
4Comments
Most helpful comment
@moderakh
I don't understand how this can be okay or expected behavior.
I don't get it and I want to. Please explain...