Azuracast: Icecast will disconnect and return 403 (appears to be too many connections)
Using Docker installation method
Yes.
Host Operating System
Linux, CoreOS variant:
~ $ cat /etc/os-release
BUILD_ID=11151.71.0
NAME="Container-Optimized OS"
KERNEL_COMMIT_ID=79a7b53abf2adb1a79eb0cdde2fbe3ff4734c33d
GOOGLE_CRASH_ID=Lakitu
VERSION_ID=71
BUG_REPORT_URL="https://cloud.google.com/container-optimized-os/docs/resources/support-policy#contact_us"
PRETTY_NAME="Container-Optimized OS from Google"
VERSION=71
GOOGLE_METRICS_PRODUCT_ID=26
HOME_URL="https://cloud.google.com/container-optimized-os/docs"
ID=cos
Describe the bug
Icecast appears to be creating too many concurrent connections while listening to a stream, preventing users from being able to connect.
To Reproduce
Unknown; this appears to be regardless of circumstance. Identified on multiple independently operating radios with a variety of different mounts. Eventually, the server just starts rejecting connections. Comes back eventually, too.
Expected behavior
200, connect to stream.
Relevant Logs
WARN connection/_handle_get_request server client limit reached (250/251) for 172.19.0.6
This appears in the Icecast Error Log several thousand times.
Screenshots
Device(s):
Irrelevant per testing.
Additional context
We have some amount of additional HTTP basic auth in front of radio endpoints, but this does not appear to be related. NGINX auth proxy stands in front, but does not use any workers. Other services depending on our radios use shield-caching reverse proxies, but do not generate more than four connections total.
 VTCAKAVSMoACE
All 23 comments
We have some amount of additional HTTP basic auth in front of radio endpoints, but this does not appear to be related.
Have you tried disabling this? Is it reproducible on a standard configuration out-of-the-box? The authorization header may also be messing with Icecast as that's getting passed through (maybe try stripping it before handing it back to Icecast... not sure what the side-effects with that will be though).
So far the only issues I can find from upstream is authorization shenanigans.
 CodeSteele
on 1 May 2020
CodeSteele
on 1 May 2020
We strip the auth headers. We have no special configuration other than the NGINX proxy, behaviour persists even when using SSH tunnelling to the host (host is not accessible except through proxy).
VTCAKAVSMoACE
on 1 May 2020
For reference, here is the proxy configuration:
server {
    listen 443  ssl;
    ssl_certificate /etc/letsencrypt/live/xxx.xxx.xxx.xxx-0001/fullchain.pem; # managed by Certbot
    ssl_certificate_key /etc/letsencrypt/live/xxx.xxx.xxx.xxx-0001/privkey.pem; # managed by Certbot

    server_name xxx.xxx.xxx.xxx; # managed by Certbot

    add_header X-XSS-Protection 1;
    add_header X-Content-Type-Options nosniff;
    add_header Referrer-Policy no-referrer-when-downgrade;

    client_max_body_size 50M;

    location ~* ^/api/(.*)/request/(.*)$ {
        auth_basic            off;
        proxy_send_timeout        21600;
        proxy_read_timeout        21600;

        proxy_set_header Host xxx.xxx.xxx.xxx;
        proxy_set_header X-Forwarded-Proto $scheme;
        proxy_set_header X-Real-IP $remote_addr;
        proxy_set_header X-Forwarded-For $remote_addr;

        sub_filter_types application/json;
        sub_filter 'http:\/\/xxx.xxx.xxx.xxx' 'https:\/\/xxx.xxx.xxx.xxx';
        sub_filter 'http:\/\/web\/' 'https:\/\/xxx.xxx.xxx.xxx\/';
        sub_filter 'https:\/\/web\/' 'https:\/\/xxx.xxx.xxx.xxx\/';
        sub_filter_once off;

        proxy_pass http://xxx.xxx.xxx.xxx/api/$1/request/$2$is_args$args;
    }

    location ~* ^/api/(.*)$ {
        auth_basic            off;
        proxy_send_timeout        21600;
        proxy_read_timeout        21600;

        proxy_set_header Host xxx.xxx.xxx.xxx;
        proxy_set_header X-Forwarded-Proto $scheme;
        proxy_set_header X-Real-IP $remote_addr;
        proxy_set_header X-Forwarded-For $remote_addr;

        sub_filter_types application/json;
        sub_filter 'http:\/\/xxx.xxx.xxx.xxx' 'https:\/\/xxx.xxx.xxx.xxx';
        sub_filter 'http:\/\/web\/' 'https:\/\/xxx.xxx.xxx.xxx\/';
        sub_filter 'https:\/\/web\/' 'https:\/\/xxx.xxx.xxx.xxx\/';
        sub_filter_once off;

        proxy_pass http://xxx.xxx.xxx.xxx/api/$1$is_args$args;
    }

    location ~* ^/static/(.*)$ {
        auth_basic            off;
        proxy_send_timeout        21600;
        proxy_read_timeout        21600;

        proxy_set_header Host xxx.xxx.xxx.xxx;
        proxy_set_header X-Forwarded-Proto $scheme;
        proxy_set_header X-Real-IP $remote_addr;
        proxy_set_header X-Forwarded-For $remote_addr;

        sub_filter_types application/json;
        sub_filter 'http:\/\/xxx.xxx.xxx.xxx' 'https:\/\/xxx.xxx.xxx.xxx';
        sub_filter 'http:\/\/web\/' 'https:\/\/xxx.xxx.xxx.xxx\/';
        sub_filter 'https:\/\/web\/' 'https:\/\/xxx.xxx.xxx.xxx\/';
        sub_filter_once off;

        proxy_pass http://xxx.xxx.xxx.xxx/static/$1$is_args$args;
    }

    # Reverse proxy all possible radio listening ports (8000, 8010...8480, 8490)
    location ~* ^/radio/(.*)$ {
        satisfy any;

        allow 99.229.38.144;
        deny  all;

        auth_basic                "Radio Access";
        auth_basic_user_file      /etc/nginx/.radio_htpasswd;
        proxy_buffering           off;
        proxy_next_upstream       error timeout invalid_header;
        proxy_redirect            off;
        proxy_connect_timeout     60;
        proxy_send_timeout        21600;
        proxy_read_timeout        21600;

        proxy_set_header Authorization "";

        proxy_set_header Host xxx.xxx.xxx.xxx;
        proxy_set_header X-Forwarded-Proto $scheme;
        proxy_set_header X-Real-IP $remote_addr;
        proxy_set_header X-Forwarded-For $remote_addr;

        proxy_pass http://xxx.xxx.xxx.xxx/radio/$1$is_args$args;
    }

    location ~* ^/(.*)$ {
        auth_basic "Admin Access";
        auth_basic_user_file /etc/nginx/.htpasswd;
        proxy_send_timeout        21600;
        proxy_read_timeout        21600;

        proxy_set_header Host xxx.xxx.xxx.xxx;
        proxy_set_header X-Forwarded-Proto $scheme;
        proxy_set_header X-Real-IP $remote_addr;
        proxy_set_header X-Forwarded-For $remote_addr;

        proxy_set_header Authorization "";

        proxy_pass http://xxx.xxx.xxx.xxx/$1$is_args$args;
    }

    # deny access to .htaccess files, if Apache's document root
    # concurs with nginx's one
    #
    location ~ /\.ht {
        deny all;
    }


}
server {
    if ($host = xxx.xxx.xxx.xxx) {
        return 301 https://$host$request_uri;
    } # managed by Certbot

    if ($host = issues.collegemusic.co.uk) {
        return 301 https://$host$request_uri;
    }

    listen 80;
    server_name xxx.xxx.xxx.xxx;
    return 404; # managed by Certbot
}
Obviously, the most relevant section is the radios.
Of note, the reason I believe this not to be upstream is that this behaviour is coming from a docker instance itself. Referring back to the log entry:
WARN connection/_handle_get_request server client limit reached (250/251) for 172.19.0.6
This appears even with no other users accessing the service.
VTCAKAVSMoACE
on 1 May 2020
It is also worth mentioning that our service has been running for several years (since late 2018) with no issue until recently. In that time, the proxy configuration has not changed.
VTCAKAVSMoACE
on 1 May 2020
Do you have a first date that this started happening on? Maybe we can pin it down to a specific change on our side/pulling KH from upstream.
CodeSteele
on 1 May 2020
We performed an update April 21st. That being said, the service had gone without updates since at least May 2019 (due to high uptime demands), so I can't really narrow it down for you very much.
Is there a way I can perform debugging on my end to determine what is generating these connections? I'm fairly handy with C/C++ and fixing this is pretty much my assignment for now.
VTCAKAVSMoACE
on 1 May 2020
for id in $(docker ps -a -q); do docker inspect --format '{{.Name}} -- {{range .NetworkSettings.Networks}}{{.IPAddress}}{{end}}' $id; done
Dropping that will at least let us know where 172.19.0.6 resides, I'm pondering where to go from there though to figure out why the connection limit is being hit (assuming that's not actually expected of course).
CodeSteele
on 1 May 2020
It's certainly not expected. We restrict by both IP and authentication, only provide service to a couple of specific shield-caching proxies for other services.
~ $ for id in $(docker ps -a -q); do docker inspect --format '{{.Name}} -- {{range .NetworkSettings.Networks}}{{.IPAddress}}{{end}}' $id; done
/azuracast_web -- 172.20.0.6
/azuracast_stations -- 172.20.0.5
/azuracast_influxdb_1 -- 172.20.0.4
/azuracast_redis_1 -- 172.20.0.2
/azuracast_mariadb_1 -- 172.20.0.3
Looks like it's the web frontend making these calls.
VTCAKAVSMoACE
on 1 May 2020
Hmm we updated to the latest Icecast on the 23rd, so it can't be that... hmm.
CodeSteele
on 1 May 2020
First place you can look -- go to the admin panel of Icecast (admins should be able to circumvent the limit on clients) and check the client list on your mount points, what do you see?
CodeSteele
on 1 May 2020
(You'll probably see all of them being from the web host, but what do you see for clients? Are they uniform? Are they all the shield-caching proxies?)
CodeSteele
on 1 May 2020
According to this the only thing that we get limited on should be client streams -- any chance those caching proxies aren't actually caching and are just proxying every request through and you're just hitting the per-client limit?
The thing that makes me believe this: even if AzuraCast was doing something awful like using all 250 connections via admin requests -- that would mean that the proxies would have to be requesting _new_ connections after we hit that to be hitting that limit, instead of holding that one connection they got at the start of the stream and just holding onto/multiplexing it.
CodeSteele
on 1 May 2020
Hmm however my small instance l noticed my client_connections counter climbing pretty fast for it just being me, I'll continue looking on our side too.
CodeSteele
on 1 May 2020
They are uniform, just the clients and my testing. I have verified that it is successfully shielding. That said, I'll look into whether or not it's generating new connections for some reason rather than persisting a single one and relaying it out.
Behaviour persists with latest update (just tested).
VTCAKAVSMoACE
on 1 May 2020
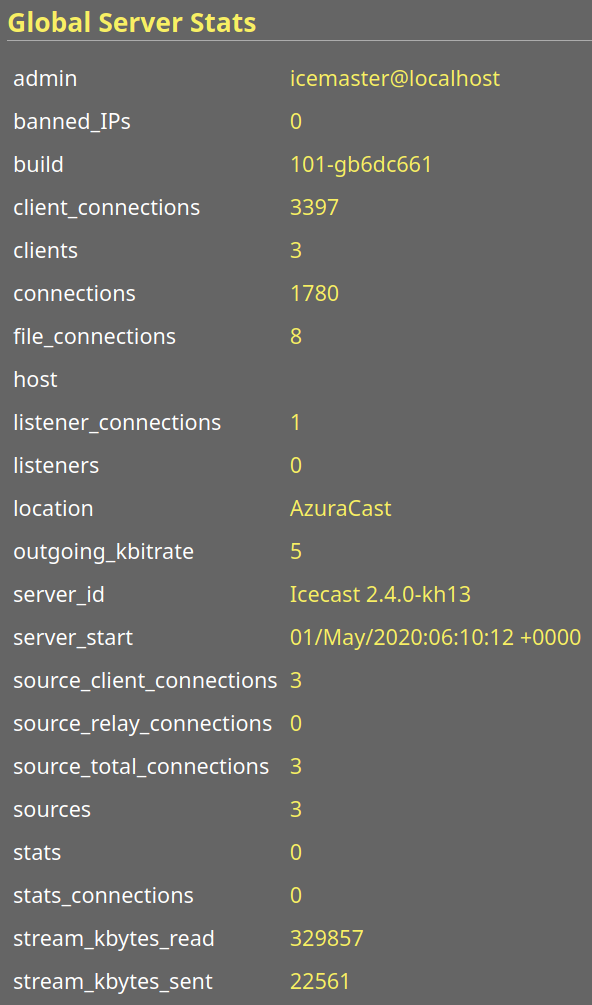
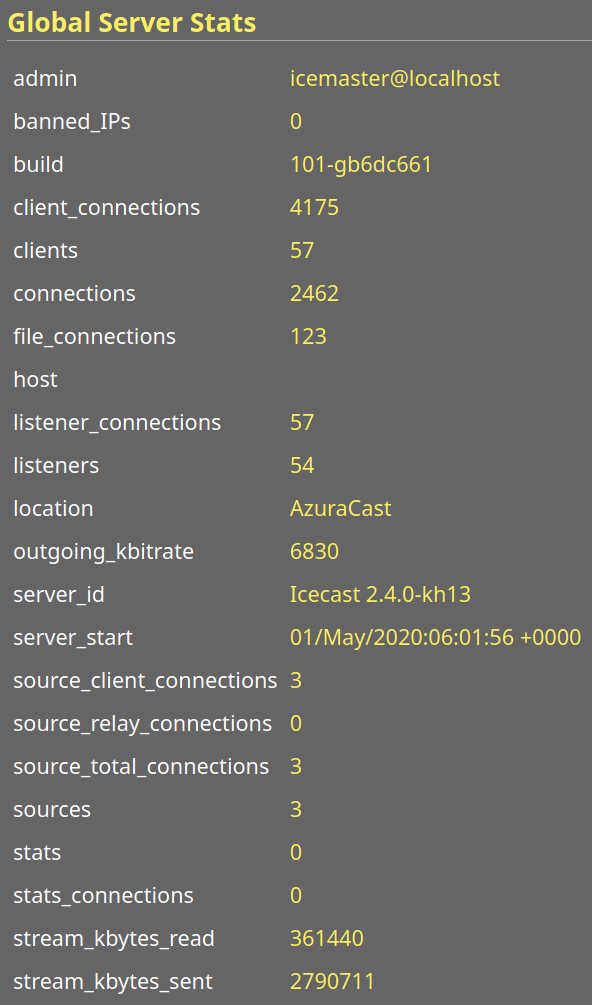
Can you get me a screenshot of your global server stats from your Icecast admin page? I'm interested in the connection stat breakdown.
CodeSteele
on 1 May 2020
VTCAKAVSMoACE
on 1 May 2020
VTCAKAVSMoACE
on 1 May 2020
These two streams are the most relevant (others don't have any users). Second one has an active relay, interesting that it's spawning so many listener connections like this given that my access log on NGINX only reports one.
VTCAKAVSMoACE
on 1 May 2020
That's still only 60/250, are you no longer getting the warnings at the time of those screenshots?
CodeSteele
on 1 May 2020
Not currently, no, but it does fluctuate seemingly independently of how many users there actually are. Generally unpredictable as to when the service will be unavailable.
VTCAKAVSMoACE
on 1 May 2020
See if you can get me those screenshots next time it happens or around the time -- I wanna see where the additional 200 connections are coming from -- if they're showing as listeners take a snap of your clients listing page.
CodeSteele
on 1 May 2020
Following up, it looks like this may actually be upstream from us, too -- I'm reaching out to one of the groups who fetches from us to make sure they're not using direct proxying. They may have updated and changed their own infrastructure. I noticed that even though the administration page reports 1 listener, I can identify there are multiple instances of that listener.
In the meantime, I have permitted more listeners than will feasibly use our service and we'll take the direct proxy for now. There does appear to be some minor duplication of listeners, but nothing as previously believed. This is suspected to be an upstream error and we'll let you know if the behaviour persists even after working with our upstream.
VTCAKAVSMoACE
on 1 May 2020
I'm not going to reopen this issue yet, but I actually had a full crash now -- file descriptor limit was hit.
There's no way there was that many connections in reality. While, yes, the upstream proxy was misconfigured, it _also_ appears that Icecast might be failing to close sockets or fds appropriately, leading to our original problem with smaller cases.
I'm gonna hammer down exactly what caused the crash and get back to you before I reopen this.
VTCAKAVSMoACE
on 2 May 2020
Related issues
 frozenplaya
·
4Comments
frozenplaya
·
4Comments
 bo2008
·
3Comments
bo2008
·
3Comments
 Vaalyn
·
4Comments
Vaalyn
·
4Comments
 ErnestPH
·
3Comments
ErnestPH
·
3Comments
 Tolarion
·
4Comments
Tolarion
·
4Comments