Ax: `plot_slice` showing an unexpected arm(?)
Hello!
I was experimenting with the ax.plot.slice.plot_slice function as seen in this visualization tutorial, but I found that when I call plot_slice, the resulting visualization displays a point with an error bar (maybe an arm?) even though I did not put in any parameter for generator_runs_dict. I was wondering what this could be (I do not have a status quo arm) since I do not see it in the above-mentioned tutorial (I am using ax version 0.1.20, so maybe there was an update for this after the tutorial was published).
this is not a fully reproducible example, but I called render(plot_slice(model, "x0", "score")) where the model has a search space of 5 ordered categorical variables and one integer variable (which is plotted), and the plot showed:
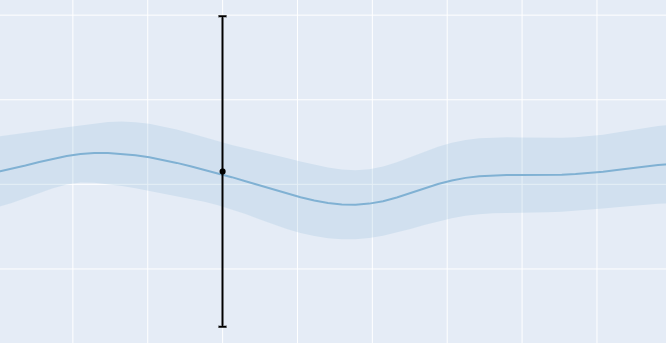
where I cannot really interpret the black point and errorbar.
Also, is there a way to use the slice plots (or the contour plots) on ordered categorical variables (I guess it will be closer to the line plot with error bars than a continuous plot)? I think I read somewhere that they are internally treated as integer variables, so I guess I can use it by changing the search space a bit, but I wanted to see if there is an alternative option.
One more thing, is there a way to show the observations on the slice plots? I guess generator_runs_dict can kind of do it, but I was wondering if there is an easier way to do it, as the contour plots.
Sorry for packing in a lot of things in an issue, and thanks so much in advance!
 nwrim
nwrim
All 2 comments
Hi Nwrim- Wanted to let you know we've received this issue and will have a response for you shortly!
 Jakepodell
on 5 May 2021
Jakepodell
on 5 May 2021
Hi @nwrim, this likely seems to be a bug, we will investigate and get back to you.
 lena-kashtelyan
on 5 May 2021
lena-kashtelyan
on 5 May 2021
Related issues
 dqii
·
5Comments
dqii
·
5Comments
 ksanjeevan
·
3Comments
ksanjeevan
·
3Comments
 wooohoooo
·
4Comments
wooohoooo
·
4Comments
 newtonle
·
3Comments
newtonle
·
3Comments
 richarddwang
·
4Comments
richarddwang
·
4Comments
Most helpful comment
Hi Nwrim- Wanted to let you know we've received this issue and will have a response for you shortly!