Awx: HARAKIRI: failed to download job events
ISSUE TYPE
- Bug Report
SUMMARY
- The download of job events fails with a 504 server error. awx_web container logs a HARAKIRI message.
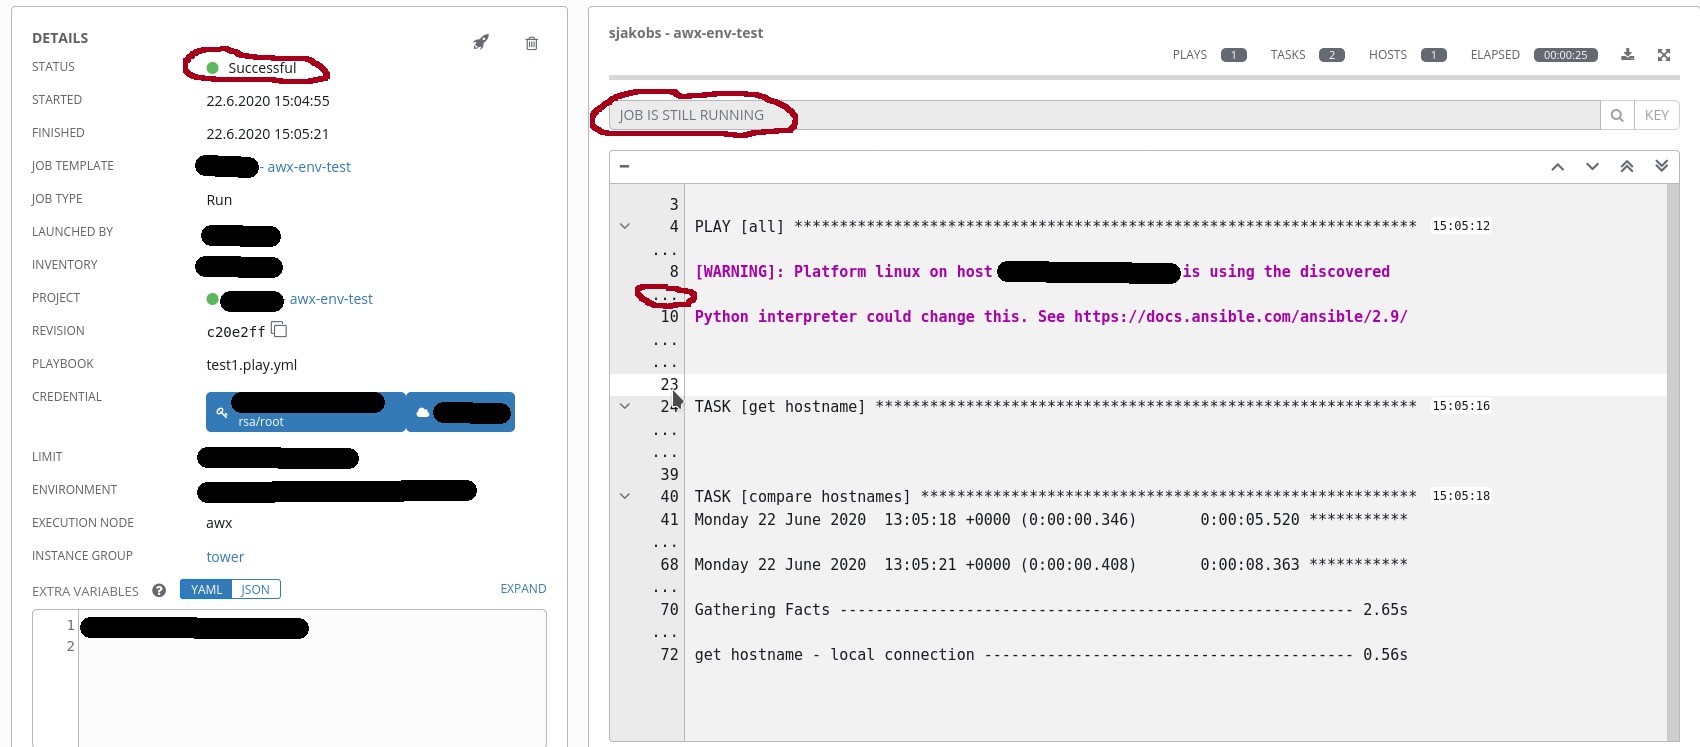
- Job event view in the UI shows only a subset of all events
- Job event view in the UI doesn't update while the job is running.
ENVIRONMENT
- AWX version: 11.2.0
- AWX install method: docker
- Ansible version: 2.9.9
- Operating System: Debian 10
- Web Browser: Firefox 77
STEPS TO REPRODUCE
Start a job from a template; the UI will switch to the event view and stay blank unless the page will be reloaded manually. Then it will show the actual page of events, but no previous page. After the job has finished only the last page of events will be shown. Downloading the events fails with a "504 Gateway Time-out".
EXPECTED RESULTS
- The event view should update periodically
- Downloading the events as txt file should happen in a couple of seconds
ACTUAL RESULTS
- The event view doesn't update.
- Downloading the events as txt file results in a server error.
ADDITIONAL INFORMATION
- https://awx.example.com/api/v2/jobs/53694/stdout/?format=txt_download => "504 Gateway Time-out"
- There are approx. 10^7 events in the main_jobevent table.
- I'm not sure if this is related, but querying the job events directly from the database takes minutes:
awx=# EXPLAIN ANALYZE select counter, start_line, end_line  from main_jobevent where job_id=53632;
                                                                     QUERY PLAN
--------------------------------------------------------------------------------------------
 Bitmap Heap Scan on main_jobevent  (cost=63.14..7692.79 rows=1954 width=12) (actual time=989143.743..991190.293 rows=66 loops=1)
   Recheck Cond: (job_id = 53632)
   Rows Removed by Index Recheck: 7090093
   Heap Blocks: lossy=1193612
   ->  Bitmap Index Scan on main_jobevent_job_id_brin_idx  (cost=0.00..62.66 rows=1954 width=0) (actual time=152.715..152.715 rows=11937280 loops=1)
         Index Cond: (job_id = 53632)
 Planning time: 1.974 ms
 Execution time: 991190.501 ms
(8 rows)
- It seems the following postgresql command runs for a couple of minutes, and only after this command has finished the job events show up as finished and are all visible:
SELECT COUNT(*) AS "__count" FROM "main_jobevent" WHERE ("main_jobevent"."job_id" = 53694 AND "main_jobevent"."counter" >= 1 AND "main_jobevent"."counter" <= 3)
EXPLAIN ANALYZE SELECT COUNT(*) AS "__count" FROM "main_jobevent" WHERE ("main_jobevent"."job_id" = 53694 AND "main_jobevent"."counter" >= 1 AND "main_jobevent"."counter" <= 3);
QUERY PLAN
--------------------
 Aggregate  (cost=7702.10..7702.11 rows=1 width=8) (actual time=553788.467..553788.467 rows=1 loops=1)
   ->  Bitmap Heap Scan on main_jobevent  (cost=62.66..7702.09 rows=5 width=0) (actual time=553638.265..553788.446 rows=3 loops=1)
         Recheck Cond: (job_id = 53694)
         Rows Removed by Index Recheck: 7087826
         Filter: ((counter >= 1) AND (counter <= 3))
         Rows Removed by Filter: 63
         Heap Blocks: lossy=1193304
         ->  Bitmap Index Scan on main_jobevent_job_id_brin_idx  (cost=0.00..62.66 rows=1954 width=0) (actual time=281.652..281.653 rows=11933440 loops=1)
               Index Cond: (job_id = 53694)
 Planning time: 0.326 ms
 Execution time: 553788.642 ms
(11 rows)


md5-2acefd83fa8112dc245a2accee3f097e


UPDATE "main_jobevent" SET "changed" = true WHERE ("main_jobevent"."job_id" = 53694 AND "main_
jobevent"."uuid" IN (SELECT DISTINCT U0."parent_uuid" FROM "main_jobevent" U0 WHERE (U0."job_id" = 53694 AND U0."changed" = true AND NO
T (U0."parent_uuid" IS NULL))))
 anxstj
All 6 comments
@anxstj,
You could argue that what you're encountering here is a version of https://github.com/ansible/awx/issues/5590
```awx=# EXPLAIN ANALYZE select counter, start_line, end_line from main_jobevent where job_id=53632;
QUERY PLAN
Bitmap Heap Scan on main_jobevent (cost=63.14..7692.79 rows=1954 width=12) (actual time=989143.743..991190.293 rows=66 loops=1)
Recheck Cond: (job_id = 53632)
Rows Removed by Index Recheck: 7090093
Heap Blocks: lossy=1193612
-> Bitmap Index Scan on main_jobevent_job_id_brin_idx (cost=0.00..62.66 rows=1954 width=0) (actual time=152.715..152.715 rows=11937280 loops=1)
Index Cond: (job_id = 53632)
Planning time: 1.974 ms
Execution time: 991190.501 ms
(8 rows)
```
That said, a simple count query using an index scan on 11 million rows shouldn't be taking anywhere near...is that 15 minutes? What type of hardware and resources have you allocated to your database? With a dataset of your size, you may need to throw some system resources at this or spend some time tuning your postgres.
 ryanpetrello
on 23 Jun 2020
ryanpetrello
on 23 Jun 2020
It's a dedicated VM only for the Postgresql database with 4 GB RAM and 4 [email protected] GHz.
Forcing Postgresql to use an index scan (SET SESSION enable_bitmapscan=false) will cause the query to be finished in 5 ms. So I really don't know why Postgresql chooses a heap scan for that query.
The behaviour started sometime last week, and we didn't change anything on the infrastructure. So I suspect that the row count of the main_jobevent table tripped above a threshold which caused the change in the query plan (from index scan to heap scan and from 5 ms to 5 min). Unfortunately I don't have a monitoring of the table size, so I can only guess.
The next step would be to cleanup the event logs (awx-manage cleanup_jobs) day by day and check if the query plan changes. Or do you have any other/better idea?
anxstj
on 23 Jun 2020
Forcing Postgresql to use an index scan (SET SESSION enable_bitmapscan=false) will cause the query to be finished in 5 ms
Ouch. Yea, I'm very interested in why postgres is choosing a heap scan here.
ryanpetrello
on 23 Jun 2020
@anxstj,
The behaviour started sometime last week, and we didn't change anything on the infrastructure. So I suspect that the row count of the main_jobevent table tripped above a threshold which caused the change in the query plan (from index scan to heap scan and from 5 ms to 5 min)
I'll try to reproduce something like this on my end. I do know, however, that there are users that are managing AWX and Red Hat Ansible Tower installs with literally hundreds off millions (in some cases a billion+) of distinct event rows, and I haven't seen reports of _this_ particular issue.
Part of me also wonders if there's any query planner optimizations hiding somewhere in newer versions of postgres (AWX is on 10, which is quite old now).
ryanpetrello
on 23 Jun 2020
The database was running on Postgresql 9.6. I upgraded it to 10 and now postgresql uses an indexscan again. So the error is gone.
With 9.6 I tested how many rows I need to delete until the indexscan was used again. I had to remove 1,600,000 (+/- 250,000) rows which left 8,200,000 rows in the main_jobevent table.
I made a clone from the database if there is anything you like to have checked or tried to reproduce.
But I guess you can close this issue, as it was caused by an unsupported configuration.
anxstj
on 29 Jun 2020
Hey @anxstj,
Thanks for digging - if you spot anything like this in pg10 (or above), let me know and I'll dig in a bit further.
ryanpetrello
on 29 Jun 2020
Related issues
 pebbledavec
·
3Comments
pebbledavec
·
3Comments
 darkaxl
·
3Comments
darkaxl
·
3Comments
 icsm2017
·
4Comments
icsm2017
·
4Comments
 kakkotetsu
·
3Comments
kakkotetsu
·
3Comments
 gamuniz
·
3Comments
gamuniz
·
3Comments
Most helpful comment
The database was running on Postgresql 9.6. I upgraded it to 10 and now postgresql uses an indexscan again. So the error is gone.
With 9.6 I tested how many rows I need to delete until the indexscan was used again. I had to remove 1,600,000 (+/- 250,000) rows which left 8,200,000 rows in the main_jobevent table.
I made a clone from the database if there is anything you like to have checked or tried to reproduce.
But I guess you can close this issue, as it was caused by an unsupported configuration.