Awesome: Memory consumption increases over time, doesn't go down
Output of awesome --version:
awesome v4.2-17-g28860953 (Human after all)
 • Compiled against Lua 5.3.4 (running with Lua 5.3)
 • D-Bus support: ✔
 • execinfo support: ✔
 • xcb-randr version: 1.5
 • LGI version: 0.9.1
How to reproduce the issue:
Just run awesomeWM with my config: https://pastebin.com/cNi92pKQ
Should be noted that the config also has this snippet (I dunno if it works though):
local t = timer({ timeout = 600 })
t:connect_signal("timeout", function()
                    collectgarbage("collect")
                    print(os.date(), "Lua memory usage:", collectgarbage("count"))
                    print("Objects alive:")
                    for name, obj in pairs{ button = button, client = client, drawable = drawable, drawin = drawin, key = key, screen = screen, tag = tag } do
                       print(name, obj.instances())
                    end
end)
t:start()
t:emit_signal("timeout")
Some notes to help increase the memory fast:
- Constantly resize windows
- Rapidly change music in the MPD widget
Actual result:
Memory keeps increasing, and incresing... AwesomeWM starts roughly at 25MB-30MB. With time (some minutes) it can go to up to 80MB-90MB.
In 20 minutes I achieved this:

Expected result:
AwesomeWM memory comsuption should stay at 25MB-30MB. Probably just a little above that.
 RomeuG
All 28 comments
Sorry, I just have time for two questions right now:
- What does your debug-print produce? Does the number of object instances increase over time? Does Lua's memory usage increase over time?
- The biggest difference that I see between your config and the default config is
require("lain"). Does the problem also happen without lain? (e.g. with the default config, or with your config, but all lain-using widgets andrequire("lain")removed)
Also, do you know about Xephyr? You can run a new awesome session in a window via Xephyr :1 -screen 1024x768 & sleep 1 ; DISPLAY=:1 awesome. This "awesome in a window" can then be left alone for a while just to see how its memory usage develops while you can continue to use your computer normally.
 psychon
on 4 Aug 2017
psychon
on 4 Aug 2017
Also, your config does not work:
error: /tmp/rc.lua.increased.memory:168: attempt to index a nil value (field 'widgets')
There is no lain.widgets; I can only see lain.widget in lain 0ef78642276735127d2206be184c1e071ad6b0ed.
P.S.: Okay, despite my "no time right now", I tried to run it.
psychon
on 4 Aug 2017
Hello! And sorry for this long post, I tried to test everything I could to help you!
About Lain widgets, It's probably the version I am using, because my configuration
works.
I tried to run awesome without any configuration, and I noticed something:
- Memory increased fast when moving a window up and down, very fast, with the resizing lines appearing. Never decreases.
- While writing this, it is now at 72MB, according to
smem.
I tried my awesome configuration with Xephyr. Memory usage increases even without playing around in the WM. It seems
collectgarbage() is being called, but memory does not decrease. The output in the beginning of awesomeWM was:
Fri Aug  4 08:40:23 2017    Lua memory usage:   2448.9345703125
Objects alive:
drawin  1
key 332
drawable    1
button  84
client  0
screen  1
tag 9
After collectgarbage() was called:
Fri Aug  4 08:50:23 2017    Lua memory usage:   10115.618164062
Objects alive:
drawin  1
key 332
drawable    1
button  332
client  2
screen  1
tag 9
Funny because button went from 84 to 332, I dunno what that means though.
After all this, I added the collectgarbage() snippet I did show you in the original post to the default configuration and ran Xephyr again.
I also did not play around in the WM in this Xephyr session.
In the beginning it did output this:
Fri Aug  4 08:58:11 2017    Lua memory usage:   2655.439453125
Objects alive:
tag 9
key 296
drawin  2
client  0
drawable    2
button  108
screen  1
After collectgarbage() was called:
Fri Aug  4 09:08:11 2017    Lua memory usage:   3444.2392578125
Objects alive:
tag 9
key 296
drawin  2
client  0
drawable    2
button  324
screen  1
According to Lua memory usage, the memory went up, but smem didn't show almost any increase.
Then, in the same Xephyr session, I started moving a terminal window up and down very fast for 30 seconds, to make the memory usage increase.
Then I closed the terminal window.
The collectgarbage() call did output this after that:
Fri Aug  4 09:20:14 2017    Lua memory usage:   3649.4375
Objects alive:
drawable    3
button  324
client  0
key 296
screen  1
drawin  3
tag 9
The difference from the previous one is that drawable is now 3. And again Lua memory usage shows a bit of an increase, but smem tells me
otherwise. I honestly do not know what to believe.
Some conclusions now:
- Default config:
smemstays the same,Lua memory usagegoes up a bit. - Default config with moving window:
smemgoes up by a lot,Lua memory usagegoes up a bit more. - My config:
smemgoes up by a lot,Lua memory usagegoes up by a lot too (10000). - My config with moving window:
smemgoes up by a lot a lot faster now. Collectgarbage()doesn't really do that much?
RomeuG
on 4 Aug 2017
I did a quick look through the lain version that I cloned earlier and didn't spot anything weird. In fact, the only things from lain that could run when resizing a client are its new layouts, but you don't seem to be using those. You don't have titlebars either. So, what code could possibly run when a client is resized?!?
psychon
on 4 Aug 2017
Ok, here is my configuration compatible with the new version of Lain:
Also, please have a look at this
Memory increased fast when moving a window up and down, very fast, with the resizing lines appearing. Never decreases.
It seems a lot more effective than any other methods of increasing memory. I can increase like 5MB in just 2 seconds (according to smem).
EDIT:
Basically you just move a window up and down very fast, and the red lines showing how the window will be resized must show.
RomeuG
on 4 Aug 2017
I've tried looking into this and i got the same result when i snap to edge it does increase memory usage and it seems to never get freed
 0x041E
on 4 Aug 2017
0x041E
on 4 Aug 2017
Hm, fails to reproduce here. Or I am doing something wrong...?
psychon
on 4 Aug 2017
Ok, just uploaded a terribly big gifv for you. Check the memory consumption of awesome with PID 31999.
RomeuG
on 4 Aug 2017
Oh. Whoops. Thanks. :-)
Found something. Running under valgrind --tool=massif, the last detailed memory usage snapshot begins with:
 90 48,830,518,395       81,082,376       78,645,096     2,437,280            0
96.99% (78,645,096B) (heap allocation functions) malloc/new/new[], --alloc-fns, etc.
->78.62% (63,748,748B) 0xA0EB898: _pixman_bits_image_init (pixman-bits-image.c:935)
| ->78.62% (63,748,748B) 0xA0EB941: create_bits_image_internal (pixman-bits-image.c:1005)
|   ->78.62% (63,748,748B) 0x71EE945: _cairo_image_surface_create_with_pixman_format (cairo-image-surface.c:347)
|     ->78.50% (63,646,016B) 0x420D5F: xwindow_get_shape (xwindow.c:334)
|     | ->78.50% (63,646,016B) 0x42E91B: luaA_drawin_get_shape_bounding (drawin.c:636)
|     |   ->78.50% (63,646,016B) 0x4236D9: luaA_class_index (luaclass.c:469)
|     |     ->78.50% (63,646,016B) 0x801C30E: ??? (in /usr/lib64/liblua-5.3.so)
|     |       ->78.50% (63,646,016B) 0x801C5E1: ??? (in /usr/lib64/liblua-5.3.so)
|     |         ->78.50% (63,646,016B) 0x802F41A: ??? (in /usr/lib64/liblua-5.3.so)
|     |           ->78.50% (63,646,016B) 0x8032EDE: ??? (in /usr/lib64/liblua-5.3.so)
|     |             ->78.50% (63,646,016B) 0x801C5ED: ??? (in /usr/lib64/liblua-5.3.so)
|     |               ->78.50% (63,646,016B) 0x802F41A: ??? (in /usr/lib64/liblua-5.3.so)
|     |                 ->78.50% (63,646,016B) 0x8032719: ??? (in /usr/lib64/liblua-5.3.so)
|     |                   ->78.50% (63,646,016B) 0x801C5ED: ??? (in /usr/lib64/liblua-5.3.so)
|     |                     ->78.50% (63,646,016B) 0x801C63F: ??? (in /usr/lib64/liblua-5.3.so)
|     |                       ->78.50% (63,646,016B) 0x801BA20: ??? (in /usr/lib64/liblua-5.3.so)
|     |                         ->78.50% (63,646,016B) 0x801C95B: ??? (in /usr/lib64/liblua-5.3.so)
|     |                           ->78.50% (63,646,016B) 0x801310F: lua_pcallk (in /usr/lib64/liblua-5.3.so)
|     |                             ->76.16% (61,754,880B) 0x424C34: luaA_object_emit_signal (lualib.h:75)
|     |                             | ->76.16% (61,754,880B) 0x42EC89: drawin_moveresize (drawin.c:262)
|     |                             |   ->76.16% (61,754,880B) 0x430453: luaA_drawin_geometry (drawin.c:479)
|     |                             |     ->76.16% (61,754,880B) 0x801C30E: ??? (in /usr/lib64/liblua-5.3.so)
|     |                             |       ->76.16% (61,754,880B) 0x8032142: ??? (in /usr/lib64/liblua-5.3.so)
|     |                             |         ->76.16% (61,754,880B) 0x801C5ED: ??? (in /usr/lib64/liblua-5.3.so)
|     |                             |           ->76.16% (61,754,880B) 0x801C63F: ??? (in /usr/lib64/liblua-5.3.so)
|     |                             |             ->76.16% (61,754,880B) 0x801BA20: ??? (in /usr/lib64/liblua-5.3.so)
|     |                             |               ->76.16% (61,754,880B) 0x801C95B: ??? (in /usr/lib64/liblua-5.3.so)
|     |                             |                 ->76.16% (61,754,880B) 0x801310F: lua_pcallk (in /usr/lib64/liblua-5.3.so)
|     |                             |                   ->76.16% (61,754,880B) 0x413198: event_handle_mousegrabber (lualib.h:75)
|     |                             |                     ->76.16% (61,754,880B) 0x4149CF: event_handle (event.c:548)
|     |                             |
|     |                             ->02.33% (1,891,136B) 0x413198: event_handle_mousegrabber (lualib.h:75)
|     |                               ->02.33% (1,891,136B) 0x4149CF: event_handle (event.c:548)
|     |                                 ->02.33% (1,891,136B) 0x40EAED: a_glib_poll (awesome.c:385)
|     |                                   ->02.33% (1,891,136B) 0x551C164: g_main_context_iterate.isra.24 (gmain.c:4228)
|     |                                     ->02.33% (1,891,136B) 0x551C4F0: g_main_loop_run (gmain.c:4125)
|     |                                       ->02.33% (1,891,136B) 0x4100D8: main (awesome.c:833)
|     |
|     ->00.13% (102,732B) in 1+ places, all below ms_print's threshold (01.00%)
|
->14.07% (11,409,552B) 0x8022EFF: ??? (in /usr/lib64/liblua-5.3.so)
So, almost 80% of memory us inside of cairo image surfaces that were created since "something" queried the shape of a client. Sigh, that's gonna be fun.
psychon
on 4 Aug 2017
Well, at least we already got something here :)
RomeuG
on 4 Aug 2017
Could you test the following patch?
diff --git a/lib/awful/client/shape.lua b/lib/awful/client/shape.lua
index ec1d3f6..636600d 100644
--- a/lib/awful/client/shape.lua
+++ b/lib/awful/client/shape.lua
@@ -51,6 +51,8 @@ function shape.get_transformed(c, shape_name)
         cr:set_source_surface(shape_img, border + l, border + t)
         cr:rectangle(border + l, border + t, geom.width - l - r, geom.height - t - b)
         cr:fill()
+
+        shape_img:finish()
     end

     if _shape then
diff --git a/lib/awful/mouse/snap.lua b/lib/awful/mouse/snap.lua
index 5109a1b..e212d12 100644
--- a/lib/awful/mouse/snap.lua
+++ b/lib/awful/mouse/snap.lua
@@ -66,6 +66,7 @@ local function show_placeholder(geo)
     cr:stroke()

     placeholder_w.shape_bounding = img._native
+    img:finish()

     placeholder_w.visible = true
 end
diff --git a/lib/awful/tooltip.lua b/lib/awful/tooltip.lua
index 74a03b6..5978ce5 100644
--- a/lib/awful/tooltip.lua
+++ b/lib/awful/tooltip.lua
@@ -137,6 +137,7 @@ local function apply_shape(self)
     s(cr, w, h, unpack(self._private.shape_args or {}))
     cr:fill()
     wb.shape_bounding = img._native
+    img:finish()

     -- The wibox background uses ARGB32 border so tooltip anti-aliasing works
     -- when an external compositor is used. This will look better than
diff --git a/lib/gears/surface.lua b/lib/gears/surface.lua
index 1edfcd1..3bdd460 100644
--- a/lib/gears/surface.lua
+++ b/lib/gears/surface.lua
@@ -204,6 +204,7 @@ function surface.apply_shape_bounding(draw, shape, ...)
   cr:fill()

   draw.shape_bounding = img._native
+  img:finish()
 end

 local function no_op() end
diff --git a/lib/wibox/init.lua b/lib/wibox/init.lua
index b2c8d6f..f90284a 100644
--- a/lib/wibox/init.lua
+++ b/lib/wibox/init.lua
@@ -272,7 +272,7 @@ local function new(args)
         __newindex = function(self, k,v)
             if rawget(self, "set_"..k) then
                 self["set_"..k](self, v)
-            elseif w[k] ~= nil or force_forward[k] then
+            elseif force_forward[k] or w[k] ~= nil then
                 w[k] = v
             else
                 rawset(self, k, v)
The most relevant part is the change to lib/wibox/init.lua. Previously, this would check if the property to be changed is not nil (i.e.: it exists), or if it was on a special list of exceptions which contains shape_bounding and shape_clip. The patch just changes the order of the two checks, because checking w.shape_bounding ~= nil creates a cairo image surface containing the shape, needlessly.
The rest of the patch just makes sure that cairo image surfaces are deleted when they are no longer needed in all the random places that I could find.
Note that I do not think this helps with the original report from this issue.
psychon
on 4 Aug 2017
You're right that this doesn't help with the original report.
But good news anyways, the patch seems to work. I don't get any memory increase anymore from moving the window to the edges!
RomeuG
on 4 Aug 2017
I tested a new thing on a default configuration.
The WM starts with these stats:
Fri Aug  4 12:39:32 2017    Lua memory usage:   2592.97265625
Objects alive:
client  0
button  108
screen  1
key 296
drawable    2
tag 9
drawin  2
I proceed to open like 50 terminal windows, and close them right after.
smem shows a jump from 10MB to ~100MB.
During the opening and closing of terminals, this also outputs:
2017-08-04 12:39:39 W: awesome: a_glib_poll:432: Last main loop iteration took 0.121933 seconds! Increasing limit for this warning to that value.
2017-08-04 12:39:39 W: awesome: a_glib_poll:432: Last main loop iteration took 0.134548 seconds! Increasing limit for this warning to that value.
2017-08-04 12:39:39 W: awesome: a_glib_poll:432: Last main loop iteration took 0.154149 seconds! Increasing limit for this warning to that value.
2017-08-04 12:39:40 W: awesome: a_glib_poll:432: Last main loop iteration took 0.168101 seconds! Increasing limit for this warning to that value.
2017-08-04 12:39:40 W: awesome: a_glib_poll:432: Last main loop iteration took 0.193086 seconds! Increasing limit for this warning to that value.
2017-08-04 12:39:41 W: awesome: a_glib_poll:432: Last main loop iteration took 0.403892 seconds! Increasing limit for this warning to that value.
2017-08-04 12:39:42 W: awesome: a_glib_poll:432: Last main loop iteration took 0.574058 seconds! Increasing limit for this warning to that value.
After all those actions, the next collectgarbage() outputs this:
Fri Aug  4 12:49:32 2017    Lua memory usage:   21278.497070312
Objects alive:
client  0
button  324
screen  1
key 296
drawable    2
tag 9
drawin  2
Once again, garbage was not collected, and Lua memory usage went from 2592 to 21278.
RomeuG
on 4 Aug 2017
Hm, no luck running under valgrind --tool=massif --trace-children=no. The memory usage graph looks like this:
28.15^      #
     |      #
     |      #
     |      #
     |      #
     |      #
     |      #
     |      #
     |      #
     |   :::#
     |   :  #
     |   :  #
     |   :  #
     |   :  #
     |   :  #
     |   :  #::     : @
     |   :  #: :::::::@::::::::@::::::::::::@::::::::@:::::::@@::@::::@::::@::
     |   :  #: :::: ::@:::::: :@::::: :::: :@: ::: ::@:::: ::@ ::@::::@::::@::
     |  ::  #: :::: ::@:::::: :@::::: :::: :@: ::: ::@:::: ::@ ::@::::@::::@::
     | @::  #: :::: ::@:::::: :@::::: :::: :@: ::: ::@:::: ::@ ::@::::@::::@::
   0 +----------------------------------------------------------------------->Gi
     0                                                                   5.933
I did the following for the measurement:
diff --git a/awesomerc.lua b/awesomerc.lua
index 00d1b60..c421830 100644
--- a/awesomerc.lua
+++ b/awesomerc.lua
@@ -582,3 +586,6 @@ end)
 client.connect_signal("focus", function(c) c.border_color = beautiful.border_focus end)
 client.connect_signal("unfocus", function(c) c.border_color = beautiful.border_normal end)
 -- }}}
+
+awful.spawn({ "sh", "-c", "for x in $(seq 1 50) ; do urxvt -e /bin/sleep 0.1 ; done"})
+awesome.connect_signal("refresh", function() collectgarbage("collect") end)
Without calling collectgarbage("collect"), the graph becomes more interesting:
29.46^                                                                      #
     |      @                                                            :@@#:
     |      @                                                          :::@@#:
     |      @                                                       :@::::@@#:
     |      @                                                    ::::@::::@@#:
     |      @                                  :::             :@::::@::::@@#:
     |      @                               :::::::         ::::@::::@::::@@#:
     |      @                             :::: ::::       :@::::@::::@::::@@#:
     |      @                          @:::::: ::::    ::::@::::@::::@::::@@#:
     |   :::@                        ::@:::::: ::::@:::::::@::::@::::@::::@@#:
     |   :  @                     @::: @:::::: ::::@:::::::@::::@::::@::::@@#:
     |   :  @                  :::@::: @:::::: ::::@:::::::@::::@::::@::::@@#:
     |   :  @          ::   ::::: @::: @:::::: ::::@:::::::@::::@::::@::::@@#:
     |   :  @       ::::: @::: :: @::: @:::::: ::::@:::::::@::::@::::@::::@@#:
     |   :  @     :@:: :::@::: :: @::: @:::::: ::::@:::::::@::::@::::@::::@@#:
     |   :  @:  :::@:: :::@::: :: @::: @:::::: ::::@:::::::@::::@::::@::::@@#:
     |   :  @::::::@:: :::@::: :: @::: @:::::: ::::@:::::::@::::@::::@::::@@#:
     |   :  @::::::@:: :::@::: :: @::: @:::::: ::::@:::::::@::::@::::@::::@@#:
     |  @:  @::::::@:: :::@::: :: @::: @:::::: ::::@:::::::@::::@::::@::::@@#:
     | @@:  @::::::@:: :::@::: :: @::: @:::::: ::::@:::::::@::::@::::@::::@@#:
   0 +----------------------------------------------------------------------->Gi
     0                                                                   5.903
However, all the memory is just used by Lua and not by something we do:
85.77% (26,496,257B) (heap allocation functions) malloc/new/new[], --alloc-fns, etc.
->72.67% (22,450,451B) 0x8022EFF: ??? (in /usr/lib64/liblua-5.3.so)
| ->33.23% (10,264,768B) 0x802DCB9: ??? (in /usr/lib64/liblua-5.3.so)
| | ->22.73% (7,021,440B) 0x802E18C: ??? (in /usr/lib64/liblua-5.3.so)
| | | ->12.43% (3,839,392B) 0x8012D03: lua_rawset (in /usr/lib64/liblua-5.3.so)
| | | | ->09.30% (2,874,432B) 0x8016275: ??? (in /usr/lib64/liblua-5.3.so)
| | | | | ->09.30% (2,874,432B) 0x801C30E: ??? (in /usr/lib64/liblua-5.3.so)
| | | | |   ->07.65% (2,362,432B) 0x8031EE3: ??? (in /usr/lib64/liblua-5.3.so)
| | | | |   | ->07.65% (2,362,432B) 0x801C5ED: ??? (in /usr/lib64/liblua-5.3.so)
| | | | |   |   ->07.64% (2,360,320B) 0x801C63F: ??? (in /usr/lib64/liblua-5.3.so)
So I'd say this is just Lua's GC at work.
psychon
on 4 Aug 2017
Well, you're right. Thing is, you didn't test the way I said.
Using your modification of the rc.lua, memory usage does not even increase! Which is great.
But if you test it this way:
http://i.imgur.com/Yg2HXS1.gifv
Memory usage is a lot different.
What do you think?
RomeuG
on 4 Aug 2017
Is your point that the terminals should be open all at once? Okay, will test.
psychon
on 4 Aug 2017
Yes indeed! I am sorry if I didn't make myself clear. I open like 50, then after opening them all, I close them all.
RomeuG
on 4 Aug 2017
Doesn't make much of a difference for the results:
awful.spawn({ "sh", "-c", "for x in $(seq 1 50) ; do urxvt -e /bin/sleep 10 & sleep 0.1; done"})
38.32^                                                                      #
     |                                                                    @@#:
     |                                        @:@                     ::@@@@#:
     |                                    @@::@:@:                :::@::@@@@#:
     |                                  @@@ ::@:@:            ::@::::@::@@@@#:
     |                                :@@@@ ::@:@:        :@::::@::::@::@@@@#:
     |                              ::@@@@@ ::@:@:    @::::@::::@::::@::@@@@#:
     |                            ::: @@@@@ ::@:@:::::@::::@::::@::::@::@@@@#:
     |                          ::::: @@@@@ ::@:@:::::@::::@::::@::::@::@@@@#:
     |                        ::::::: @@@@@ ::@:@:::::@::::@::::@::::@::@@@@#:
     |                     :::::::::: @@@@@ ::@:@:::::@::::@::::@::::@::@@@@#:
     |                   :::::::::::: @@@@@ ::@:@:::::@::::@::::@::::@::@@@@#:
     |  ::              ::::::::::::: @@@@@ ::@:@:::::@::::@::::@::::@::@@@@#:
     |  ::           :::::::::::::::: @@@@@ ::@:@:::::@::::@::::@::::@::@@@@#:
     |  ::      :: :::::::::::::::::: @@@@@ ::@:@:::::@::::@::::@::::@::@@@@#:
     |  ::     @: ::::::::::::::::::: @@@@@ ::@:@:::::@::::@::::@::::@::@@@@#:
     |  ::: :::@: ::::::::::::::::::: @@@@@ ::@:@:::::@::::@::::@::::@::@@@@#:
     |  :::::::@: ::::::::::::::::::: @@@@@ ::@:@:::::@::::@::::@::::@::@@@@#:
     |  :::::::@: ::::::::::::::::::: @@@@@ ::@:@:::::@::::@::::@::::@::@@@@#:
     |:::::::::@: ::::::::::::::::::: @@@@@ ::@:@:::::@::::@::::@::::@::@@@@#:
   0 +----------------------------------------------------------------------->Gi
     0                                                                   9.668


md5-fda4dc6f04b4081088c85675860e501a


--------------------------------------------------------------------------------
  n        time(i)         total(B)   useful-heap(B) extra-heap(B)    stacks(B)
--------------------------------------------------------------------------------
 90 10,080,864,280       39,536,600       34,199,279     5,337,321            0
 91 10,151,113,788       40,182,912       34,757,024     5,425,888            0
86.50% (34,757,024B) (heap allocation functions) malloc/new/new[], --alloc-fns, etc.
->73.36% (29,479,981B) 0x8022EFF: ??? (in /usr/lib64/liblua-5.3.so)
| ->34.99% (14,058,848B) 0x802DCB9: ??? (in /usr/lib64/liblua-5.3.so)
| | ->20.94% (8,415,552B) 0x802E18C: ??? (in /usr/lib64/liblua-5.3.so)
| | | ->12.23% (4,913,568B) 0x8012D03: lua_rawset (in /usr/lib64/liblua-5.3.so)
| | | | ->07.80% (3,133,504B) 0x8016275: ??? (in /usr/lib64/liblua-5.3.so)
| | | | | ->07.80% (3,133,504B) 0x801C30E: ??? (in /usr/lib64/liblua-5.3.so)
| | | | |   ->06.52% (2,621,504B) 0x8031EE3: ??? (in /usr/lib64/liblua-5.3.so)
| | | | |   | ->06.52% (2,621,504B) 0x801C5ED: ??? (in /usr/lib64/liblua-5.3.so)


md5-610d782d6f7f7c6c3564021fd38e19b1


    MB
28.13^    #
     |    #
     |    #
     |    #                                ::
     |    #                               ::   : @  ::
     |    #                         ::  @@:: ::::@:::
     |    #                        :: ::@ :: : ::@: : :  :
     |    #                       @:: : @ :: : ::@: : ::::
     |    #                  :  ::@:: : @ :: : ::@: : :: :::
     |  ::#                  :::: @:: : @ :: : ::@: : :: :: ::
     |  : #             :  :::::: @:: : @ :: : ::@: : :: :: ::@@
     |  : #           :::::: :::: @:: : @ :: : ::@: : :: :: ::@ ::
     |  : #        :::: :: : :::: @:: : @ :: : ::@: : :: :: ::@ : ::
     |  : #        : :: :: : :::: @:: : @ :: : ::@: : :: :: ::@ : ::::
     |  : #     :@@: :: :: : :::: @:: : @ :: : ::@: : :: :: ::@ : ::: ::
     |  : #   :::@ : :: :: : :::: @:: : @ :: : ::@: : :: :: ::@ : ::: ::@@
     |  : #:::: :@ : :: :: : :::: @:: : @ :: : ::@: : :: :: ::@ : ::: ::@ :@@:
     |  : #: :: :@ : :: :: : :::: @:: : @ :: : ::@: : :: :: ::@ : ::: ::@ :@ :
     |  : #: :: :@ : :: :: : :::: @:: : @ :: : ::@: : :: :: ::@ : ::: ::@ :@ :
     | :: #: :: :@ : :: :: : :::: @:: : @ :: : ::@: : :: :: ::@ : ::: ::@ :@ :
   0 +----------------------------------------------------------------------->Gi
     0                                                                   9.217
Peak memory usage here is ~30MiB and I think that the ~40MiB that we get when not "kicking the GC" all the time is not far off from this. After all, a mark&sweep GC always means higher memory usage.
Sorry that I can not find anything interesting / debugable here.
psychon
on 4 Aug 2017
Well I forgot to mention that I opened and closed all the terminals with the AwesomeWM keybinds.
Although having this line:
awesome.connect_signal("refresh", function() collectgarbage("collect") end)
Did wonders, and instead of getting 100MB of memory used, I got 40MB.
But having that line shouldn't be needed, right?
It is also odd, because, now I need to open & close a lot more to achieve like 50MB. It is an improvement, but I guess there is something that isn't freed. I got to 50MB, and it doesn't go down anymore, and no windows are open anymore.
I am sorry for being this picky. I also appreciate all your cooperation.
RomeuG
on 4 Aug 2017
But having that line shouldn't be needed, right?
I don't know, but I guess it should not be needed, but when looking at the graphs e.g. in https://github.com/awesomeWM/awesome/issues/1958#issuecomment-320238793, the "saw tooth pattern" likely is the effect of the GC's work. So in this benchmark the GC only did two iterations. Since Lua's GC is not generational (anyone wants to experiment with Lua 5.2's generational GC and awesome?), all the "temporary garbage" lingers around for quite a while before it is collected. Since the GC uses the memory usage at the end of a GC iteration as an estimate for when to start working next, lots of memory will be kept around for quite a while.
If you want, you could experiment with more aggressive GC settings. For example collectgarbage("setpause", collectgarbage("setpause")*2/3) to make the GC pause smaller and collectgarbage("setstepmul", collectgarbage("setstepmul")*3) to make the GC more aggressive in its mark and sweep phases. I bet that this will improve memory usage, but I don't think this is a general solution that I would want to see in awesome.
psychon
on 4 Aug 2017
I got to 50MB, and it doesn't go down anymore, and no windows are open anymore.
Just because Lua free()s some memory doesn't mean that glibc can/will give back memory to the OS. For example in the massif output I posted above, of the 40MiB in use, about 5MiB are some kind of overhead. That feels like quite a lot to me...
So the collectgarbage("collect")-trick only helps in decreasing the number reported by collectgarbage("count") (and in increasing awesome's CPU usage).
I am sorry for being this picky. I also appreciate all your cooperation.
No problem & sorry that I failed to be helpful with this problem so far.
psychon
on 4 Aug 2017
Thank you for your response. I will keep testing over these days, I will tinker with settings, etc. Maybe I will report back, who knows. Or maybe I'll be satisfied enough.
Once again, thank you very much. Should I close this or should you?
RomeuG
on 4 Aug 2017
Feel free to report back what you figure out over the next days. Tinkering with the GC settings can certainly improve things, but will also increase awesome's CPU usage.
I marked this as "need info" which is our label usually used where we are waiting for some more information/hints to reproduce the issue. (At least for me) this means that we stop looking at the issue and without anything new it will eventually be closed for lack of activity / new information.
psychon
on 4 Aug 2017
I thought about Lua 5.2's generational GC and wondered if that might help (Spoilter: It doesn't help. In fact, it hurts a lot). This lead me to doing quite some more benchmarks. For better reproducibility, I wrote a shell script that does all the work (download and build lua, lgi and awesome, and run the test). Also, since I was curious, I measured Lua 5.2 with the "normal" and the generational GC, plus Lua 5.3. Oh and I instrumented the C code to get an estimate of the memory used by Lua directly, instead of just the memory used by awesome "in total". Finally, I "stepped up" the number of clients to open from 50 to 1000 and apparently this makes quite a difference!
Here's the script: https://gist.github.com/psychon/33cb1985e31c81d212874ac07e446939
First the results from running under Massif:
Lua 5.2.4 with generational GC:
385.0^                                                                       #
     |                                                                     @@#
     |                                                                    @@@#
     |                                                                   @@@@#
     |                                                           @     ::@@@@#
     |                                                         @@@    :: @@@@#
     |                                     @@                 :@ @  :::: @@@@#
     |                                    @@                :::@ @ :: :: @@@@#
     |                                   @@@               :: :@ @::: :: @@@@#
     |                                 @@@@@         :    ::: :@ @::: :: @@@@#
     |                                @@ @@@       :::  ::::: :@ @::: :: @@@@#
     |                          @@@   @@ @@@       : :  ::::: :@ @::: :: @@@@#
     |                         @@@ :::@@ @@@     ::: :::::::: :@ @::: :: @@@@#
     |                        @@@@ :: @@ @@@   :@: : :: ::::: :@ @::: :: @@@@#
     |                      ::@@@@ :: @@ @@@  ::@: : :: ::::: :@ @::: :: @@@@#
     |                   @@:: @@@@ :: @@ @@@ :::@: : :: ::::: :@ @::: :: @@@@#
     |           ::    ::@ :: @@@@ :: @@ @@@ :::@: : :: ::::: :@ @::: :: @@@@#
     |       @@@::  :::: @ :: @@@@ :: @@ @@@ :::@: : :: ::::: :@ @::: :: @@@@#
     |      :@  :: :: :: @ :: @@@@ :: @@ @@@ :::@: : :: ::::: :@ @::: :: @@@@#
     |  :::::@  :: :: :: @ :: @@@@ :: @@ @@@ :::@: : :: ::::: :@ @::: :: @@@@#
   0 +----------------------------------------------------------------------->Gi
     0                                                                   184.3
Lua 5.2.4 with its "normal" GC:
36.55^                                    #
     |                @         @         #:
     |       @        @:        @         #:    ::    ::                  :
     |       @@       @:::      @         #:    :     :        : ::    :  :  :
     |     @ @@@@  :: @::  :    @         #:   ::   : :     :: :::  :  :  :  :
     |     @ @@@  ::  @::  ::   @  ::@ :  #:   ::   : :   :::  :::  :  :: :: :
     |     @ @@@  ::  @::  ::   @  : @ :  #:   ::   :::   : : ::::  ::@::::: :
     |     @ @@@  ::  @:: :::   @  : @::  #:   :: ::: :  :: : ::::  ::@:::::::
     |  :::@:@@@ ::: :@:: :::   @::: @ :: #: : :: : : : ::: : :::: :::@:::::::
     |  :: @:@@@ ::: :@:: ::::::@::: @ :::#::: :: : : : ::: : :::: :::@:::::::
     | ::: @:@@@ ::: :@:: ::::: @::: @ :::#:::::: : : : ::: : :::: :::@:::::::
     | ::: @:@@@ ::: :@:: ::::: @::: @ :::#:::::: : : : ::: : :::: :::@:::::::
     | ::: @:@@@ ::: :@:: ::::: @::: @ :::#:::::: : : : ::: : :::: :::@:::::::
     | ::: @:@@@ ::: :@:: ::::: @::: @ :::#:::::: : : : ::: : :::: :::@:::::::
     | ::: @:@@@ ::: :@:: ::::: @::: @ :::#:::::: : : : ::: : :::: :::@:::::::
     | ::: @:@@@ ::: :@:: ::::: @::: @ :::#:::::: : : : ::: : :::: :::@:::::::
     | ::: @:@@@ ::: :@:: ::::: @::: @ :::#:::::: : : : ::: : :::: :::@:::::::
     | ::: @:@@@ ::: :@:: ::::: @::: @ :::#:::::: : : : ::: : :::: :::@:::::::
     | ::: @:@@@ ::: :@:: ::::: @::: @ :::#:::::: : : : ::: : :::: :::@:::::::
     | ::: @:@@@ ::: :@:: ::::: @::: @ :::#:::::: : : : ::: : :::: :::@:::::::
   0 +----------------------------------------------------------------------->Gi
     0                                                                   184.4
Lua 5.3.4 with its only GC:
66.31^                                                                     #
     |               @        :  :   @                  :  :        :   :  #
     |            :  @     :  :  :   @     :  :     :   :  :  :  :  :   : :#
     |           ::  @     :  :  :   @    ::  :     :  :: ::  :  :  :  @: :# :
     |        @  ::  @ :   :  :  :  :@ :  :: ::  :  :  :: ::  : @:  :  @: :# :
     |        @  :: :@ :  :: @:  :  :@ :  :: ::  :  :  :: @: :: @:  : :@: :# :
     |        @  :: :@ :  :: @:  :  :@ :  :: ::  : @: ::: @: :: @: :: :@: :# :
     |     @  @  :: :@::  :: @:  : ::@::@ :: :: :: @: ::: @:::: @: :: :@:::#::
     |     @ :@ :::::@::  :: @:@@: ::@::@:::::: :: @: ::::@:::: @:::: :@:::#::
     |     @ :@ :::::@:: ::: @:@ :@::@::@:::::: :::@: ::::@:::::@:::: :@:::#::
     |   ::@ :@@:::::@:: ::::@:@ :@::@::@::::::@:::@: ::::@:::::@::::::@:::#::
     |   ::@::@@:::::@:::::::@:@ :@::@::@::::::@:::@::::::@:::::@::::::@:::#::
     |   ::@::@@:::::@:::::::@:@ :@::@::@::::::@:::@::::::@:::::@::::::@:::#::
     |   ::@::@@:::::@:::::::@:@ :@::@::@::::::@:::@::::::@:::::@::::::@:::#::
     |  :::@::@@:::::@:::::::@:@ :@::@::@::::::@:::@::::::@:::::@::::::@:::#::
     | ::::@::@@:::::@:::::::@:@ :@::@::@::::::@:::@::::::@:::::@::::::@:::#::
     | ::::@::@@:::::@:::::::@:@ :@::@::@::::::@:::@::::::@:::::@::::::@:::#::
     | ::::@::@@:::::@:::::::@:@ :@::@::@::::::@:::@::::::@:::::@::::::@:::#::
     | ::::@::@@:::::@:::::::@:@ :@::@::@::::::@:::@::::::@:::::@::::::@:::#::
     | ::::@::@@:::::@:::::::@:@ :@::@::@::::::@:::@::::::@:::::@::::::@:::#::
   0 +----------------------------------------------------------------------->Gi
     0                                                                   173.3
And now the results from the instrumentation about "just Lua's memory usage" (sorry, I didn't get the different Lua versions into a single graph):
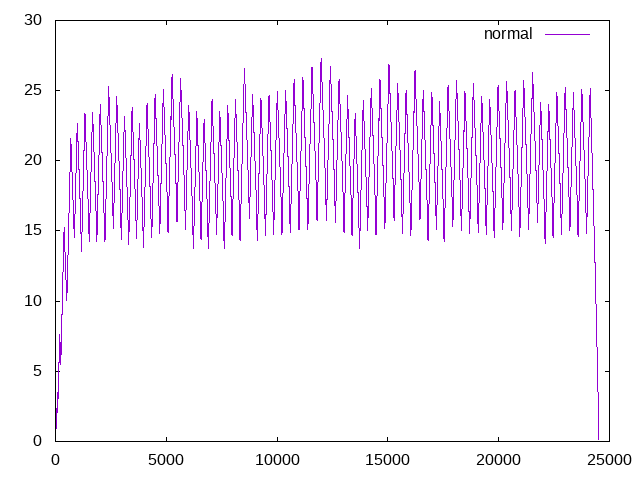
Lua 5.2.4:
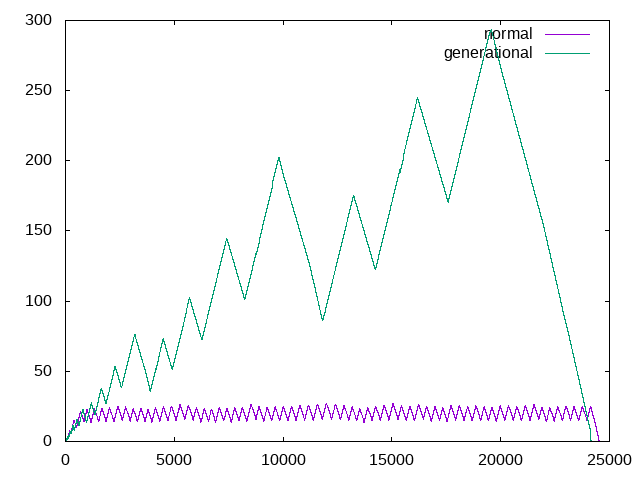
Lua 5.3.4:
Edit: Please note that the two kinds of images use different X-axes: Massif uses "number of CPU instructions executed" while the PNGs use "number of calls to the memory allocation function".
Some things to see:
- With 1000 instead of 50 clients, memory usage stabilises (except for the generational GC)
- Forget about the generational GC (385MiB peak memory usage)
- Lua 5.2.4 needs less memory than Lua 5.3.4 (~25MiB vs ~50MiB)
- The same applies to total process memory usage (~36MiB vs ~66MiB, which is almost the same difference than "just the memory used by Lua).
No idea what this means for awesome. Someone might want to investigate why Lua 5.3 needs twice as much memory as Lua 5.2 here.
psychon
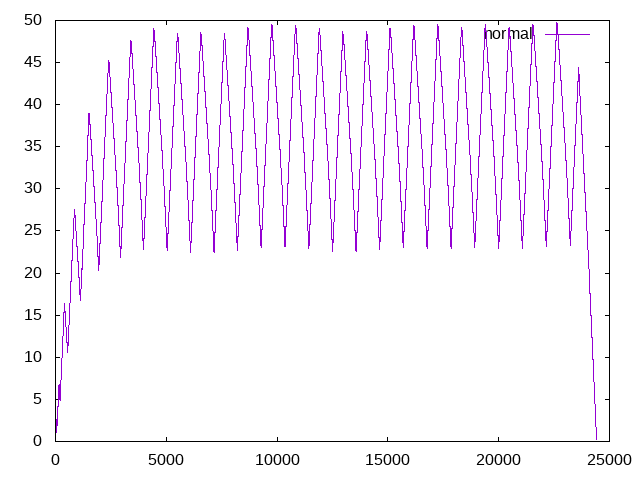
on 6 Aug 2017
To make it easier to compare Lua 5.2.4 and 5.3.4, here is the graph for Lua 5.2.4 again without the curve for "generational" (sorry, can't get both of them into a single graph; the script already deleted the data file for Lua 5.3.4):
psychon
on 6 Aug 2017
Great analysis there! I can't really grasp the results that much, but according to your conclusion, it seems I should be using Lua 5.2.4?
RomeuG
on 7 Aug 2017
All I'm saying is that Lua 5.2.4 only has about half the memory usage. But according to the graphs, it does way more GC cycles than Lua 5.3.4. I'm not sure where that difference comes from, but perhaps configuring Lua 5.3 with more aggressive GC settings has a similar effect?
Just guessing from the image: Lua 5.2.4 uses a pause of 160 (even though the actual value is 200?!?). I don't know about the step multiplier (I don't think this can be seen from the graph), but let's just take a more aggressive one here as well.
So, add the following to your rc.lua:
collectgarbage("setpause", 160)
collectgarbage("setstepmul", 400)
Sorry for the late response!
I can happily say that I do not have memory problems anymore, probably thanks to the changes you made because of cairo.
Also, with those lines, memory stays at 50-60MB range.
So I can finally say that I have no problems anymore, therefore, I will close this.
Thank you for your help! :)
RomeuG
on 10 Aug 2017
Related issues
 robn
·
4Comments
robn
·
4Comments
 vonpupp
·
5Comments
psychon
·
6Comments
vonpupp
·
5Comments
psychon
·
6Comments
 blkdr
·
5Comments
blkdr
·
5Comments
 liquiddandruff
·
6Comments
liquiddandruff
·
6Comments