Autoscaler: [Regression] Infinite scale-up with statefulsets, gke 1.15 and 1.16 (not 1.14)
Hello, we are observing a nasty change in behavior of autoscaler.
Updates
@afirth 2020-05-19
- can reproduce on 1.16 as well
- can reproduce with a statefulset spec with _no_ resource requests or limits
- since Saturday ~2020-05-16T0230Z affects clusters with a single node pools as well, including the default pool, meaning we have no workaround besides completely disabling autoscaling or running 1.14 (seems to happen less with only one pool though)
- can reproduce on a new, plain GKE cluster
- seems to be tied to volume binding - if all volumes are bound to an existing node (run the repro script, wait for scale down, pvcs are still there even though sts is gone, no scale up will be triggered
- this might explain why it's not surfacing for more users: in our use case we create and destroy the entire namespace which would nuke the pvc.
- doesn't trigger scaleUp if one is already in progress (duh)
Summary
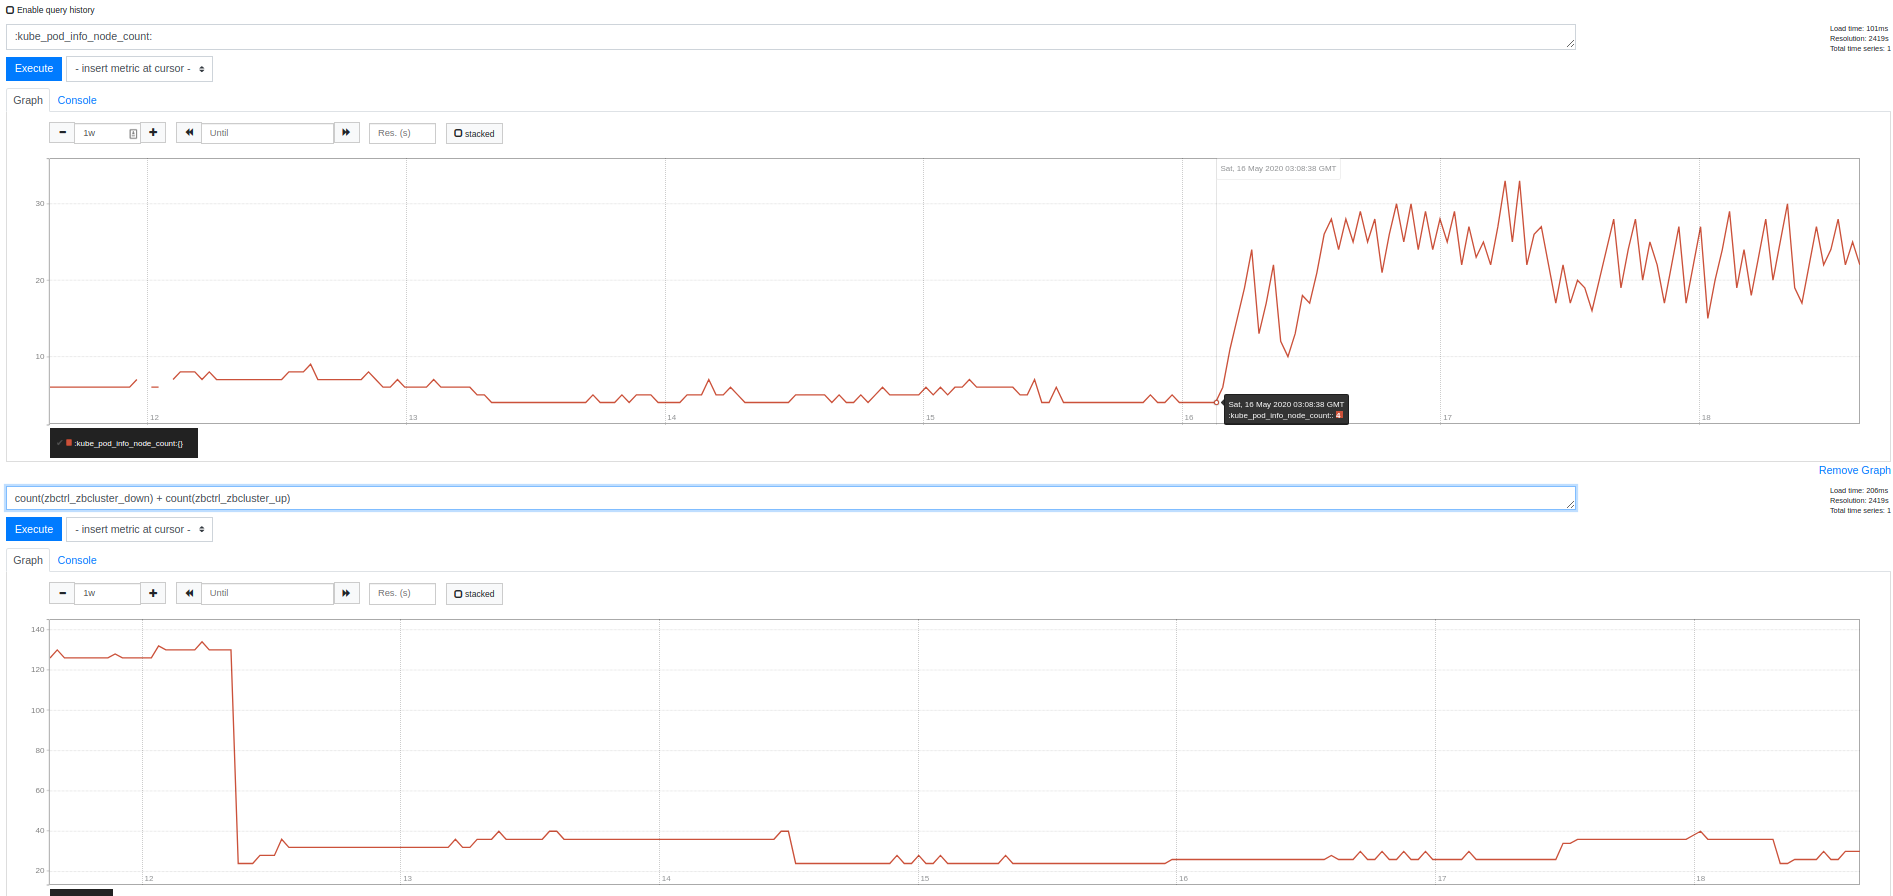
When two node pools have autoscaler enabled, certain workloads _always_ trigger a scale-up on gke 1.15. Even if the pod is deleted, if another pod is created before the cooldown period expires _another_ scaleup will occur, until both node pools meet their max node counts. This behavior doesn't occur on 1.14.10-gke.27
Hypothesis
There's a bug in autoscaler which causes the autoscaler to add a new node, even though space is available for the pod on existing nodes. If pods are deployed fast enough (>1x/10m), this causes infinite scaling because no scaleDown is ever initiated. This behavior reoccurs even if the pod which initially triggered scaleUp is deleted before the next one is created. The new node is not necessary, the pod schedules fine if autoscaling is disabled. The pod is even scheduled on an existing node, but the new node is created anyway.
It is triggered when all of the following conditions are met:
- 1.15.11-gke.9 or 1.15.11-gke.11
- Two node pools attached to cluster, both with gke-provided autoscaler enabled
- A particular spec causes it (so far we have confirmed it with two different statefulSet specs. Not all workloads trigger)
It is _not_ triggered when _any_ of the following are true:
- 1.14.10-gke.27
- A similar spec is deployed - we haven't been able to isolate, but it seems to happen only with stateful sets
- Only one node pool is attached
- Two node pools are attached, but only one has autoscaling enabled
- Two node pools are attached, but neither has autoscaling enabled (all pods are scheduled fine)
Testing so far
We have confirmed we can reproduce the behavior on a brand new gke 1.15 cluster, but not on 1.14
Workaround
is to disable autoscaling on, or delete, all but one node pool
Impact
This causes both node pools to fill up completely with empty nodes if those workloads are created and deleted fast enough (for example integration tests).
The impact for us is that we have some substantial costs from our test cluster bursting to 2.5TB of memory over the weekend. We also have different, undowngradable, GKE versions in our testing clusters from production, although we will fix that after we apply the workaround. We expect worse bin-packing with the new configuration, which will also increase costs.
As you can imagine, this has been an interesting investigation. Thanks for any insights.
cc @hisImminence @ztombol who have been doing the investigation
sample complete statefulset spec which triggers behaviour
```
apiVersion: apps/v1
kind: StatefulSet
metadata:
name: elasticsearch
namespace: scale-test1
spec:
replicas: 1
selector:
matchLabels:
app.kubernetes.io/component: elasticsearch
serviceName: elasticsearch
template:
metadata:
labels:
app.kubernetes.io/component: elasticsearch
spec:
terminationGracePeriodSeconds: 30
securityContext:
runAsUser: 1000
runAsGroup: 1000
fsGroup: 1000
containers:
- name: elasticsearch
image: docker.elastic.co/elasticsearch/elasticsearch-oss:6.7.1
ports:
- containerPort: 9600
env:
- name: discovery.type
value: single-node
- name: cluster.name
value: elasticsearch
- name: ES_JAVA_OPTS
value: "-Xms512m -Xmx512m"
resources:
limits:
memory: 2Gi
requests:
cpu: 100m
memory: 1Gi
volumeMounts:
- name: elasticsearch-data
mountPath: /usr/share/elasticsearch/data
updateStrategy:
type: RollingUpdate
podManagementPolicy: OrderedReady
volumeClaimTemplates:
- metadata:
name: elasticsearch-data
spec:
accessModes: [ "ReadWriteOnce" ]
resources:
requests:
storage: 5Gi
 afirth
All 13 comments
I tried reproducing based on your description, but the issue didn't happen to me. Can you provide more detailed reproduction steps? Alternatively can you create a case with GKE support?
I can't think of any particular change in CA between 1.14 and 1.15 that seems related and without either a reproduction or logs it's impossible to tell what may be happening.
Some general comments:
Your theory that it only happens for StatefulSets sounds very likely to me:
- For CA to even see a pod it must have been marked as unschedulable by scheduler first (specifically it only looks at pods with PodSchedulable: false status condition), so there must be something preventing pods (at least temporarily) from being scheduled to trigger a scale-up. In case of StatefulSets a pod may be temporarily unschedulable while it's waiting for volume to be created. For other types of pods there aren't many reasons for it to be temporarily unschedulable.
- Handling PersistentVolumes is tricky for CA. The way scheduling works for pods using PVs break multipls autoscaler assumptions and there are many known edge cases. That being said those issues existed for a very long time and I'm not aware of any change between 1.14 and 1.15.
- In particular I think an incorrect scale-up like the one you describe can happen as a result of a race where volume happens to be created at a very specific time in CA loop - after CA verified that the pod is indeed unschedulable, but before it runs scale-up simulation. This requires very specific timing though, so it should be rare. And again - that issue existed since forever, it's not new to 1.15.
 MaciekPytel
on 14 May 2020
MaciekPytel
on 14 May 2020
Thanks for looking into this @MaciekPytel
Reproduce with ./repro-1.15-cluster.sh after cloning https://github.com/afirth/repro-cluster-autoscaler-3131. Sorry about the spaghetti
- seems doesn't happen if the _same_ statefulset is created and deleted, so PVCs make sense to me too.
- My favorite finding so far. Breaks the 1.15 control plane (master unreachable, status reconciling, console said "repairing") pretty consistently while adding and deleting 10 statefulsets. This happened four times on different clusters. Maybe it will happen for you too :grin: Maybe this is expected behavior as the node count scales? Usually happens when it gets to around 6 nodes.
- Observed once that deleting the node pool, recreating it without AS, then enabling AS with
gcloud node-pool updatemakes the bug go away. Can't reproduce. WTF though.
redacted 1.15 logs attached. On 1.14 there are no ScaleUp lines from the configmap events
versions
$ gcloud version
Google Cloud SDK 292.0.0
alpha 2020.05.08
beta 2020.05.08
bq 2.0.57
core 2020.05.08
gsutil 4.50
kubectl 2020.05.08

$ k version
Client Version: version.Info{Major:"1", Minor:"18", GitVersion:"v1.18.2", GitCommit:"52c56ce7a8272c798dbc29846288d7cd9fbae032", GitTreeState:"clean", BuildDate:"2020-04-16T11:56:40Z", GoVersion:"go1.13.9", Compiler:"gc", Platform:"linux/amd64"}
Unable to connect to the server: <redacted>
I'll try to reproduce sometime this week. Regarding your point 2 - this is expected, GKE resizes master as cluster size changes. You can use regional clusters (which upgrade of masters one-by-one) to avoid control plane going down. I am 100% sure this is the case in both 1.14 and 1.15 (but using a new cluster vs preexisting could make a difference).
[1] https://cloud.google.com/kubernetes-engine/docs/concepts/regional-clusters
MaciekPytel
on 18 May 2020
Thanks!
We have 2 particular use cases we want to enable with 2 AS pools:
1) A preemptible pool and a non-preemptible pool
2) Different memory/cpu ratios of different workloads which scale at different times
afirth
on 18 May 2020
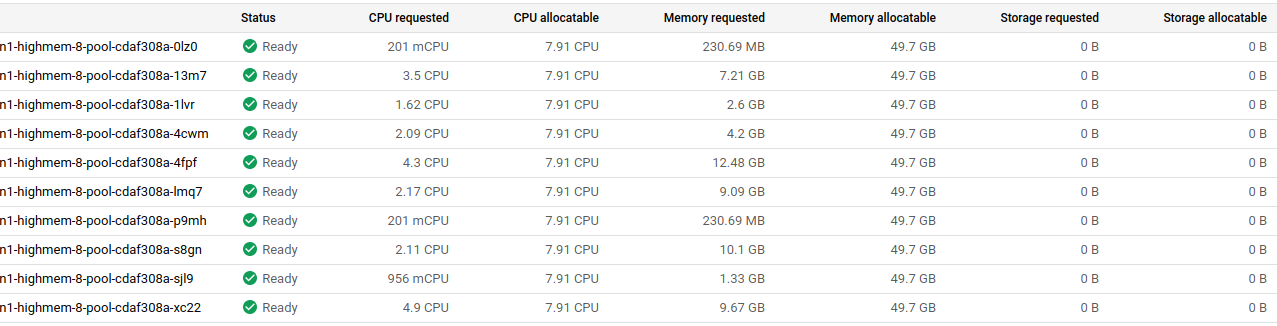
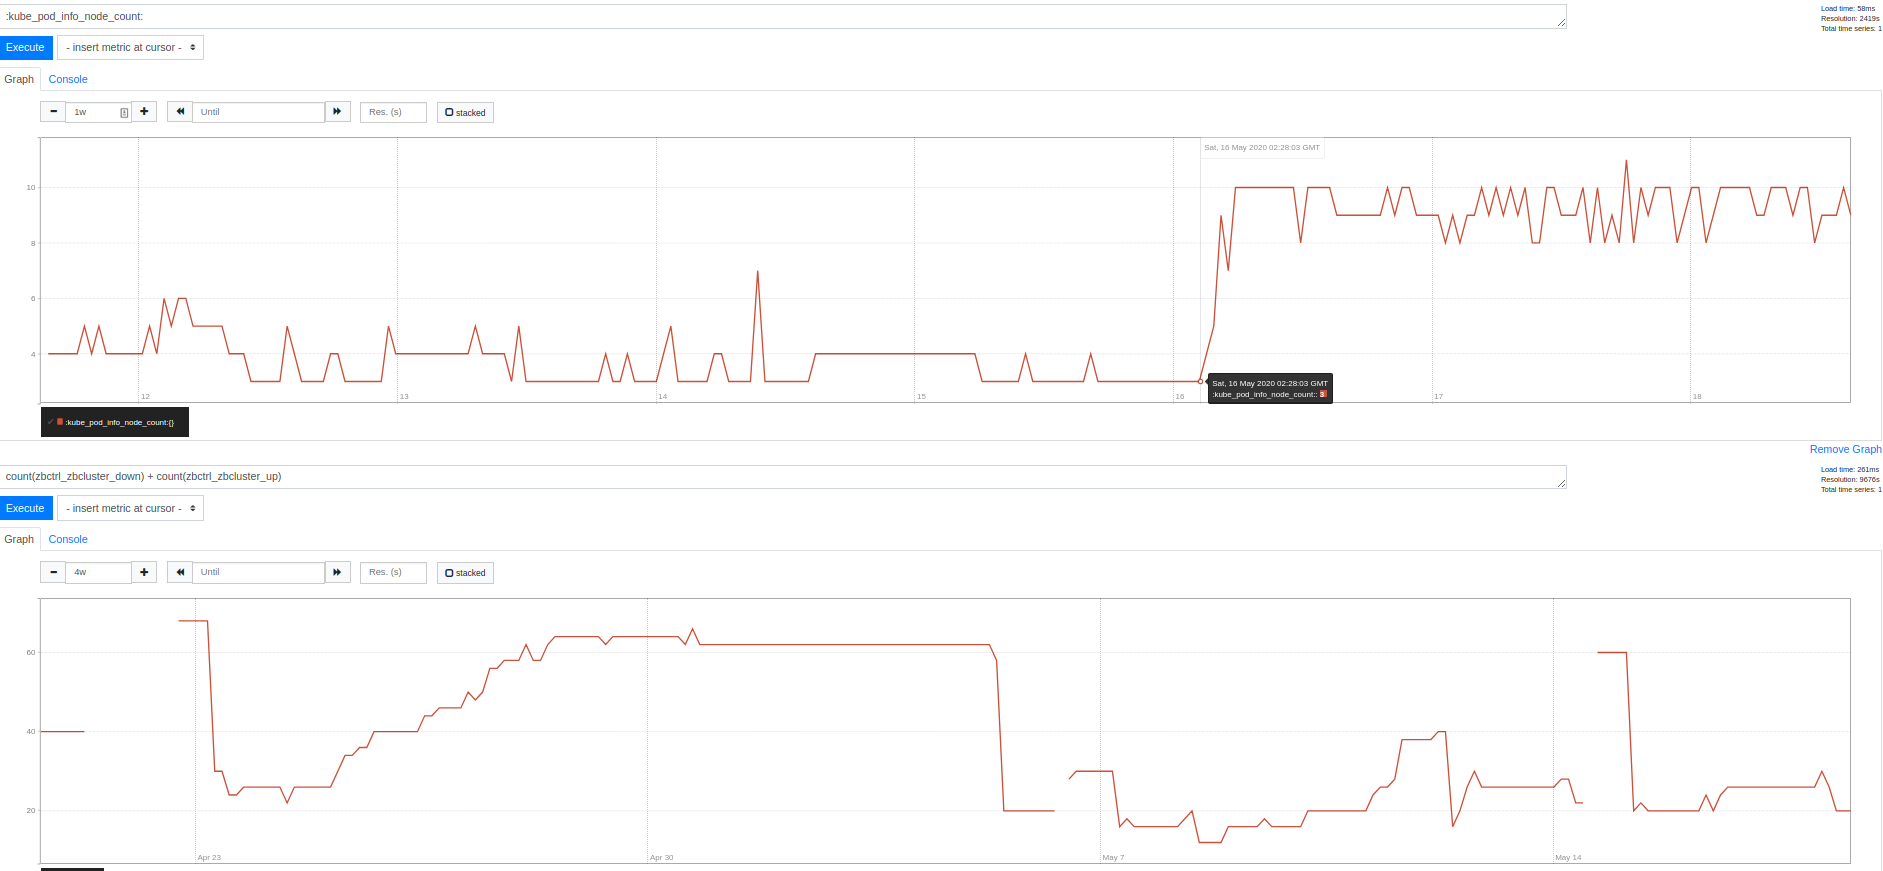
As of saturday around 2am UTC we are seeing similar behavior with _one_ node pool. One cluster is pegged at it's limit of 10, up from usual 3-4. Another sitting around 20-23 (limit 30), also up from 3-4. That number correlates pretty well with the number of statefulsets of the same type running, but no pod or node affinity is configured. We did not make any changes at this time. These are clusters on which we already applied what we thought was a workaround by deleting one pool.
smaller one:
and lack of usage:
bigger one:
I am able to reproduce this in testing most of the time https://github.com/afirth/repro-cluster-autoscaler-3131/blob/master/single-pool-1.15.sh. While the bug is not triggered on the default-pool, adding a second pool and then deleting the default pool causes the issue. Again, all PVCS are successfully bound and all pods are scheduled OK. I can file a GKE feedback if you want to dig into our cluster logs, but we don't have a support contract.
afirth
on 18 May 2020
Update:
Can reproduce on the default pool too (no second pool added) on 1.15 and 1.16 as well, sometimes.
Minimum yaml (must mutate the name each time you create and delete, so that a new volume is bound)
apiVersion: apps/v1
kind: StatefulSet
metadata:
 name: elasticsearch
spec:
  replicas: 1
  selector:
    matchLabels:
      app.kubernetes.io/component: elasticsearch
  serviceName: elasticsearch
  template:
    metadata:
      labels:
        app.kubernetes.io/component: elasticsearch
    spec:
      containers:
      - name: elasticsearch
        image: docker.elastic.co/elasticsearch/elasticsearch-oss:6.7.1
        env:
          - name: discovery.type
            value: single-node
          - name: cluster.name
            value: elasticsearch
        volumeMounts:
        - name: elasticsearch-data
          mountPath: /usr/share/elasticsearch/data
  volumeClaimTemplates:
  - metadata:
      name: elasticsearch-data
    spec:
      accessModes: [ "ReadWriteOnce" ]
      resources:
        requests:
          storage: 5Gi
Observations in limited testing:
- Without the env vars, which cause the pod to not CrashLoopBackoff, no new nodes are created.
- Adding a second pool of n1-highmem-8 nodes and removing the default pool causes more scaling than using the default pool
- Creating and deleting the sts too fast (which I guess also causes them to not start) = no new nodes.
I'll continue to expand the testing. I can't think of any reason CAS should add a node for something that has no resource requests or limits though. I also can't figure out why it doesn't happen on 1.14. PV provider changes? Only thing that looks remotely related in 1.15 release notes is https://github.com/kubernetes/kubernetes/pull/73863/files#
We run a statefulset for each customer. This bug pretty much blocks our ability to test that, and causes infinite scaling if we get more than one new customer/10 mins (before scaledown)
afirth
on 20 May 2020
Any update on this @MaciekPytel ?
afirth
on 3 Jun 2020
@towca I think you reproduced this or similar issue - can you comment?
MaciekPytel
on 3 Jun 2020
I actually wasn't able to reproduce this behavior using StatefulSets, but instead I would create a PVC and then after a specific delay add a Pod using this PVC. Using 0.5s as the delay I managed to reproduce this behavior consistently.
If you're interested in _why_ this is happening, the explanation is below. If not, feel free to skip to the Workaround section.
Technical details
Let's assume we have a pod for which a PVC is dynamically created. If the PVC is using a storage class with volumeBindingMode: Immediate, it has to have a PV bound before it can be used by a pod. This in turn makes the pod unschedulable until the PV is bound to the newly created PVC.
In my tests, it takes ~5-7 seconds for the PV to be provisioned and bound to the PVC. In that 5-7 seconds the now unschedulable pod triggers a Cluster Autoscaler loop.
Cluster Autoscaler simulates the same predicates that scheduler does, 2 times:
- At the beginning, it checks if the unschedulable pod can actually be scheduled on any of the existing nodes. If not, the pod is marked as "actually unschedulable".
- Then, the predicates are run again for an empty "virtual" node from each MIG, to see if adding a new node to the MIG would accomodate the unschedulable pod.
Now, the problem is that the scheduler predicate which does the PVC checks uses a live PVC informer that CA doesn't control, which makes it vulnerable to the following race:
- At 1. above, the PV is still not bound, so the predicates fail and the pod is marked as "actually unschedulable".
- Between 1. and 2. above, the PV is provisioned and bound to the PVC.
- At 2. above, the predicates are run again and this time they pass, so CA assumes that while the pod can't be scheduled on the existing node, a new node will help.
- The MIG is resized to add the new node.
- Since the pod is now schedulable, scheduler places it on the existing node.
- The new node is added, but the pod is already scheduled.
Workaround
Unfortunately, fixing the issue properly in Cluster Autoscaler would be very difficult, because we'd have to work around the vendored scheduler code.
That said, it looks like there is a workaround for this particular case - if the storage class used by the PVCs changed the volume binding mode to volumeBindingMode: WaitForFirstConsumer, the pod wouldn't have to wait for the PV to be bound and would just be scheduled on the existing node in the first place.
I was able to confirm that this works - the unnecessary scale-ups stopped after changing the volume binding mode.
However, keep in mind that some users reported that using volumeBindingMode: WaitForFirstConsumer breaks autoscaling in other ways: #1658. I wasn't able to reproduce that behavior, though. Scale-up worked correctly with volumeBindingMode: WaitForFirstConsumer in my tests. In any case, it's probably best to monitor the workloads after making this change and to make sure that your autoscaling scenario is still behaving correctly.
 towca
on 5 Jun 2020
towca
on 5 Jun 2020
Amazing @towca , thank you. We will try this out soon.
Any idea why it doesn't happen on 1.14? Is it just that the scheduler loop was faster? I'm also really curious what changed on GKE at ~2020-05-16T02:00Z, if anything.
afirth
on 5 Jun 2020
I'm not aware of any changes in this behavior between 1.14 and 1.15, so it's probably a case of timing changing slightly. As for the GKE change of behavior - something might've changed in the way PVs are provisioned, again changing timining slightly? But that's only a guess.
towca
on 8 Jun 2020
thanks @towca for the workaround. Confirmed on our side and most appreciated.
sample for anyone coming along later:
apiVersion: storage.k8s.io/v1
kind: StorageClass
metadata:
  name: standard-v2
parameters:
  type: pd-standard
provisioner: kubernetes.io/gce-pd
reclaimPolicy: Delete
volumeBindingMode: WaitForFirstConsumer #workaround kubernetes/autoscaler#3131
Great, glad to hear it! Feel free to reopen if you have any further questions.
towca
on 19 Jun 2020
Related issues
 chapati23
·
4Comments
chapati23
·
4Comments
 duritong
·
5Comments
duritong
·
5Comments
 clamoriniere
·
5Comments
clamoriniere
·
5Comments
 bpinske
·
5Comments
bpinske
·
5Comments
 johanneswuerbach
·
5Comments
johanneswuerbach
·
5Comments
Most helpful comment
I actually wasn't able to reproduce this behavior using StatefulSets, but instead I would create a PVC and then after a specific delay add a Pod using this PVC. Using
0.5sas the delay I managed to reproduce this behavior consistently.If you're interested in _why_ this is happening, the explanation is below. If not, feel free to skip to the Workaround section.
Technical details
Let's assume we have a pod for which a PVC is dynamically created. If the PVC is using a storage class with
volumeBindingMode: Immediate, it has to have a PV bound before it can be used by a pod. This in turn makes the pod unschedulable until the PV is bound to the newly created PVC.In my tests, it takes ~5-7 seconds for the PV to be provisioned and bound to the PVC. In that 5-7 seconds the now unschedulable pod triggers a Cluster Autoscaler loop.
Cluster Autoscaler simulates the same predicates that scheduler does, 2 times:
Now, the problem is that the scheduler predicate which does the PVC checks uses a live PVC informer that CA doesn't control, which makes it vulnerable to the following race:
Workaround
Unfortunately, fixing the issue properly in Cluster Autoscaler would be very difficult, because we'd have to work around the vendored scheduler code.
That said, it looks like there is a workaround for this particular case - if the storage class used by the PVCs changed the volume binding mode to
volumeBindingMode: WaitForFirstConsumer, the pod wouldn't have to wait for the PV to be bound and would just be scheduled on the existing node in the first place.I was able to confirm that this works - the unnecessary scale-ups stopped after changing the volume binding mode.
However, keep in mind that some users reported that using
volumeBindingMode: WaitForFirstConsumerbreaks autoscaling in other ways: #1658. I wasn't able to reproduce that behavior, though. Scale-up worked correctly withvolumeBindingMode: WaitForFirstConsumerin my tests. In any case, it's probably best to monitor the workloads after making this change and to make sure that your autoscaling scenario is still behaving correctly.