Autoscaler: pod in pending state on GKE, but pool can be scaled up
Hello!
Master version: 1.11.3-gke.18
Nodepool version: v1.10.7-gke.2
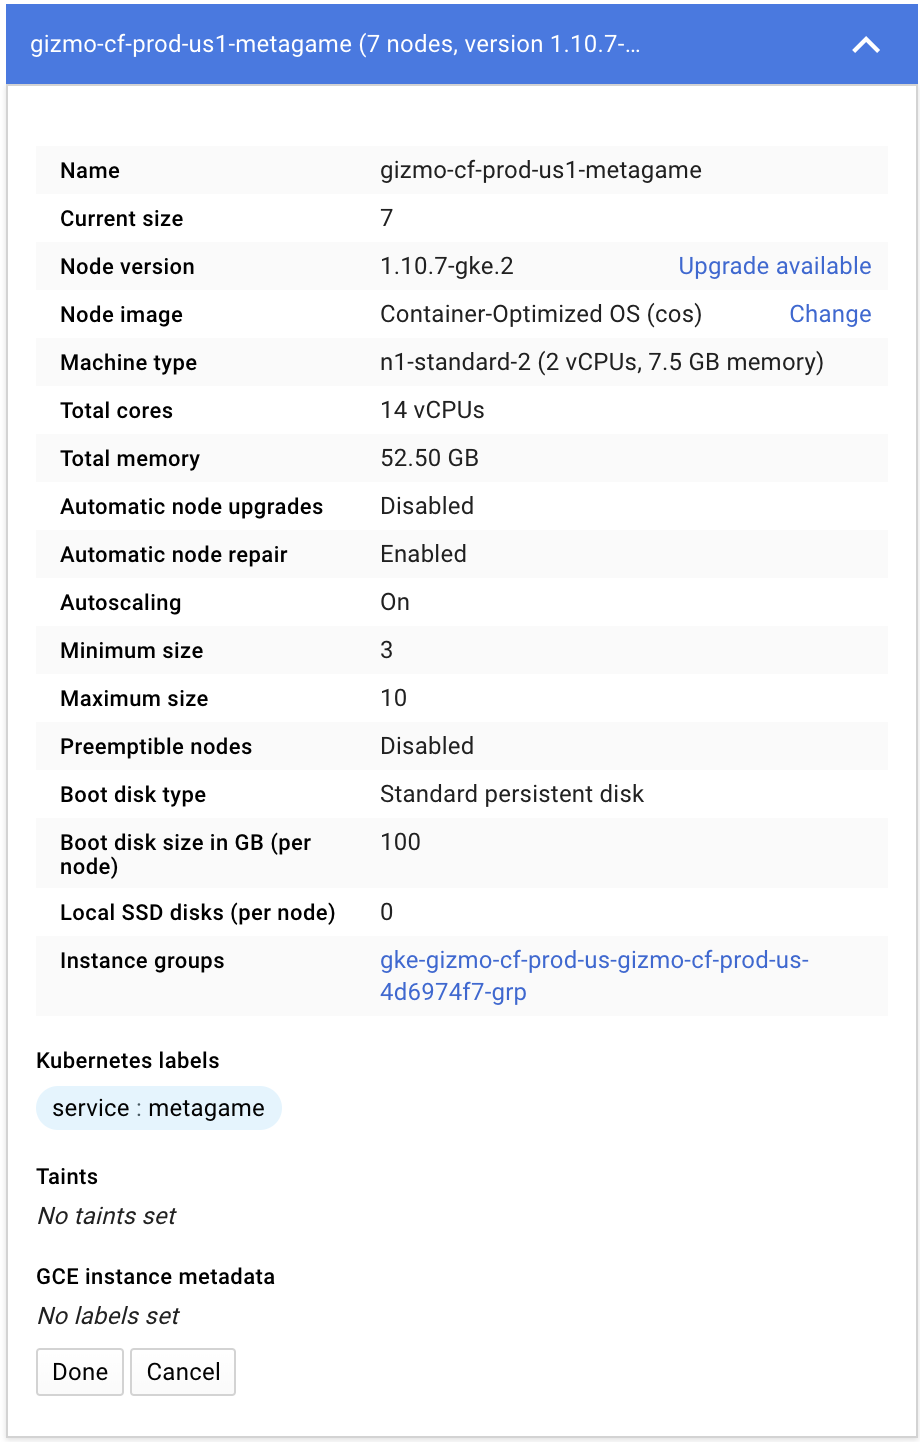
Minimum nodes: 3
Maximum nodes: 10
Current size: 7
Node in pool has 2 CPU and 7.5Gb ram, new pod require (and limit) 500m CPU and 256Mi, but I'm getting this message
Events:
  Type     Reason             Age                 From                Message
  ----     ------             ----                ----                -------
  Normal   NotTriggerScaleUp  11m (x174 over 1h)  cluster-autoscaler  pod didn't trigger scale-up (it wouldn't fit if a new node is added)
  Warning  FailedScheduling   1m (x5490 over 1h)  default-scheduler   0/9 nodes are available: 2 node(s) didn't match node selector, 8 Insufficient cpu.
I've got 2 pods in this state, it was ok, because it appears in deployment update, but looks really strange. I decided just to remove resource requests for non critical pods.
 agadelshin
All 8 comments
This event means that CA can't add a node that would help pending pods. It doesn't mean the reason is related to resources, if you have a pending pod with nodeSelector and the new node will not have a label matching selector you will get the same event. Or if you have a pending pod and your nodepool is already at max size.
If you provide your pod spec I could try to guess what may be the reason, just from the event I can't guess it.
 MaciekPytel
on 3 Dec 2018
MaciekPytel
on 3 Dec 2018
@MaciekPytel thank you! This is affinity for pod:
spec:
  affinity:
    nodeAffinity:
      requiredDuringSchedulingIgnoredDuringExecution:
        nodeSelectorTerms:
        - matchExpressions:
          - key: service
            operator: In
            values:
            - metagame
Nodepool with autoscaling enabled has label metagame. Current size of node pool (7) less than maximum size (10).
Full spec here.
apiVersion: v1
kind: Pod
metadata:
  annotations:
    checksum/config: 498c845c12c05de968f3598540cad848fd1dc9da7590164fbd40a8f448f9a922
    prometheus.io/port: "10080"
    prometheus.io/scrape: "true"
  creationTimestamp: 2018-12-03T09:56:15Z
  generateName: frontend-micro-5868444f78-
  labels:
    app.kubernetes.io/instance: frontend
    app.kubernetes.io/name: micro
    pod-template-hash: "1424000934"
  name: frontend-micro-5868444f78-2kknp
  namespace: default
  ownerReferences:
  - apiVersion: apps/v1
    blockOwnerDeletion: true
    controller: true
    kind: ReplicaSet
    name: frontend-micro-5868444f78
    uid: ac4533ac-f6e1-11e8-93a6-42010a8001b2
  resourceVersion: "16393230"
  selfLink: /api/v1/namespaces/default/pods/frontend-micro-5868444f78-2kknp
  uid: ac4d1ca1-f6e1-11e8-93a6-42010a8001b2
spec:
  affinity:
    nodeAffinity:
      requiredDuringSchedulingIgnoredDuringExecution:
        nodeSelectorTerms:
        - matchExpressions:
          - key: service
            operator: In
            values:
            - metagame
  containers:
  - args:
    - api
    image: eu.gcr.io/fish2-14312551/micro:v0.1.5-cf
    imagePullPolicy: IfNotPresent
    name: micro
    ports:
    - containerPort: 8080
      name: service-port
      protocol: TCP
    - containerPort: 10080
      name: metrics-port
      protocol: TCP
    readinessProbe:
      failureThreshold: 3
      httpGet:
        path: /health_check
        port: metrics-port
        scheme: HTTP
      initialDelaySeconds: 5
      periodSeconds: 10
      successThreshold: 1
      timeoutSeconds: 1
    resources:
      limits:
        cpu: 500m
        memory: 256Mi
      requests:
        cpu: 500m
        memory: 256Mi
    terminationMessagePath: /dev/termination-log
    terminationMessagePolicy: File
    volumeMounts:
    - mountPath: /var/secrets/google/sa.json
      name: google-creds
      subPath: sa.json
    - mountPath: /var/run/secrets/kubernetes.io/serviceaccount
      name: default-token-7q8dh
      readOnly: true
  dnsPolicy: ClusterFirst
  initContainers:
  - command:
    - sh
    - -c
    - until wget consul:8500; do echo waiting for registry; sleep 2; done;
    image: alpine:3.8
    imagePullPolicy: IfNotPresent
    name: check-registry-ready
    resources:
      requests:
        cpu: 50m
        memory: 32Mi
    terminationMessagePath: /dev/termination-log
    terminationMessagePolicy: File
    volumeMounts:
    - mountPath: /var/run/secrets/kubernetes.io/serviceaccount
      name: default-token-7q8dh
      readOnly: true
  - command:
    - sh
    - -c
    - until wget nats-nats-monitoring:8222; do echo waiting for broker; sleep 2; done;
    image: alpine:3.8
    imagePullPolicy: IfNotPresent
    name: check-broker-ready
    resources:
      requests:
        cpu: 50m
        memory: 32Mi
    terminationMessagePath: /dev/termination-log
    terminationMessagePolicy: File
    volumeMounts:
    - mountPath: /var/run/secrets/kubernetes.io/serviceaccount
      name: default-token-7q8dh
      readOnly: true
  nodeName: gke-gizmo-cf-prod-us-gizmo-cf-prod-us-4d6974f7-8pb7
  priority: 0
  restartPolicy: Always
  schedulerName: default-scheduler
  securityContext: {}
  serviceAccount: default
  serviceAccountName: default
  terminationGracePeriodSeconds: 30
  tolerations:
  - effect: NoExecute
    key: node.kubernetes.io/not-ready
    operator: Exists
    tolerationSeconds: 300
  - effect: NoExecute
    key: node.kubernetes.io/unreachable
    operator: Exists
    tolerationSeconds: 300
  volumes:
  - name: google-creds
    secret:
      defaultMode: 420
      items:
      - key: sa.json
        path: sa.json
      secretName: frontend-micro
  - name: default-token-7q8dh
    secret:
      defaultMode: 420
      secretName: default-token-7q8dh
status:
  conditions:
  - lastProbeTime: null
    lastTransitionTime: 2018-12-03T11:28:59Z
    status: "True"
    type: Initialized
  - lastProbeTime: null
    lastTransitionTime: 2018-12-03T11:29:14Z
    status: "True"
    type: Ready
  - lastProbeTime: null
    lastTransitionTime: 2018-12-03T11:28:56Z
    status: "True"
    type: PodScheduled
  containerStatuses:
  - containerID: docker://0c5e6d05a7596534308c3ff52f255f79e78a775f6ed7e26cc2f9e3b4bb709d79
    image: eu.gcr.io/fish2-14312551/micro:v0.1.5-cf
    imageID: docker-pullable://eu.gcr.io/fish2-14312551/micro@sha256:fc24042744b0f12dadf710bcabee1a596406fd8e9b8f8b614108fcbfca59bccd
    lastState: {}
    name: micro
    ready: true
    restartCount: 0
    state:
      running:
        startedAt: 2018-12-03T11:29:00Z
  hostIP: 10.2.0.6
  initContainerStatuses:
  - containerID: docker://ea5c441b83d0c645cd550d7545b0d915ffd80a6e3c7fa00323231953861eb85f
    image: alpine:3.8
    imageID: docker-pullable://alpine@sha256:02892826401a9d18f0ea01f8a2f35d328ef039db4e1edcc45c630314a0457d5b
    lastState: {}
    name: check-registry-ready
    ready: true
    restartCount: 0
    state:
      terminated:
        containerID: docker://ea5c441b83d0c645cd550d7545b0d915ffd80a6e3c7fa00323231953861eb85f
        exitCode: 0
        finishedAt: 2018-12-03T11:28:58Z
        reason: Completed
        startedAt: 2018-12-03T11:28:58Z
  - containerID: docker://6e869885a4076a30e259275aed75af7e22049129e8f44a2357b32648e20f2030
    image: alpine:3.8
    imageID: docker-pullable://alpine@sha256:02892826401a9d18f0ea01f8a2f35d328ef039db4e1edcc45c630314a0457d5b
    lastState: {}
    name: check-broker-ready
    ready: true
    restartCount: 0
    state:
      terminated:
        containerID: docker://6e869885a4076a30e259275aed75af7e22049129e8f44a2357b32648e20f2030
        exitCode: 0
        finishedAt: 2018-12-03T11:28:58Z
        reason: Completed
        startedAt: 2018-12-03T11:28:58Z
  phase: Running
  podIP: 10.3.4.9
  qosClass: Guaranteed
  startTime: 2018-12-03T11:28:56Z
Nodepool screenshot from console:
agadelshin
on 3 Dec 2018
Huh, nothing obvious I can see. I can keep asking you for more and more info, but maybe it will be easier if you could open a GCP support case linking this github issue? That way we would be able to get all the information needed to debug ourselves.
MaciekPytel
on 3 Dec 2018
Just noticed that the pod spec provided is of a running and scheduled pod. I know it's probably implied, but just in case - the pods that from the same controller/using the same template, right?
 aleksandra-malinowska
on 3 Dec 2018
aleksandra-malinowska
on 3 Dec 2018
@aleksandra-malinowska yes, you're right. This exact pod was in pending state, I removed resource requests from other pods to run this.
agadelshin
on 4 Dec 2018
@MaciekPytel hmm, I'll look, but we don't have a paid support for this account right now (we're working on it :) )
agadelshin
on 4 Dec 2018
Another thing to check would be what is the size of pod address range assigned to the cluster. Default /14 supports up to 1008 nodes. If it was created with a smaller custom range, this can be much lower.
aleksandra-malinowska
on 4 Dec 2018
@aleksandra-malinowska tried to increase instance group manually and found that CPU Quota exceeded.
Thank you. I'm wondering if autoscaler can be more verbose about the reason of issue.
agadelshin
on 4 Dec 2018
Related issues
 mboersma
·
6Comments
mboersma
·
6Comments
 tjliupeng
·
6Comments
tjliupeng
·
6Comments
 hprotzek
·
5Comments
hprotzek
·
5Comments
 pkelleratwork
·
5Comments
pkelleratwork
·
5Comments
 bpinske
·
5Comments
bpinske
·
5Comments
Most helpful comment
@aleksandra-malinowska tried to increase instance group manually and found that CPU Quota exceeded.
Thank you. I'm wondering if autoscaler can be more verbose about the reason of issue.