Async-profiler: How to read the mprotect graph
Hi I am having a off-heap leak and have tried to use asyncProfiler to find the issue. All my sample are for several minute.
I have out put the malloc event, but that just shows me paths that are normal leading to input and output streams. It doesn't mean they are leaks.
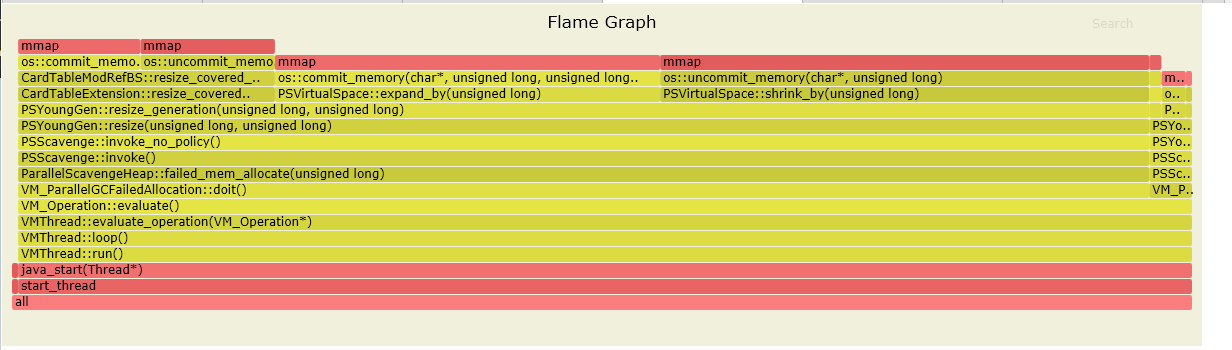
Then I tried mmap, but I don't see anything there.
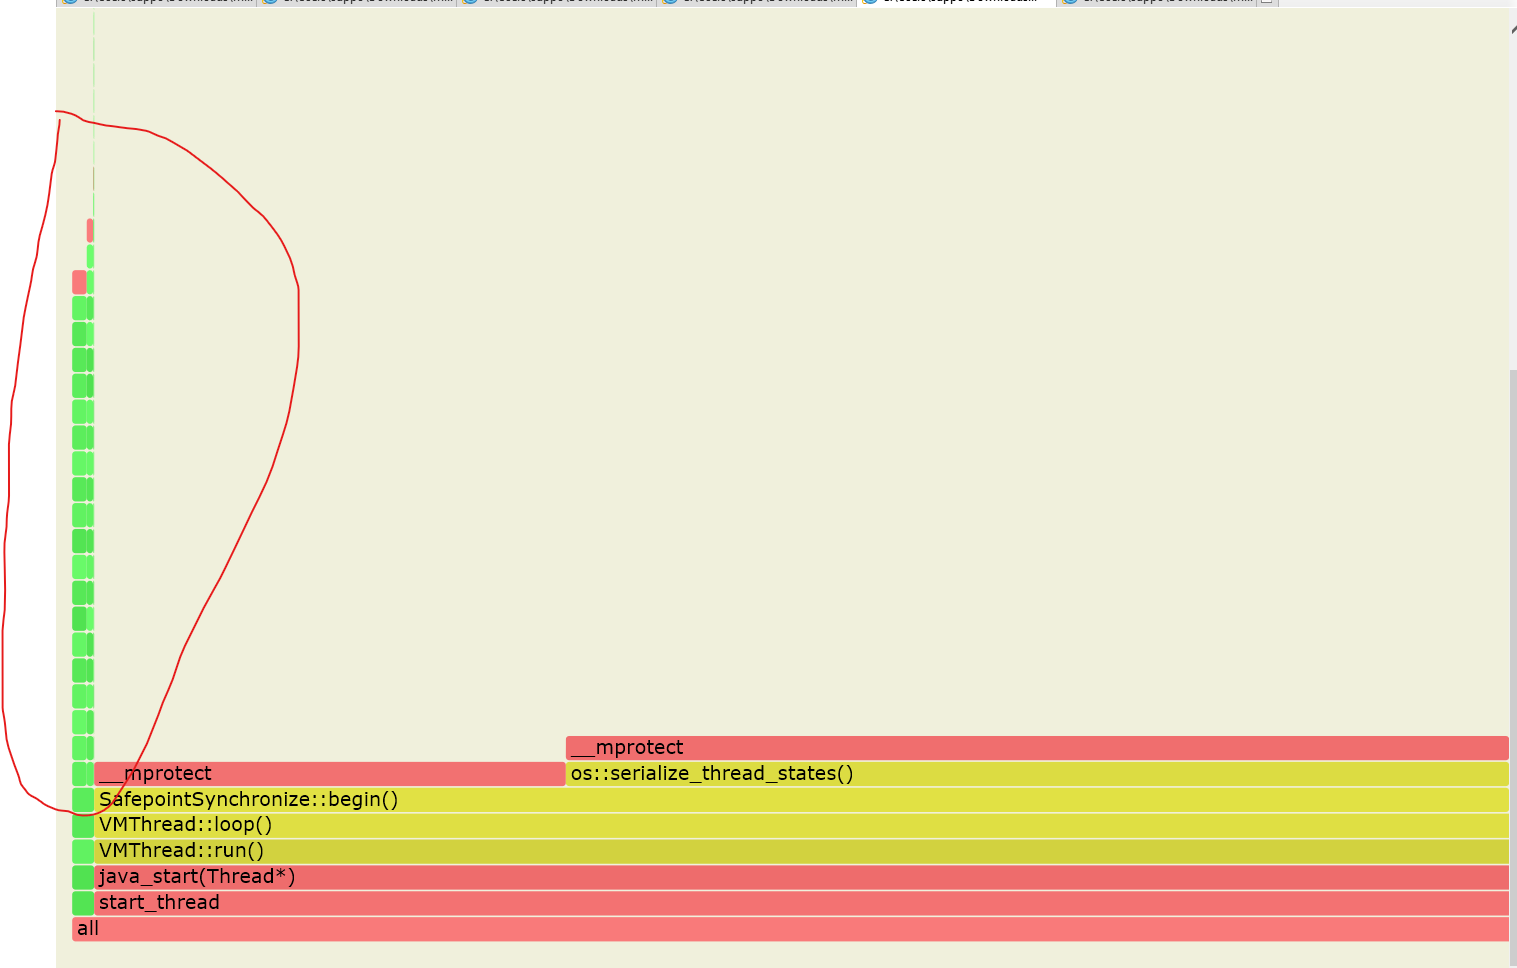
Then I finally tried mprotect.
But I'm not sure I'm understanding it. So here is the mprotect output. I can see that it's got some samples in the red circled area, you can see the details in the zipped file. But Not sure what to make of it. Those paths lead to some code that I am familiar with, but looking at them, they all have handled the closing of input and output streams in finally blocks.
So my question is, the paths shown in the mprotect output, do they necessarily mean they are leaks? If not, what does it mean? Thanks in advance!
 asyncProfilerUser
All 8 comments
I explained off-heap allocation and its relation to malloc/mprotect/mmap in this video.
Ignore the yellow side of mprotect flamegraph - these are just places where JVM changes state of the polling page and the serialize page. But the green part worth your attention. They denote places where RSS of the Java process grows. This a not necessary a leak, however, the fact that the total used memory usually increases at these places, should attract your attention.
Inflater/Deflater streams are common source of off-heap memory leaks, I also told about that in the presentation. Make sure that all Input/Output streams are properly closed, and the methods Deflated.end()/Inflater.end() are called when compression/decompression finishes.
Another common source of off-heap memory leak is the standard system allocator (glibc malloc), or, more precisely, fragmentation caused by the allocator. I always recommend using jemalloc or tcmalloc instead.
 apangin
on 31 Jul 2020
apangin
on 31 Jul 2020
I explained off-heap allocation and its relation to malloc/mprotect/mmap in this video.
Ignore the yellow side of
mprotectflamegraph - these are just places where JVM changes state of the polling page and the serialize page. But the green part worth your attention. They denote places where RSS of the Java process grows. This a not necessary a leak, however, the fact that the total used memory usually increases at these places, should attract your attention.Inflater/Deflater streams are common source of off-heap memory leaks, I also told about that in the presentation. Make sure that all Input/Output streams are properly closed, and the methods
Deflated.end()/Inflater.end()are called when compression/decompression finishes.Another common source of off-heap memory leak is the standard system allocator (glibc malloc), or, more precisely, fragmentation caused by the allocator. I always recommend using
jemallocortcmallocinstead.
Thanks so much. I'll go watch the video. And I will also try jemalloc or tcmalloc. Is there a straightforward documentation on how to install and activate those? Sorry I'm not a linux guy.
asyncProfilerUser
on 1 Aug 2020
An example of using jemalloc is also in the presentation.
For more details, see the project documentation.
apangin
on 1 Aug 2020
An example of using jemalloc is also in the presentation.
For more details, see the project documentation.
Thx so much. And also, amazing profiler!
asyncProfilerUser
on 1 Aug 2020
I have watched your video a few times. I did a benchmark test in my test server and profiled with asyncprofiler, switched to use jemalloc and profiled it again. When I use jemalloc, the mprotect flame graph does not report any mprotect calls from any of my java code, whereas the default malloc reports consistent calls to mprotect. I'm not sure if this result means jemalloc by itself fixed my leak. What are your thoughts? I plan to use jemalloc in my production server and see if the leak is affected.
asyncProfilerUser
on 1 Aug 2020
jemalloc works differently - it does not use mprotect, but extends the memory pool directly with mmap
apangin
on 1 Aug 2020
Just to update. I tested setting MALLOC_ARENA_MAX=4 without using jemelloc and after maybe 30 minutes, there were no longer any mprotect calls from my code. This didn't stop the java RES from going above the xmx of 8g, it went up to 12.4g after about 2 days. I ran it for 2 more extra days but it doesn't go past that. So that solved the leak problem I had previously where it would just keep going up until the server crashes.
Then I tried using jemelloc, without setting the MALLOC_ARENA_MAX variable. After about 30 minutes, there were no mmap calls from my code. And the Java process RES went to 8.6g max after around 1 days of uptime. Ran it for another extra day and it never goes above that. Without using jemelloc, it would have already gone above that by this time.
asyncProfilerUser
on 8 Aug 2020
jemalloc works differently - it does not use
mprotect, but extends the memory pool directly withmmap
For those of you finding this issue in your search results because profiling with mprotect graphs are empty, this is what you're here for!
You probably started by using jemalloc to generate that nice DAG that told you about native memory leaks and now you're here to use async-profiler to tell you where those leaks are coming from.
Now you're wondering why async-profiler -e mmalloc isn't providing any information. Well as @apangin says above, you need to disable jemalloc so that you can see actual calls tommalloc. Hope this helps! 💪 👋 ❤️
 rslifka
on 23 Nov 2020
rslifka
on 23 Nov 2020
Related issues
 egwepas
·
7Comments
egwepas
·
7Comments
 msridhar
·
6Comments
msridhar
·
6Comments
 marshallpierce
·
6Comments
marshallpierce
·
6Comments
 yaoliao
·
5Comments
apangin
·
5Comments
yaoliao
·
5Comments
apangin
·
5Comments