Async-profiler: Blamed wrong call with Arrays::fill
Hi!!
I was doing some experiments and I've found that with this test:
@State(Scope.Benchmark)
@BenchmarkMode(Mode.Throughput)
@OutputTimeUnit(TimeUnit.SECONDS)
@Warmup(iterations = 10, time = 1)
@Measurement(iterations = 15, time = 1)
@Fork(1)
public class InlineSkidFallacy {

    @Param("1000")
    int size;
    byte[] bytes;
    byte v;

    @Setup
    public final void setup() {
        bytes = new byte[size];
        v = 0x1;
    }


    @Benchmark
    public void arrayFillAndBlameTheCallerOfThePollExit() {
        Arrays.fill(bytes, v);
        blameMePlease();
    }

    private void blameMePlease() {
        notInlineableCall();
    }

    @CompilerControl(CompilerControl.Mode.DONT_INLINE)
    private void notInlineableCall() {

    }


    public static void main(String[] args) throws RunnerException {
        final Options opt = new OptionsBuilder()
                .include(InlineSkidFallacy.class.getSimpleName())
                .jvmArgs("-XX:+UnlockDiagnosticVMOptions","-XX:+DebugNonSafepoints")
                .addProfiler(LinuxPerfAsmProfiler.class)
                .build();
        new Runner(opt).run();
    }
}
The flame graph produced is:
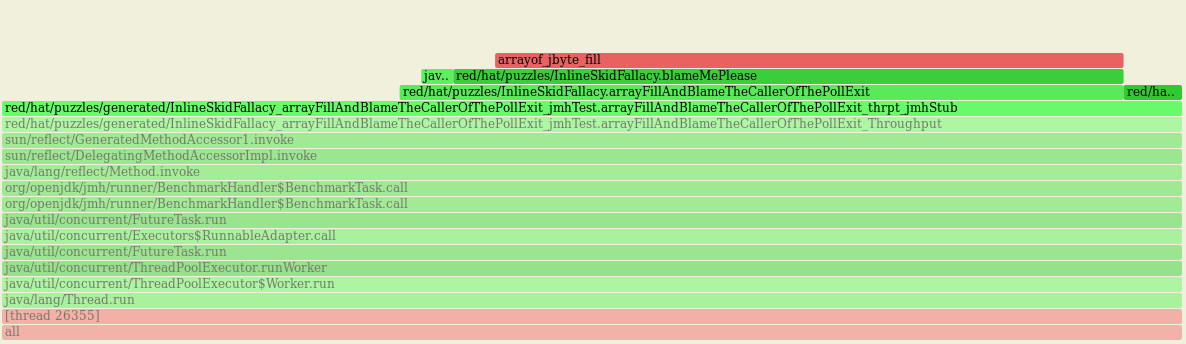
With blameMePlease becoming the caller of the arrayof_jbyte_fill instead of Arrays::fill.
notInlineableCall has become called by the JMH benchmark stub, instead.
In other contexts this has been considered an error dependent by skid + inlining calls, but given that seems 100% reproducible (with Java(TM) SE Runtime Environment (build 1.8.0_102-b14)) I suppose it should be something related to other problems. wdyt?
 franz1981
All 12 comments
I have tried with perf-java-flames adding -XX:+PreserveFramePointer with similar results:

The only difference seems that notInlineableCall has became called by the interpreter instead of the JMH stub.
franz1981
on 1 Jun 2018
Sounds like one of the known problems in AsyncGetStackTrace detailed in #66 (most likely https://bugs.openjdk.java.net/browse/JDK-8022893)
 retronym
on 1 Jun 2018
retronym
on 1 Jun 2018
@retronym It seems to happen on perf as well, but I can't say if is the same problem. It seems more like a problem while walking on the stack due to some missing information related to how the JVM handle Arrays::fill.
franz1981
on 1 Jun 2018
Right, the problem is somewhat similar to https://bugs.openjdk.java.net/browse/JDK-8022893
This is not a bug of async-profiler nor of AsyncGetCallTrace, but rather an issue with incorrect attribution of instructions to locations in the bytecode. perf-map-agent also shows wrong picture, since it receives incorrect mapping of PC address to Java method from JVMTI.
Here is how the benchmark method is compiled in JDK 8:
  0x000000000353a733: mov    %r11,%r10          ;*getstatic bytes
                                                ; - InlineSkidFallacy::benchmark@8 (line 25)

  0x000000000353a736: lea    0x10(%r11),%rcx
  0x000000000353a73a: mov    %ebx,%edx
  0x000000000353a73c: movabs $0x34638e0,%r10
  0x000000000353a746: callq  *%r10              ;*synchronization entry
                                                ; - InlineSkidFallacy::blameMePlease@-1 (line 35)
                                                ; - InlineSkidFallacy::arrayFillAndBlameTheCallerOfThePollExit@5 (line 31)
                                                ; - InlineSkidFallacy::benchmark@14 (line 25)

  0x000000000353a749: xchg   %ax,%ax
  0x000000000353a74b: callq  0x0000000003456620  ; OopMap{off=48}
                                                ;*invokestatic notInlineableCall
                                                ; - InlineSkidFallacy::blameMePlease@0 (line 35)
                                                ; - InlineSkidFallacy::arrayFillAndBlameTheCallerOfThePollExit@5 (line 31)
                                                ; - InlineSkidFallacy::benchmark@14 (line 25)
                                                ;   {static_call}
The instruction callq *%r10 which is a call to arrayof_jbyte_fill, is incorrectly attributed to blameMePlease @ bci=-1.
However, I can understand why this happens. C2 intrinsifies Arrays.fill call by detecting the fill loop pattern and replacing it entirely with a single JVM runtime leaf call. Thus all nodes attributed to Arrays.fill disappear.
BTW, JDK 10 no longer intrinsifies Arrays.fill. Instead it vectorizes the fill loop right in the compiled method. The profile looks sane in this case.
 apangin
on 1 Jun 2018
apangin
on 1 Jun 2018
@apangin @retronym Thanks guys to have looked into it: so it won't appear on JDK 10, good to hear that.
Given that is not directly related to both async-profiler or AsyncGetCallTrace, do you have any plan to create a workaround (if exists, I can't say what can be done when BCI < 0) on it to allow it to work for JDK 8/9?
franz1981
on 1 Jun 2018
@apangin Maybe OT, but how do you know that callq *%r10 is the call to arrayof_jbyte_fill? :O
franz1981
on 1 Jun 2018
how do you know that callq *%r10 is the call to arrayof_jbyte_fill
This is the only instruction in the compiled code that could call arrayof_jbyte_fill. It's also possible to lookup the above address (movabs $0x34638e0,%r10) in the map file generated by perf-map-agent.
apangin
on 1 Jun 2018
@apangin :+1: thanks!!! And about any eventual workaround? It is just curiousity, given that we will use JDK 10 at some point somehow :)
franz1981
on 1 Jun 2018
I can't do much about this unfortunately. JVM, which is supposed to be the credible source of such information, gives wrong method name.
We could probably skip the topmost Java frame if the recorded bci is -1, but I'm not sure this does not harm in other cases. I think I'll close this as "won't fix".
apangin
on 1 Jun 2018
@apangin I cannot disagree with you, making it unstable just for this case isn't a valid reason: I'm just shocked that Arrays::fill behave so differently from a "common" instrinsified call :(
franz1981
on 1 Jun 2018
@apangin @franz1981 FWIW in both the AP and PMA you are getting a more correct picture than with plain AsyncGetCallTrace which IIRC fails to walk the stack out of the array fill stub and returns an error :-)
So, a case of: "You think this is bad? you should have seen how it was before it got fixed"
 nitsanw
on 1 Jun 2018
nitsanw
on 1 Jun 2018
@nitsanw you're right, at least they give some hint of what is the "real" call to blame...I haven't tried JMC on it yet, I will do it, maybe HP too...
franz1981
on 1 Jun 2018
Related issues
 henryjcee
·
5Comments
apangin
·
5Comments
henryjcee
·
5Comments
apangin
·
5Comments
 ceeaspb
·
5Comments
ceeaspb
·
5Comments
 ryenus
·
5Comments
ryenus
·
5Comments
 shipilev
·
4Comments
shipilev
·
4Comments