Aspnetcore: .NET Core Debug Blazor Web Assembly in Chrome leads to forever spinning chrome page with about:blank in address bar
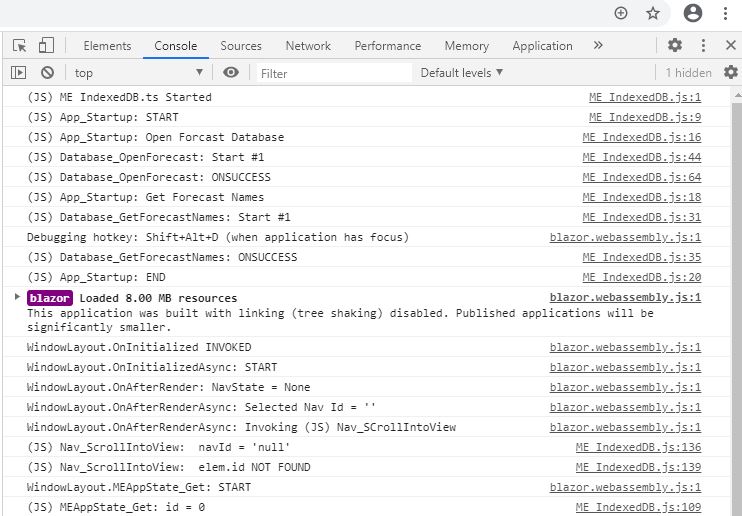
I am experiencing what appears to be this same problem. While I am a novice web developer, being new to it and Blazor as of June, I cannot see any differences between my situation and the previous one except that my app is a PWA. Also, not mentioned as I recall in the prior issue, I am using an IndexedDB that I open as part of the JS startup. That code may be running prior to the pause based on console log messages I issue as shown below, but I can't be sure of that.
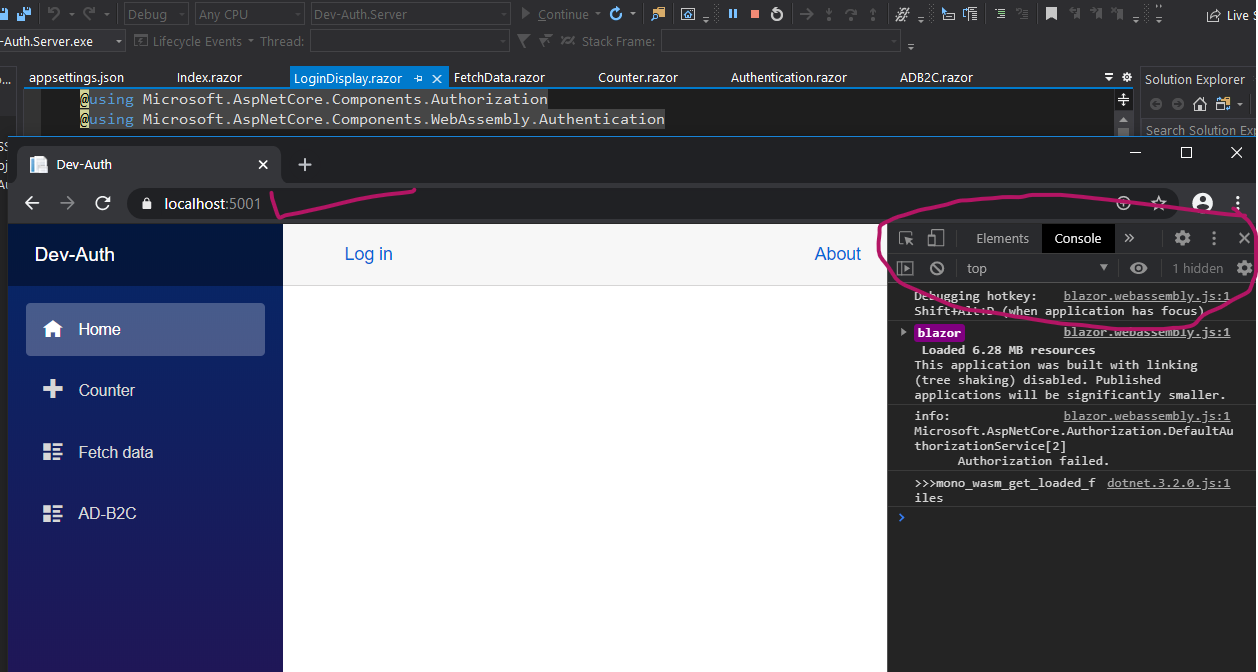
I get past pause by hitting Ctrl-Shift-J to bring the Chrome DevTools up. I have tried all the remedies suggested in the previous issue: (a) deleting obj and bin; (b) confirming I installed Microsoft.AspNetCore.Components.WebAssembly, including upgrading all to 3.2.1; and (c) trying @SteveSandersonMS "debug in the browser" suggestion. I have been experiencing debugger problems recently in that break points don't work in any of the Blazor lifecycle events, but do once the app is past those. The about:blank problem didn't show up until I upgraded VS Community 2019 to v16.7.0 earlier today. Any ideas how to get around it before I try going back to the previous VS version?
 CincySteve
All 24 comments
Try this. It worked for me after spending 3 days. I hope to help others with same issue till they figure it out.
While the browser is spinning, immediately open "dev tools" Windows its Control + Shift + i (Chrome)
 spkiran
on 9 Aug 2020
spkiran
on 9 Aug 2020
spkiran
on 9 Aug 2020
@spkiran @CincySteve I was facing the same problem. Opening the "_development tools_" also solves this problem (although it shouldn't be necessary). I am using Visual Studio 16.8.0 Preview 1.0 with .NET 5.0 Preview 7.
 boukenka
on 9 Aug 2020
boukenka
on 9 Aug 2020
@spkiran @boukenka Thanks for the suggestion. I have been using the same workaround.
I just checked a different, much simpler and smaller Blazor app. It opened without the about:blank pause. So it would seem something we are doing in the pausing apps is revealing the problem.
I have just tried commenting out _all_ of my lifecycle event code and IndexedDB operations that occur when my JS code initiates to see if any of that makes it stop pausing. It still paused. Then, just to be thorough, I tried removing all conditional logic from my page markup. It still paused then too.
Incidentally, I forgot to mention in the initial post that my app is single page in addition to being PWA, though I don't see how that might be relevant.
CincySteve
on 9 Aug 2020
Additional observations:
-- The pause just went away for a period of time (during maybe a dozen app restarts) and has now returned.
-- I had been adding Console.Writeline statements in a static class to get around the fact that the debugger was no longer stopping at break points.
-- During this time, Chrome kept stopping at what looked like a break point within dotnet.3.2.0.js. VS was not showing a stop at any of the break points I had set. [As a side note, I have experienced Chrome break points within the dotnet code for quite some time. I thought that might have been triggered when I commented out code that had a break point in it, but I'm not certain about that. In general, break point handling has behaved in unexpected ways since I started debugging Blazor and Chrome.]
-- I removed all my VS break points, though I don't think this was immediately before the pause went away.
-- An EventCallback I have in one of my child Blazor components had been hitting an "Object reference not set" exception when my code tried to invoke it (via "await ClickCallback.InvokeAsync(navName);"). I was trying to solve this problem (which I think I now understand) during this time. I only mention it because this exception stopped happening during this same time and is now back again.
While I am clearly over my head in this, I'm wondering whether the pause is triggered by some thread race condition.
P.S. The pause has continued to go away and come back for the last 6 hours, seemingly at random. Now that I think about it more, the pause has been happening since long before I upgraded VS. It was much less frequent than it is now, so I just ignored it and restarted the app. This was before I discovered the workaround of starting Chome DevTools.
CincySteve
on 10 Aug 2020
Thanks for contacting us.
We're moving this issue to the Next sprint planning milestone for future evaluation / consideration. We will evaluate the request when we are planning the work for the next milestone. To learn more about what to expect next and how this issue will be handled you can read more about our triage process here.
![msftbot[bot] picture](https://avatars2.githubusercontent.com/in/26612?v=4&s=40) msftbot[bot]
on 11 Aug 2020
msftbot[bot]
on 11 Aug 2020
@NTaylorMullen Thanks for the quick response. I understand the need to triage. Please let me know if there is more info I can begin collecting now in prep for your investigation.
Also, I could use some help with my subscription to this issue. It shows that I am subscribed and the email in my profile is correct, but I am getting no email notices from this or other issues. This is especially important since the triage process says I will need to respond reasonably quickly once the issue bubbles to the surface.
Finally, I'll note that this issue on top of this one and this one (which seem related) are collectively a very big productivity drain. To get around the data visibility issues (that are slated for 5.0.0), I have to keep adding local variable assignments or console messages and then restarting the app so I can see the data. Clearly the data visibility problem is the biggie, but this one exacerbates that problem for now.
P.S. Just re-read the @SteveSandersonMS "debug in the browser" suggestion from the original posting of this issue that I found. I had missed the part about trying to add a delay in OnInitialized. That didn't get around the problem. Based on watching the console log after waiting to see if the pause would end and then starting Chrome DevTools manually, it appears the pause is happening before OnInitialized is invoked.
P.P.S. Sorry to incrementally add info, but I just noticed that break points in this app don't start taking affect right away, but do eventually. The delay is about 5 seconds. I put a break point on one statement and keep clicking a button until eventually the break point stops the debugger.
CincySteve
on 11 Aug 2020
Sorry to incrementally add info, but I just noticed that break points in this app don't start taking affect right away, but do eventually. The delay is about 5 seconds. I put a break point on one statement and keep clicking a button until eventually the break point stops the debugger.
This is expected as it takes us a little while to initialize the debugging experience. We're hoping to ship improvements to this launch time in upcoming releases.
The about:blank problem didn't show up until I upgraded VS Community 2019 to v16.7.0 earlier today.
Just to confirm: you only run into this issue when starting debugging from VS. Does debugging in the browser also cause it to hang in about:blank?
To help us get started, can you share the log file located in %TEMPDIR%/vscode-chrome-debug.txt after reproducing this issue in VS?
 captainsafia
on 15 Aug 2020
captainsafia
on 15 Aug 2020
same issue for me
 Gambero81
on 1 Sep 2020
Gambero81
on 1 Sep 2020
@captainsafia Sorry to be so slow to respond. I am not getting notices when comments are added to this issue for some reason. Anyway, I've attached the log file at the point where the app open is stuck. When I experience this problem, it is always when starting the app/debugger in VS. I don't know how to start it directly in Chrome. Incidentally, the problem continues to happen most times when I start the app/debugger, but certainly not always. I still don't see what makes it happen some times and not others.
vscode-chrome-debug.txt
CincySteve
on 1 Sep 2020
I have the same issue.
Visual Studio 16.7.3 and .NET Core 3.1.8.
When app is loading nothing is showing and title page is about:blank. Opening Chrome DevTools instantly triggers app to run.
 mchilicki
on 15 Sep 2020
mchilicki
on 15 Sep 2020
Thanks for sharing the logs, @CincySteve. I haven't been able to reproduce the particular issue you are running into with Blazor WASM 3.2 + VS 16.7.4. There are a few oddities in the log file that we are investigating.
For folks running into issues, I'd recommend verifying if you run into the same problems with the latest .NET 5 release and the VS 16.8 Preview.
captainsafia
on 23 Sep 2020
@CincySteve One more piece of info here: can you share your app's blazor.boot.json? I suspect that the issue is related to the number of assemblies/PDBs used by your app. As a result, it takes a slightly longer amount of time than expected to load the assemblies in the DebugProxy which causes the hang on about:blanl.
captainsafia
on 28 Sep 2020
Thanks for contacting us.
We're moving this issue to the Next sprint planning milestone for future evaluation / consideration. We will evaluate the request when we are planning the work for the next milestone. To learn more about what to expect next and how this issue will be handled you can read more about our triage process here.
msftbot[bot]
on 28 Sep 2020
Hi @captainsafia ,
I'm experiencing the same issue.
Below you can find my blazor.boot.json content:
{
  "cacheBootResources": true,
  "config": [ ],
  "debugBuild": true,
  "entryAssembly": "Web.Client",
  "linkerEnabled": false,
  "resources": {
    "assembly": {
      "Web.Client.dll": "sha256-39pDUbfqsLul4Trk45910vOOXLmsZAQz9eF6oFVOVNE=",
      "System.Net.Http.Json.dll": "sha256-WkuXkEV\/\/B1J2kYqjuSPxgHubOHALmA548PhKTed2JE=",
      "System.Buffers.dll": "sha256-ZxXy75PYbzJxNfAc\/SAP1nUYm4gt1jSaOpFnBb9m85M=",
      "mscorlib.dll": "sha256-BaZPMj95+YNe3G4ckTGD6szZFwZeA2MOHn91zTGKDeU=",
      "System.Threading.Tasks.Extensions.dll": "sha256-TkH6yxFQlTfY8NfznePrCdYJiEVpM9Dqy4Uu4H9qk10=",
      "System.Memory.dll": "sha256-\/cPXlNTX8GKF\/lIn\/2DIjtxTe0Wpy4ZDcyAj67b6JYk=",
      "System.Text.Json.dll": "sha256-HQeN+ZfHAERO+uW0fP0J9J3WV1hQ3vUIOWbqGSYBPp8=",
      "System.Runtime.CompilerServices.Unsafe.dll": "sha256-kL\/omZDwqByAi+lPdMeDmr3XjHcn4RVb+LmZ4mut1Yc=",
      "Microsoft.Bcl.AsyncInterfaces.dll": "sha256-OBWh2or+2mU6elwqPfmL72FBZVKl2WzTJ4L\/IrKeXM4=",
      "netstandard.dll": "sha256-\/zcPVM75OAY+joGVM8yIC1gO1SFYWP1CFERgQ8PJkfA=",
      "System.Xml.Linq.dll": "sha256-IPbQMdJxZXdk8HTlaPyXdQ6Zb82iZLphnM74yO4EURQ=",
      "System.Core.dll": "sha256-Zw2\/5aDWjgMedporhjigwhi\/UCLcfl0tfa0LXUyD9HE=",
      "System.dll": "sha256-r6QdEXq0KfB8oZDzhnV4xskSbzJA0yBVi6XFpa3TGHM=",
      "WebAssembly.Net.WebSockets.dll": "sha256-ob5gN\/szfb1CwWnyQWvWvuid3u4df593KvZeoJQEaKc=",
      "WebAssembly.Bindings.dll": "sha256-6XMT1eT3svGdg6hFzAHJscYdTQjakoYccYTdHmKSr7Y=",
      "System.Numerics.dll": "sha256-8g0neeYVmPrxWgbMI0ZTVO6257qMisUTPZ78egAnIMw=",
      "System.Xml.dll": "sha256-RMOYBniHZkD8OZrBV3ONIMTZqsBhSAcBFm4pVuY9dv4=",
      "Mono.Security.dll": "sha256-fMngt4py0YmfHqV6eONyCI6R5m+YOE7KZ3U4MzCrskE=",
      "System.Transactions.dll": "sha256-VAHA4LWcsdHUBgFG1\/xwhc4IyJ0ZH9UyK9+qSPzDa6Y=",
      "System.Runtime.Serialization.dll": "sha256-C09aqx1vDLK7zQ9XnZcUqAgTDRwybxhRg\/FR8HSk1v8=",
      "System.ServiceModel.Internals.dll": "sha256-6mtLxbGMMGcIfch8cp0W9gmBoI493AxBRUPGEzOn3nU=",
      "System.Net.Http.dll": "sha256-moW4EYN6ExD6T0vSBMMggn62cZaTd8dSr9b\/yj\/9dPM=",
      "System.Net.Http.WebAssemblyHttpHandler.dll": "sha256-LUtkiqNd5ABTiuiYaqzaJxVjPq+Z4FqezuIWk\/faqSA=",
      "System.ComponentModel.Composition.dll": "sha256-R8CUbbWAKar388eFQJhUgiTgLEv2Mih9wr9iO0P7ImU=",
      "System.IO.Compression.FileSystem.dll": "sha256-ptCMHBy9q8MMLU0ukLMuvvhQk\/yYljw37MTKtfsvuFQ=",
      "System.IO.Compression.dll": "sha256-hLbkXBzxUk9DSXYTLGRowe+80rxmpXsqEZbPIL4+5zs=",
      "System.Drawing.Common.dll": "sha256-vcCLMX4xAsUqKuQjjIkzu1O9pHGO\/tdvysgSmEjL6oo=",
      "System.Data.DataSetExtensions.dll": "sha256-eejp4oI3sQBq\/tI6GsJNaPu3Dkdot5Vbn8+R3w2vYLE=",
      "System.Data.dll": "sha256-dxfTuT6ffPMmvuUUTfv7+bpLtOZZZHQdz77hjhy9qHw=",
      "System.Numerics.Vectors.dll": "sha256-qAKfFnquY+7UC\/MzLi04rjqEhLzTryCoLg\/S6MxI19I=",
      "System.Text.Encodings.Web.dll": "sha256-Tqh1Da+iTRQJEZUGAsMNFuZ4hf1PMf13WApRZod+uw4=",
      "Microsoft.Extensions.DependencyInjection.Abstractions.dll": "sha256-Bs1Wrmh4ex9dTEIT0yCRF52N\/wOmsBDt457BHr0\/ssM=",
      "Microsoft.AspNetCore.Components.Web.dll": "sha256-bSgsT2x5xMvs8mara5wU+EJwcyHa9GVMU85HwhWcdWM=",
      "Microsoft.AspNetCore.Components.Forms.dll": "sha256-m7Q+cF5\/ji3OMfdGlCuE8pQ\/iM+kxNHLq\/IEWVvIaOg=",
      "System.ComponentModel.Annotations.dll": "sha256-tmnkCmP9OzLUkpQ3LP7PRosi7gt5pyfEZCM6aqAokFI=",
      "System.ComponentModel.DataAnnotations.dll": "sha256-LIfCYwg+PHltTK4z3EnbSkA7m2cn8JS4jHVthdKrDF8=",
      "Microsoft.AspNetCore.Components.dll": "sha256-PEg9ghiKSWBTX0jq8pFDvv2Yvw92Y8W0ELtWrSE4fhA=",
      "Microsoft.Extensions.Logging.Abstractions.dll": "sha256-6gJMwefpsWLHWsEipZp143xn8k2Ea27upnXqjUT6iNI=",
      "OneOf.dll": "sha256-K99lDyL6VrtTDYGRk5o+Q3caW25Uogee\/1e7aIvpgLY=",
      "System.Runtime.dll": "sha256-6CpyRQAYrVPJfNYBKH0K9lWX+rNPO15lwNhGHPmvxtk=",
      "Web.Shared.dll": "sha256-VSXyMt3FnfalnVM4dX5ljU3x3UL9x7LyiRNrw4o7yRE=",
      "Microsoft.AspNetCore.Components.Authorization.dll": "sha256-5lY1KL\/pA7kS\/OYycrkrhkXJKFHJHVbdmUTyPYaqDiM=",
      "Microsoft.AspNetCore.Authorization.dll": "sha256-4NUQ26HmvXRi8smc0jz9940OUECDLQnoMWQLrMLe0ok=",
      "Microsoft.Extensions.Options.dll": "sha256-rvTW0d54uLW0iDMAX30lpmr9f8uHoS3YYkEU5zNGhyc=",
      "Microsoft.Extensions.Primitives.dll": "sha256-y\/FyJQOcW2TOcTp7Iuv8brGBzL5ZP0oJdG7ysK+gtKc=",
      "Microsoft.AspNetCore.Metadata.dll": "sha256-825GQI5nG1C1WqLD1SNKSpjzLCNbH2\/KChgjBL0SSXI=",
      "AntDesign.dll": "sha256-IDPyx56CBerJpQ62sQ+AjmMZn6CFGenGB2R511thpyE=",
      "Microsoft.AspNetCore.Components.DataAnnotations.Validation.dll": "sha256-VGaB03HIjFg4jeK7BomIFzlhhY3vW5N+jWuRqZkbJsY=",
      "Microsoft.JSInterop.dll": "sha256-LqwA2Rpm96Ualk0IhLZar87kfRCyKHzHTeTt2jYhm7M=",
      "Microsoft.AspNetCore.Components.WebAssembly.dll": "sha256-FJ+rEgcx6ljTxwbRXZSUGfrDKpVvOxHCSfNxbnXNn3M=",
      "Microsoft.Extensions.DependencyInjection.dll": "sha256-oK1Bjv95fH+hSbogUkJE+xDAI203kJG6lL6Sm\/NuPWg=",
      "Microsoft.Extensions.Configuration.dll": "sha256-n0Ag7rF7ZQamklPSZkakIXkRoa6JwlmPSS0cRaAhJQM=",
      "Microsoft.Extensions.Configuration.Abstractions.dll": "sha256-2jNkt\/\/JGfoqWNB8whRdJotnsanWbH3FfxZWz0gyLTs=",
      "Microsoft.Extensions.Configuration.Json.dll": "sha256-mQqyOIjuVduaLQ7ZyvDrChDLp8rTeQknIIWDzqsO4eY=",
      "Microsoft.Extensions.Configuration.FileExtensions.dll": "sha256-3trD3kyUrc0a2IrNSfLT2rSZ35MMdD2qtqG+vk+U8QA=",
      "Microsoft.Extensions.FileProviders.Physical.dll": "sha256-tY1dlliVr+yGzBF7d0z\/iaulZfBJNaSrCKDD0RP2cc8=",
      "Microsoft.Extensions.FileSystemGlobbing.dll": "sha256-r8LuqDQgcB\/c3E48xHqsAY1eRZB1ZtuqZF6nlufn7kg=",
      "Microsoft.Extensions.FileProviders.Abstractions.dll": "sha256-DrtNiKIMjfSOdamH5Bs5zHmjFADgNiwrY5tRgTm6XuI=",
      "Microsoft.Extensions.Logging.dll": "sha256-+kkwUt5LUrFrnFcHiSvLP3Ps50UAimB6C5utgehqOo4=",
      "Microsoft.JSInterop.WebAssembly.dll": "sha256-czNf3btAeBW\/vvID5LAfgcsNZ+GM3ssVuPaMflcg0rs="
    },
    "pdb": {
      "Web.Client.pdb": "sha256-5YOJzjJ1h1MRxLzfo\/RblV0MWlHErFEZHALUcbSSLKs=",
      "Web.Shared.pdb": "sha256-OB9fA09hoQDCxlzoWpuL5ZWZBRBSdoNAlL7EhV7A1Ak="
    },
    "runtime": {
      "dotnet.3.2.0.js": "sha256-mPoqx7XczFHBWk3gRNn0hc9ekG1OvkKY4XiKRY5Mj5U=",
      "dotnet.timezones.dat": "sha256-3S0qzYaBEKOBXarzVLNzNAFXlwJr6nI3lFlYUpQTPH8=",
      "dotnet.wasm": "sha256-UC\/3Rm1NkdNdlIrzYARo+dO\/HDlS5mhPxo0IQv7kma8="
    },
    "satelliteResources": null
  }
}
 FredericMa
on 28 Sep 2020
FredericMa
on 28 Sep 2020
{
"cacheBootResources": true,
"config": [ ],
"debugBuild": true,
"entryAssembly": "ME Web",
"linkerEnabled": false,
"resources": {
"assembly": {
"ME Web.dll": "sha256-S8LqZOCKPP5fX2LI2OKax44ETdWOBTl4UpLW0c1ZCGE=",
"System.Net.Http.Json.dll": "sha256-WkuXkEV//B1J2kYqjuSPxgHubOHALmA548PhKTed2JE=",
"System.Buffers.dll": "sha256-ZxXy75PYbzJxNfAc/SAP1nUYm4gt1jSaOpFnBb9m85M=",
"mscorlib.dll": "sha256-BaZPMj95+YNe3G4ckTGD6szZFwZeA2MOHn91zTGKDeU=",
"System.Threading.Tasks.Extensions.dll": "sha256-TkH6yxFQlTfY8NfznePrCdYJiEVpM9Dqy4Uu4H9qk10=",
"System.Memory.dll": "sha256-/cPXlNTX8GKF/lIn/2DIjtxTe0Wpy4ZDcyAj67b6JYk=",
"System.Text.Json.dll": "sha256-HQeN+ZfHAERO+uW0fP0J9J3WV1hQ3vUIOWbqGSYBPp8=",
"System.Runtime.CompilerServices.Unsafe.dll": "sha256-kL/omZDwqByAi+lPdMeDmr3XjHcn4RVb+LmZ4mut1Yc=",
"Microsoft.Bcl.AsyncInterfaces.dll": "sha256-OBWh2or+2mU6elwqPfmL72FBZVKl2WzTJ4L/IrKeXM4=",
"netstandard.dll": "sha256-/zcPVM75OAY+joGVM8yIC1gO1SFYWP1CFERgQ8PJkfA=",
"System.Xml.Linq.dll": "sha256-IPbQMdJxZXdk8HTlaPyXdQ6Zb82iZLphnM74yO4EURQ=",
"System.Core.dll": "sha256-Zw2/5aDWjgMedporhjigwhi/UCLcfl0tfa0LXUyD9HE=",
"System.dll": "sha256-r6QdEXq0KfB8oZDzhnV4xskSbzJA0yBVi6XFpa3TGHM=",
"WebAssembly.Net.WebSockets.dll": "sha256-ob5gN/szfb1CwWnyQWvWvuid3u4df593KvZeoJQEaKc=",
"WebAssembly.Bindings.dll": "sha256-6XMT1eT3svGdg6hFzAHJscYdTQjakoYccYTdHmKSr7Y=",
"System.Numerics.dll": "sha256-8g0neeYVmPrxWgbMI0ZTVO6257qMisUTPZ78egAnIMw=",
"System.Xml.dll": "sha256-RMOYBniHZkD8OZrBV3ONIMTZqsBhSAcBFm4pVuY9dv4=",
"Mono.Security.dll": "sha256-fMngt4py0YmfHqV6eONyCI6R5m+YOE7KZ3U4MzCrskE=",
"System.Transactions.dll": "sha256-VAHA4LWcsdHUBgFG1/xwhc4IyJ0ZH9UyK9+qSPzDa6Y=",
"System.Runtime.Serialization.dll": "sha256-C09aqx1vDLK7zQ9XnZcUqAgTDRwybxhRg/FR8HSk1v8=",
"System.ServiceModel.Internals.dll": "sha256-6mtLxbGMMGcIfch8cp0W9gmBoI493AxBRUPGEzOn3nU=",
"System.Net.Http.dll": "sha256-moW4EYN6ExD6T0vSBMMggn62cZaTd8dSr9b/yj/9dPM=",
"System.Net.Http.WebAssemblyHttpHandler.dll": "sha256-LUtkiqNd5ABTiuiYaqzaJxVjPq+Z4FqezuIWk/faqSA=",
"System.ComponentModel.Composition.dll": "sha256-R8CUbbWAKar388eFQJhUgiTgLEv2Mih9wr9iO0P7ImU=",
"System.IO.Compression.FileSystem.dll": "sha256-ptCMHBy9q8MMLU0ukLMuvvhQk/yYljw37MTKtfsvuFQ=",
"System.IO.Compression.dll": "sha256-hLbkXBzxUk9DSXYTLGRowe+80rxmpXsqEZbPIL4+5zs=",
"System.Drawing.Common.dll": "sha256-vcCLMX4xAsUqKuQjjIkzu1O9pHGO/tdvysgSmEjL6oo=",
"System.Data.DataSetExtensions.dll": "sha256-eejp4oI3sQBq/tI6GsJNaPu3Dkdot5Vbn8+R3w2vYLE=",
"System.Data.dll": "sha256-dxfTuT6ffPMmvuUUTfv7+bpLtOZZZHQdz77hjhy9qHw=",
"System.Numerics.Vectors.dll": "sha256-qAKfFnquY+7UC/MzLi04rjqEhLzTryCoLg/S6MxI19I=",
"System.Text.Encodings.Web.dll": "sha256-Tqh1Da+iTRQJEZUGAsMNFuZ4hf1PMf13WApRZod+uw4=",
"Microsoft.Extensions.DependencyInjection.Abstractions.dll": "sha256-Bs1Wrmh4ex9dTEIT0yCRF52N/wOmsBDt457BHr0/ssM=",
"Microsoft.AspNetCore.Components.Web.dll": "sha256-bSgsT2x5xMvs8mara5wU+EJwcyHa9GVMU85HwhWcdWM=",
"Microsoft.AspNetCore.Components.Forms.dll": "sha256-m7Q+cF5/ji3OMfdGlCuE8pQ/iM+kxNHLq/IEWVvIaOg=",
"System.ComponentModel.Annotations.dll": "sha256-tmnkCmP9OzLUkpQ3LP7PRosi7gt5pyfEZCM6aqAokFI=",
"System.ComponentModel.DataAnnotations.dll": "sha256-LIfCYwg+PHltTK4z3EnbSkA7m2cn8JS4jHVthdKrDF8=",
"Microsoft.AspNetCore.Components.dll": "sha256-PEg9ghiKSWBTX0jq8pFDvv2Yvw92Y8W0ELtWrSE4fhA=",
"Microsoft.Extensions.Logging.Abstractions.dll": "sha256-6gJMwefpsWLHWsEipZp143xn8k2Ea27upnXqjUT6iNI=",
"Microsoft.JSInterop.dll": "sha256-LqwA2Rpm96Ualk0IhLZar87kfRCyKHzHTeTt2jYhm7M=",
"Microsoft.AspNetCore.Components.WebAssembly.dll": "sha256-FJ+rEgcx6ljTxwbRXZSUGfrDKpVvOxHCSfNxbnXNn3M=",
"Microsoft.Extensions.DependencyInjection.dll": "sha256-oK1Bjv95fH+hSbogUkJE+xDAI203kJG6lL6Sm/NuPWg=",
"Microsoft.Extensions.Primitives.dll": "sha256-y/FyJQOcW2TOcTp7Iuv8brGBzL5ZP0oJdG7ysK+gtKc=",
"Microsoft.Extensions.Configuration.dll": "sha256-n0Ag7rF7ZQamklPSZkakIXkRoa6JwlmPSS0cRaAhJQM=",
"Microsoft.Extensions.Configuration.Abstractions.dll": "sha256-2jNkt//JGfoqWNB8whRdJotnsanWbH3FfxZWz0gyLTs=",
"Microsoft.Extensions.Configuration.Json.dll": "sha256-mQqyOIjuVduaLQ7ZyvDrChDLp8rTeQknIIWDzqsO4eY=",
"Microsoft.Extensions.Configuration.FileExtensions.dll": "sha256-3trD3kyUrc0a2IrNSfLT2rSZ35MMdD2qtqG+vk+U8QA=",
"Microsoft.Extensions.FileProviders.Physical.dll": "sha256-tY1dlliVr+yGzBF7d0z/iaulZfBJNaSrCKDD0RP2cc8=",
"Microsoft.Extensions.FileSystemGlobbing.dll": "sha256-r8LuqDQgcB/c3E48xHqsAY1eRZB1ZtuqZF6nlufn7kg=",
"Microsoft.Extensions.FileProviders.Abstractions.dll": "sha256-DrtNiKIMjfSOdamH5Bs5zHmjFADgNiwrY5tRgTm6XuI=",
"Microsoft.Extensions.Logging.dll": "sha256-+kkwUt5LUrFrnFcHiSvLP3Ps50UAimB6C5utgehqOo4=",
"Microsoft.Extensions.Options.dll": "sha256-rvTW0d54uLW0iDMAX30lpmr9f8uHoS3YYkEU5zNGhyc=",
"Microsoft.JSInterop.WebAssembly.dll": "sha256-czNf3btAeBW/vvID5LAfgcsNZ+GM3ssVuPaMflcg0rs="
},
"pdb": {
"ME Web.pdb": "sha256-6210w4jpZpZ83rkycwV0k8ieKRcoBGXmYRAiVyBRetw="
},
"runtime": {
"dotnet.3.2.0.js": "sha256-mPoqx7XczFHBWk3gRNn0hc9ekG1OvkKY4XiKRY5Mj5U=",
"dotnet.timezones.dat": "sha256-3S0qzYaBEKOBXarzVLNzNAFXlwJr6nI3lFlYUpQTPH8=",
"dotnet.wasm": "sha256-UC/3Rm1NkdNdlIrzYARo+dO/HDlS5mhPxo0IQv7kma8="
},
"satelliteResources": null
}
}
CincySteve
on 28 Sep 2020
I've run into the same (or a similar?) issue today. Having a launch.json containing
{
  "type": "blazorwasm",
  "request": "launch",
  "name": "Launch and Debug"
}
Works fine 👍
But just hitting F5 and selecting Blazor without that, as the tutorial recommends, leaves me on an about:blank page which eventually times out with the error

I notice the Terminal also doesn't pop up like it normally does when running the launch config, so maybe the build or proxy isn't getting kicked off.
 connor4312
on 29 Sep 2020
connor4312
on 29 Sep 2020
In case it helps, this seems to only happen to me with PWAs.
I noticed this starts to happen when I create a new ASP.NET Hosted WASM PWA from the standard template and delete the WeatherController from the server, weather class from the shared lib, the Counter and FetchData components and then clean out the menu items in the NavMenu component from client. From that point on, it's an issue on the first load when launching from VS.
No code is added, this is just cleaning out the sample code. It's reproduceable on two separate machines creating new projects in VS 2019 16.7.5. One had 2019 preview and .NET 5 RC installed, although when I saw this I was not in the preview or using .NET 5.
If I manually remove the /bin and /obj folders from the projects it starts working again. At least once, if it was hanging, all I deleted was the /bin and /obj folders from the Shared project and it restarted fine the next several times I tried.
Removing those same items from a non-PWA does not seem to cause the issue.
 jimleonardo
on 6 Oct 2020
jimleonardo
on 6 Oct 2020
@jimleonardo It looks like there might be a legitimate build issue in your application that prevents the application from launching successfully. Can you confirm that the application server was launched successfully? If so, please open a new issue.
captainsafia
on 6 Oct 2020
@captainsafia I was just listing a few steps that I could take to reliably reproduce the issue reported by CincySteve without even having to add any new code. Just remove the couple of sample pages, leave the rest of it alone, and I see the issue where it just spins on launch from VS. As soon as I open the browser devtools, the page loads and app runs fine.
jimleonardo
on 7 Oct 2020
We've moved this issue to the Backlog milestone. This means that it is not going to be worked on for the coming release. We will reassess the backlog following the current release and consider this item at that time. To learn more about our issue management process and to have better expectation regarding different types of issues you can read our Triage Process.
msftbot[bot]
on 9 Oct 2020
Thanks for contacting us.
We're moving this issue to the Next sprint planning milestone for future evaluation / consideration. We will evaluate the request when we are planning the work for the next milestone. To learn more about what to expect next and how this issue will be handled you can read more about our triage process here.
msftbot[bot]
on 9 Oct 2020
@jimleonardo Great tip on PWA. I just unregistered the service worker in my app (which I was told removed PWA) and it is no longer getting hung on startup (using the VS debugger). Hopefully restoring PWA will be as easy once I get to the point of needing it.
Steve
CincySteve
on 10 Oct 2020
Use Edge instead of Chrome
 Tricklebyte
on 30 Oct 2020
Tricklebyte
on 30 Oct 2020
Related issues
 Kevenvz
·
3Comments
Kevenvz
·
3Comments
 rynowak
·
3Comments
rynowak
·
3Comments
 fayezmm
·
3Comments
fayezmm
·
3Comments
 BrennanConroy
·
3Comments
BrennanConroy
·
3Comments
 mj1856
·
3Comments
mj1856
·
3Comments
Most helpful comment
@jimleonardo Great tip on PWA. I just unregistered the service worker in my app (which I was told removed PWA) and it is no longer getting hung on startup (using the VS debugger). Hopefully restoring PWA will be as easy once I get to the point of needing it.
Steve