Aspnetcore: CPU utilization steadily grows in asp.net core 3.1
We are migrating our web-site from core 2.2 to core 3.1
At the point two issues remain:
- Under stress load on the stand, the CPU utilization steadily grows (while the load remains the same)
- We see about 10 times more gen-0 garbage collections
CPU utilization:

Things to note:
- On the stand, there's 3 machines
- The two graphs steadily growing are from two machines with 3.1 deployed
- The green graph remaining the same is from a machine with 2.2 deployed
Garbage collections:

The bumped graphs are gen-0 collections after is 3.1 deployed (under load)
At the same time the overall process memory remains the same:

Are there any ideas where to look for the issue?
 dmitry-novoselov
All 18 comments
Take a CPU profile with dotnet trace that might help. I assume those numbers come from dotnet counters?
cc @Maoni0 @noahfalk @shirhatti
 davidfowl
on 26 Jul 2020
davidfowl
on 26 Jul 2020
a trace would definitely help.
 Maoni0
on 28 Jul 2020
Maoni0
on 28 Jul 2020
Take a CPU profile with dotnet trace
Sorry for not responding. Was taking a vacation. Will give it a try, thanks.
dmitry-novoselov
on 3 Aug 2020
Here's a couple of traces I took:
https://drive.google.com/file/d/1y7uqr8VTcSLW2BfsmNu7MLawBffI1lkH/
https://drive.google.com/file/d/1YXh8NdGcMVgMTGQgtJIXMFqU9ajU1MTS/
Currently educating myself of PerfView and haven't found anything interesting yet. Except for the fact that all the CPU-intensive traces and ending up with a ROOT node. Not sure what that means.
dmitry-novoselov
on 4 Aug 2020
cc @brianrob
davidfowl
on 4 Aug 2020
@dmitry-novoselov I glanced at the traces, and can see some behavior differences. How should I think about the behavior of the app when you captured each of these? There's trace 1 and trace 3. Trace 1 appears to have more going on than trace 3, but I'd like to confirm if trace 3 represents "no issue" and trace 1 represents the issue, or if I should think about these differently. Having a trace that exhibits the issue and one that doesn't will be the best way to root cause this.
 brianrob
on 5 Aug 2020
brianrob
on 5 Aug 2020
@brianrob Sorry for not being clear of what the traces represent in the first place.
Both traces are taken of the core 3.1 version of the app. Just two different traces "just in case".
As far as I understand, there's no way to get such a trace of a core 2.2 app, is it?
dmitry-novoselov
on 5 Aug 2020
@dmitry-novoselov, gotcha, thanks. There is not a clean way to get an equivalent trace on .NET Core 2.2, but because you are running on Windows, you can capture two ETW traces of the scenario - one running on 2.2 and one running on 3.1. This uses the operating system profiling facility instead of the built-in .NET Core profiling facility, which was still being built during 2.2.
To do this:
- Download PerfView from https://aka.ms/PerfView.
- Prepare the repro.
- Start collection:
PerfView.exe collect - Run the repro.
- Stop collection by hitting the stop button.
This will produce a PerfViewData.etl.zip file. If you can produce one of these for the good case and one for the bad case, we should be able to see what's up.
brianrob
on 5 Aug 2020
@brianrob
Here are some snapshots, just in case with both versions of PerfView:
The site is load-tested on a few machines, some of them having a core 3.1 version, and some having a core 2.2 version. First I took PerfView32 snapshots (one on a 3.1 machine, another on a 2.2 machine, simultaneously). Then stopped the sessions and took PerfView64 snapshots (the same way).
UPD: sorry, just realized that the core 2.2 and core 3.1 site versions use different cashing middleware. That doesn't change the overall picture — the core 3.1 version is still having times more GCs and growing CPU utilization. It's just it may be confusing and misleading — comparing the apps with such significant changes. I will unify the caching middleware in the 2.2 and 3.1 versions and take new snapshots.
dmitry-novoselov
on 6 Aug 2020
@brianrob
Today I ran a load test against such a deployment:
- ld-iis-gsite-1: core 3.1, an asp.net core built-in response caching middleware
- ld-iis-gsite-2: core 2.2, an asp.net core built-in response caching middleware
- ld-iis-gsite-3: core 2.2, our custom response caching middleware (the master branch of the service)
The interesting metrics
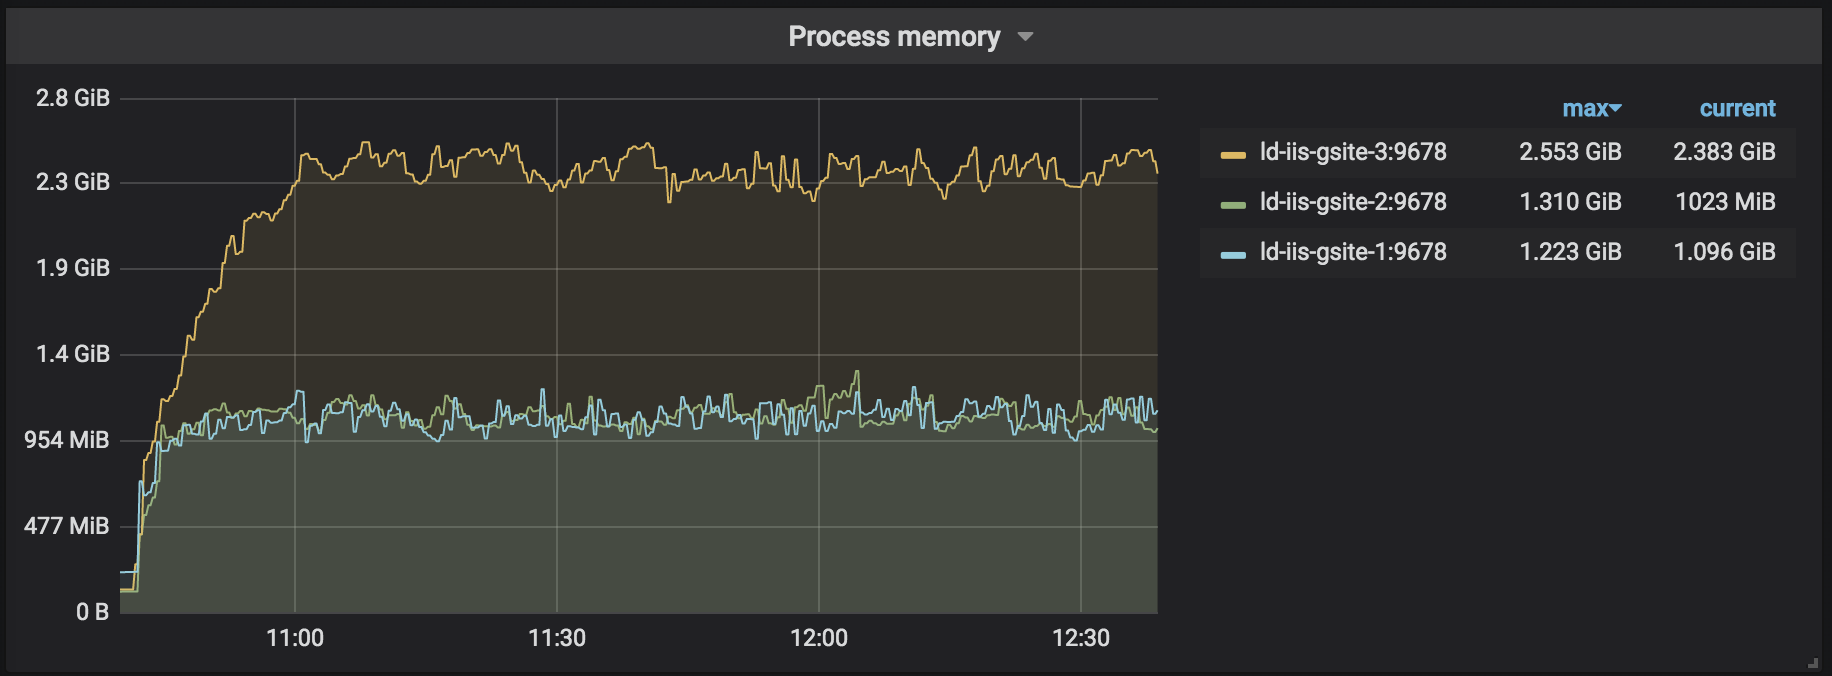
Process Memory
The built-in response caching middleware occupies about 2 times less memory:
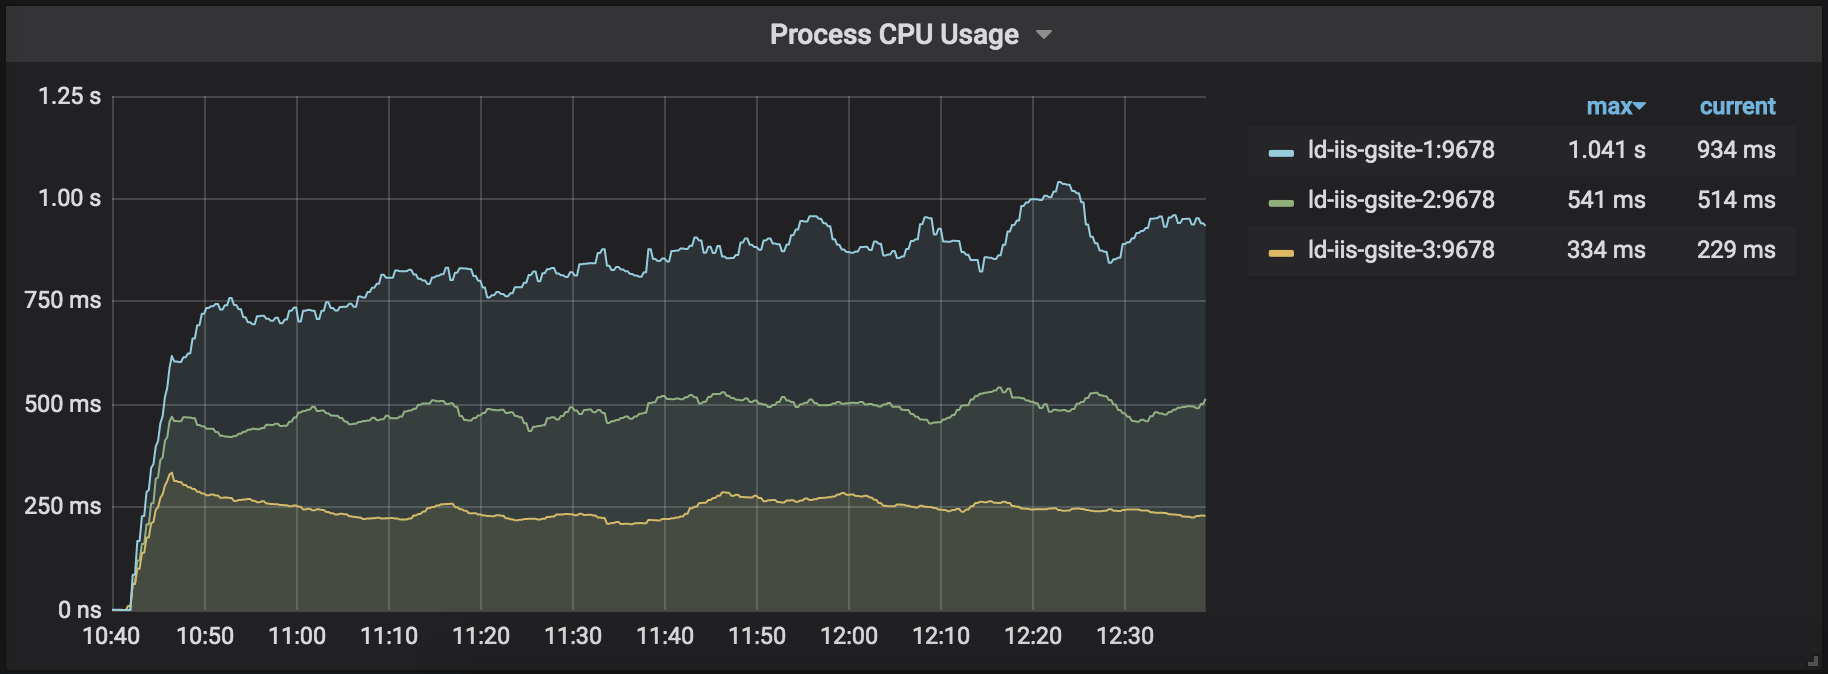
CPU utilization
The core 3.1 (using built-in response caching middleware) version's CPU utilization steadily grows, whereas the core 2.2 versions (regardless the caching middleware used) are stable:
GC
Gargabe collection behaves worse for the core 3.1 version for all generations:
gen-0:

gen-1:

gen-2:

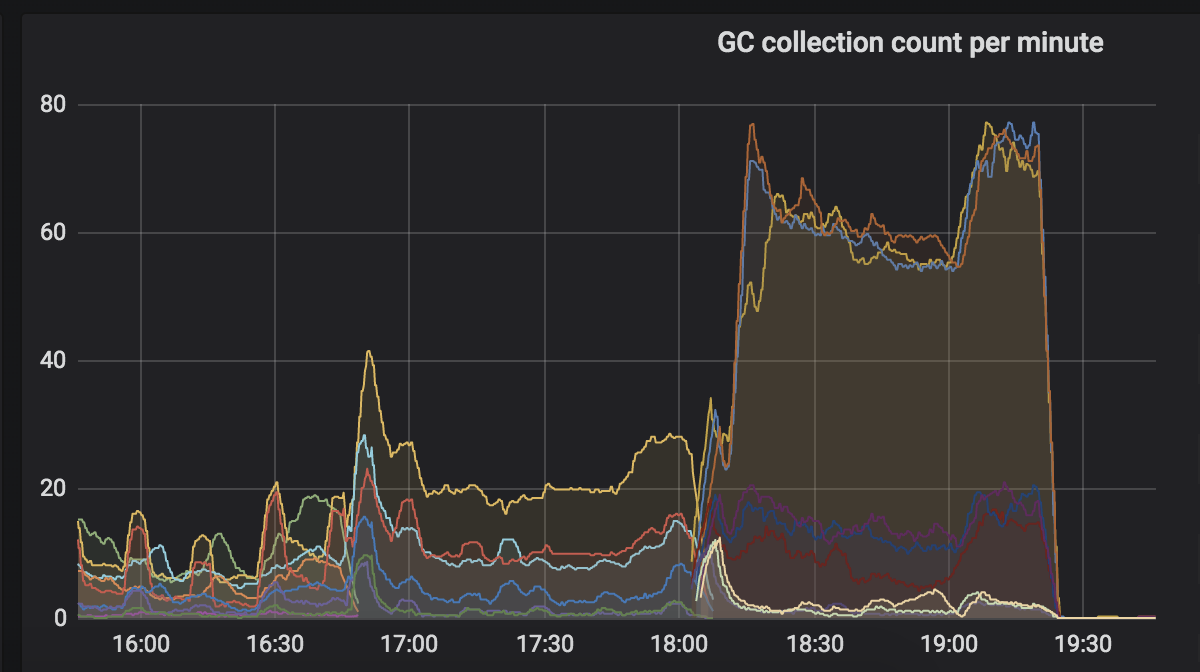
Interestingly, GC used to trigger up to 70 times per second when using our custom response caching middleware. So for this particular metric, the anti-rating would be:
- core 3.1 + our custom response caching middleware — the most GC counts per second (not present in this load test)
- core 3.1 + an asp.net core built-in response caching middleware
- core 2.2 + an asp.net core built-in response caching middleware
- core 2.2 + our custom response caching middleware — the least GC counts per second
So both the best and the worst response cashing middleware is our custom one. On core 2.2 it triggers _much_ less GCs and on core 3.1 — times _many times_ more. Hmm...
Here's a history screenshot of GCs for core 3.1 + our custom response caching middleware:
But still, if we replace our custom response cashing middleware with the built-in one, the CPU utilization keeps climbing up for core 3.1
The snapshost (Dodo.ClientSite.dll)
The snapshots are taken on ld-iis-gsite-1/2, so all using the asp.net core built-in response caching middleware:
I took the snapshots after monitoring the site under load for a couple of hours and taking the pictures. They are about 10 mins long.
dmitry-novoselov
on 10 Aug 2020
Thanks @dmitry-novoselov. I will look at this soon - I've had a few other high-pri things come up. Thanks for your patience.
brianrob
on 11 Aug 2020
@dmitry-novoselov thanks much for your patience. I believe I have identified the difference. It looks like On the 3.1 site, you are consuming some of the .NET runtime events via a managed EventListener. This is resulting in lots of CPU in the EventPipe mechanism, as the events must be emitted and then pumped through the EventListener.
Looking at your traces, and comparing a 100 second sample, here are some statistics:
Milliseconds (Samples) of CPU:
.NET Core 2.2: 94K
.NET Core 3.1: 143K
Diff: 49K
As I mentioned above, the main difference that I see is the EventPipe mechanism, which is using 44K milliseconds of CPU. That leaves the unexplained diff at 5K, which could certainly be explained by the increased GC and allocations, much of which are likely due to the fact that when you run these events through a managed EventListener, they get deserialized into managed objects, all of which are allocations we don't see in the .NET Core 2.2 case.
Based on this, you have a few options moving forward:
- If you didn't intend to do this, you can find the EventListener and disable it. It looks like the Listener in question is
Prometheus.DotNetRuntime.DotNetEventListener. - If you don't need all of the events that are being emitted (it looks like the most verbose one is the ThreadPool/IODequeue event), you can disable some of the more verbose events, which will bring the cost down.
- If you do need all of this, you can live with it.
Also, cc'ing @noahfalk. It looks like with the event load here, there is a decent amount of time spinning to acquire a new buffer:

Just an FYI in case you've seen other cases with this behavior.
brianrob
on 13 Aug 2020
Just an FYI in case you've seen other cases with this behavior.
Thanks @brianrob! (And yes we have seen and want to fix that spinning issue)
 noahfalk
on 13 Aug 2020
noahfalk
on 13 Aug 2020
@brianrob Just tried to turn off collecting the metrics, and CPU utilization dropped significantly. Will tune the metrics collection to have only essential ones. Thanks a lot for the insight!
But as for GCs, they remained the same. Could you provide any hits on causes of the LOH memory traffic?
dmitry-novoselov
on 14 Aug 2020
Yes, it looks like the biggest contributor to the LOH is this stack:
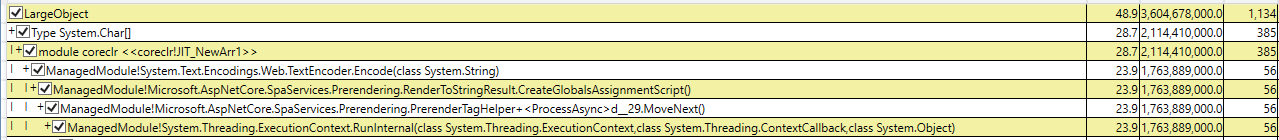
These are quite large allocations - an average of 30MB each.
brianrob
on 15 Aug 2020
Will look into that. Thanks again!
dmitry-novoselov
on 17 Aug 2020
@brianrob I am trying to find the stack from your screenshot (the most contributing to the LOH) and haven't managed to yet. I guess, it should be the GC Heap Alloc Ignore Free view? But I see another stack there:
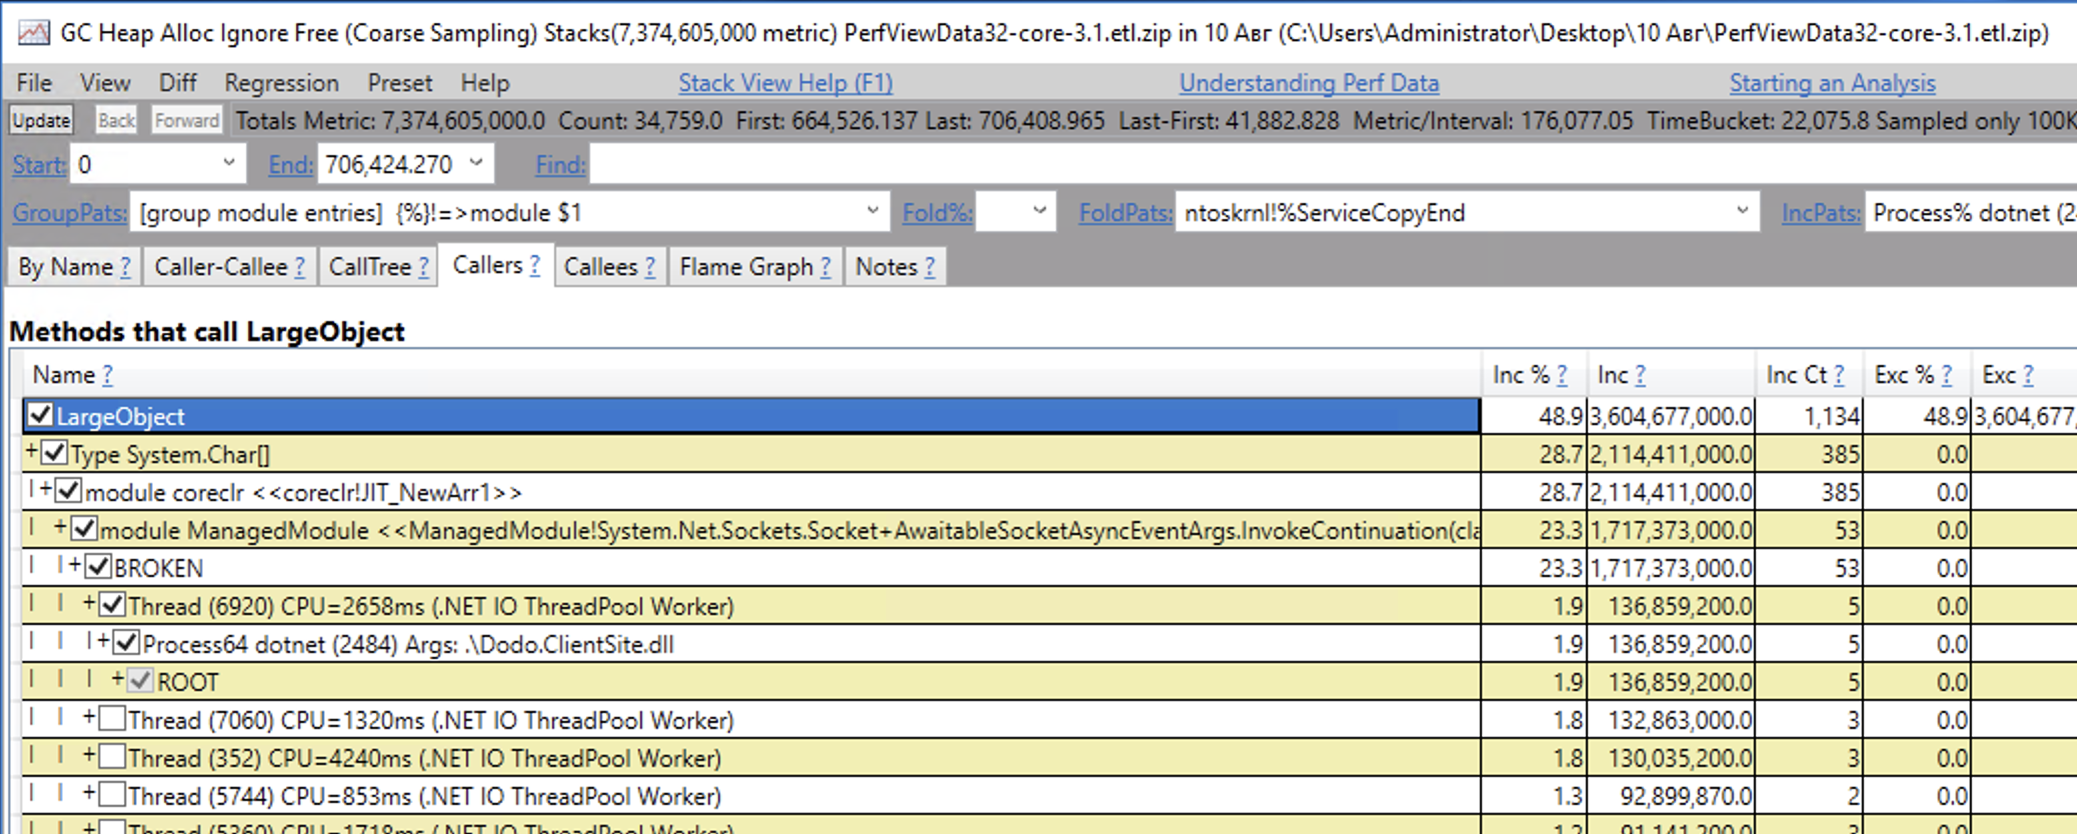
And btw, pretty much all the stacks are BROKEN. When I open the view, I see this dialog:

And I used to think the BROKEN nodes are due to this issue, but your stack seems to be OK/non-BROKEN. Can I do anything to fix the stacks for me?
dmitry-novoselov
on 17 Aug 2020
The issue that you've run into here because of a feature called folding. It's goal is to hide stuff that you might not care about. Notice that in the GroupPats field (top left), the pattern chosen is called Group Module Entries. This means that we only show one frame for each transition between two modules on the stack. So, ManagedModule actually has many more frames that are hidden. Try clearing GroupPats and hitting enter. You should get a much deeper stack. If that shows too much, you can also switch back to Group Module Entries, and then right click on the ManagedModule frame, select Grouping --> Ungroup Module. That should get you the stack that I saw. Good luck!
brianrob
on 18 Aug 2020
Related issues
 githubgitgit
·
3Comments
githubgitgit
·
3Comments
 FourLeafClover
·
3Comments
FourLeafClover
·
3Comments
 ipinak
·
3Comments
ipinak
·
3Comments
 aurokk
·
3Comments
aurokk
·
3Comments
 TanvirArjel
·
3Comments
TanvirArjel
·
3Comments